Estimated zip code population in 2022: 4,034 Zip code population in 2010: 3,736 Zip code population in 2000: 3,663
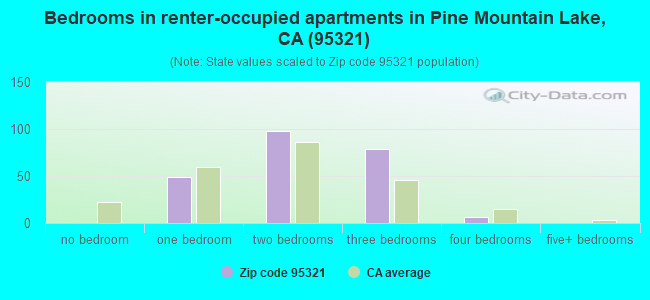
Houses and condos: 3,736 Renter-occupied apartments: 232
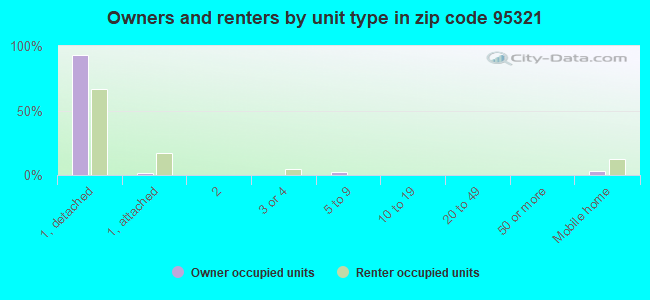
% of renters here:
13%
State:
44%
March 2022 cost of living index in zip code 95321: 97.3 (near average, U.S. average is 100)
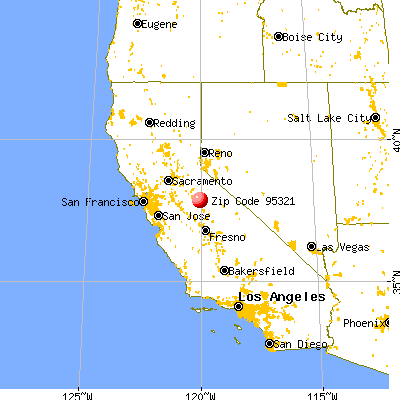
Land area: 175.2 sq. mi. Water area: 1.0 sq. mi.
Population density: 23 people per square mile
(very low).
OSM Map
General Map
Google Map
MSN Map
OSM Map
General Map
Google Map
MSN Map
OSM Map
General Map
Google Map
MSN Map
OSM Map
General Map
Google Map
MSN Map
Please wait while loading the map...
Real estate property taxes paid for housing units in 2022:
This zip code:
0.6% ($2,629)
California:
0.7% ($4,831)
Median real estate property taxes paid for housing units with mortgages in 2022: $2,813 (0.6%) Median real estate property taxes paid for housing units with no mortgage in 2022: $2,543 (0.7%)
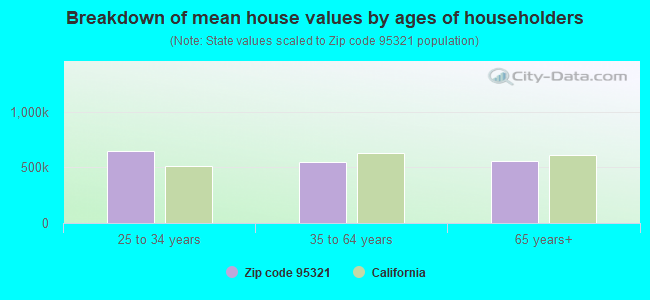
Estimated median house/condo value in 2022: $405,564
95321:
$405,564
California:
$715,900
According to our research of California and other state lists, there were 6 registered sex offenders living in 95321 zip code as of May 28, 2024. The ratio of all residents to sex offenders in zip code 95321 is 552 to 1. The ratio of registered sex offenders to all residents in this zip code is near the state average.
Median resident age:
This zip code:
59.8 years
California median age:
37.9 years
Average household size:
This zip code:
2.1 people
California:
2.8 people
Averages for the 2020 tax year for zip code 95321, filed in 2021:
Average Adjusted Gross Income (AGI) in 2020: $74,740 (Individual Income Tax Returns)
Here:
$74,740
State:
$95,910
Salary/wage: $59,093 (reported on 58.0% of returns)
Here:
$59,093
State:
$77,331
(% of AGI for various income ranges: 1069.7% for AGIs below $25k, 3399.2% for AGIs $25k-50k, 4522.7% for AGIs $50k-75k, 7353.7% for AGIs $75k-100k, 15663.0% for AGIs $100k-200k, 66980.0% for AGIs over 200k)
Taxable interest for individuals: $2,508 (reported on 43.7% of returns)
This zip code:
$2,508
California:
$2,294
(% of AGI for various income ranges: 21.7% for AGIs below $25k, 71.7% for AGIs $25k-50k, 136.7% for AGIs $50k-75k, 333.8% for AGIs $75k-100k, 413.0% for AGIs $100k-200k, 2620.0% for AGIs over 200k)
Ordinary dividends: $7,682 (reported on 25.3% of returns)
Here:
$7,682
State:
$10,949
(% of AGI for various income ranges: 53.4% for AGIs below $25k, 93.8% for AGIs $25k-50k, 270.0% for AGIs $50k-75k, 500.0% for AGIs $75k-100k, 844.0% for AGIs $100k-200k, 4503.3% for AGIs over 200k)
Net capital gain/loss in AGI: +$29,237 (reported on 26.4% of returns)
Here:
+$29,237
State:
+$49,306
(% of AGI for various income ranges: 26.9% for AGIs below $25k, 144.2% for AGIs $25k-50k, 308.0% for AGIs $50k-75k, 543.8% for AGIs $75k-100k, 1385.0% for AGIs $100k-200k, 35810.0% for AGIs over 200k)
Profit/loss from business: +$18,549 (reported on 20.1% of returns)
Here:
+$18,549
State:
+$15,671
(% of AGI for various income ranges: 96.6% for AGIs below $25k, 252.1% for AGIs $25k-50k, 492.0% for AGIs $50k-75k, 1350.0% for AGIs $75k-100k, 1085.0% for AGIs $100k-200k, 9013.3% for AGIs over 200k)
Taxable individual retirement arrangement distribution: $22,373 (reported on 17.2% of returns)
95321:
$22,373
California:
$23,505
(% of AGI for various income ranges: 165.5% for AGIs below $25k, 257.9% for AGIs $25k-50k, 609.3% for AGIs $50k-75k, 1180.0% for AGIs $75k-100k, 3009.0% for AGIs $100k-200k, 2486.7% for AGIs over 200k)
Total itemized deductions: $31,214 (reported on 12.1% of returns)
Here:
$31,214
State:
$39,517
(% of AGI for various income ranges: 435.4% for AGIs $25k-50k, 507.3% for AGIs $50k-75k, 1198.8% for AGIs $75k-100k, 1913.0% for AGIs $100k-200k, 6256.7% for AGIs over 200k)
Charity contributions: $6,182 (reported on 9.8% of returns)
Here:
$6,182
State:
$12,598
(% of AGI for various income ranges: 18.3% for AGIs $25k-50k, 52.7% for AGIs $50k-75k, 160.0% for AGIs $75k-100k, 281.0% for AGIs $100k-200k, 1730.0% for AGIs over 200k)
Taxes paid: $7,519 (reported on 12.1% of returns)
95321:
$7,519
State:
$8,807
(% of AGI for various income ranges: 69.2% for AGIs $25k-50k, 128.0% for AGIs $50k-75k, 277.5% for AGIs $75k-100k, 488.0% for AGIs $100k-200k, 1703.3% for AGIs over 200k)
Earned income credit: $1,716 (reported on 10.9% of returns)
Here:
$1,716
State:
$2,074
(% of AGI for various income ranges: 74.5% for AGIs below $25k, 45.8% for AGIs $25k-50k)
Percentage of individuals using paid preparers for their 2020 taxes: 92.0%
Here:
92%
State:
92%
(% for various income ranges: 88.9% for AGIs below $25k, 92.7% for AGIs $25k-50k, 92.0% for AGIs $50k-75k, 94.1% for AGIs $75k-100k, 92.3% for AGIs $100k-200k, 100.0% for AGIs over 200k)
Averages for the 2012 tax year for zip code 95321, filed in 2013:
Average Adjusted Gross Income (AGI) in 2012: $56,835 (Individual Income Tax Returns)
Here:
$56,835
State:
$72,726
Salary/wage: $42,853 (reported on 58.1% of returns)
Here:
$42,853
State:
$59,079
(% of AGI for various income ranges: 52.6% for AGIs below $25k, 45.7% for AGIs $25k-50k, 42.5% for AGIs $50k-75k, 37.2% for AGIs $75k-100k, 42.8% for AGIs $100k-200k, 46.2% for AGIs over 200k)
Taxable interest for individuals: $1,773 (reported on 49.7% of returns)
This zip code:
$1,773
California:
$2,146
(% of AGI for various income ranges: 2.1% for AGIs below $25k, 1.0% for AGIs $25k-50k, 1.1% for AGIs $50k-75k, 1.6% for AGIs $75k-100k, 1.6% for AGIs $100k-200k, 1.9% for AGIs over 200k)
Ordinary dividends: $6,441 (reported on 28.4% of returns)
Here:
$6,441
State:
$9,308
(% of AGI for various income ranges: 3.2% for AGIs below $25k, 2.4% for AGIs $25k-50k, 3.0% for AGIs $50k-75k, 2.3% for AGIs $75k-100k, 3.6% for AGIs $100k-200k, 4.2% for AGIs over 200k)
Net capital gain/loss in AGI: +$11,630 (reported on 25.8% of returns)
Here:
+$11,630
State:
+$30,460
(% of AGI for various income ranges: 0.2% for AGIs $25k-50k, 0.4% for AGIs $50k-75k, 1.1% for AGIs $75k-100k, 3.0% for AGIs $100k-200k, 21.6% for AGIs over 200k)
Profit/loss from business: +$12,518 (reported on 21.9% of returns)
Here:
+$12,518
State:
+$17,064
(% of AGI for various income ranges: 12.6% for AGIs below $25k, 7.0% for AGIs $25k-50k, 5.1% for AGIs $50k-75k, 3.0% for AGIs $75k-100k, 5.9% for AGIs $100k-200k)
Taxable individual retirement arrangement distribution: $20,794 (reported on 21.9% of returns)
95321:
$20,794
California:
$19,557
(% of AGI for various income ranges: 5.5% for AGIs below $25k, 7.8% for AGIs $25k-50k, 7.1% for AGIs $50k-75k, 10.0% for AGIs $75k-100k, 14.7% for AGIs $100k-200k)
Total itemized deductions: $24,357 (26% of AGI, reported on 40.6% of returns)
Here:
$24,357
State:
$34,004
Here:
26.2% of AGI
State:
22.7% of AGI
(% of AGI for various income ranges: 22.2% for AGIs below $25k, 18.5% for AGIs $25k-50k, 16.0% for AGIs $50k-75k, 15.9% for AGIs $75k-100k, 17.3% for AGIs $100k-200k, 17.1% for AGIs over 200k)
Charity contributions: $2,759 (reported on 34.8% of returns)
Here:
$2,759
State:
$4,659
(% of AGI for various income ranges: 1.3% for AGIs below $25k, 1.6% for AGIs $25k-50k, 1.8% for AGIs $50k-75k, 1.6% for AGIs $75k-100k, 2.2% for AGIs $100k-200k, 1.3% for AGIs over 200k)
Taxes paid: $8,378 (reported on 40.6% of returns)
95321:
$8,378
State:
$14,448
(% of AGI for various income ranges: 4.9% for AGIs below $25k, 3.7% for AGIs $25k-50k, 3.8% for AGIs $50k-75k, 5.1% for AGIs $75k-100k, 7.4% for AGIs $100k-200k, 8.8% for AGIs over 200k)
Earned income credit: $2,064 (reported on 14.2% of returns)
Here:
$2,064
State:
$2,286
(% of AGI for various income ranges: 5.5% for AGIs below $25k, 0.6% for AGIs $25k-50k)
Percentage of individuals using paid preparers for their 2012 taxes: 58.1%
Here:
58%
State:
64%
(% for various income ranges: 48.3% for AGIs below $25k, 62.2% for AGIs $25k-50k, 68.2% for AGIs $50k-75k, 62.5% for AGIs $75k-100k, 64.7% for AGIs $100k-200k, 60.0% for AGIs over 200k)
Averages for the 2004 tax year for zip code 95321, filed in 2005:
Average Adjusted Gross Income (AGI) in 2004: $50,325 (Individual Income Tax Returns)
Here:
$50,325
State:
$58,600
Salary/wage: $35,264 (reported on 61.2% of returns)
Here:
$35,264
State:
$49,455
(% of AGI for various income ranges: 107.7% for AGIs below $10k, 47.3% for AGIs $10k-25k, 50.7% for AGIs $25k-50k, 42.0% for AGIs $50k-75k, 48.5% for AGIs $75k-100k, 34.5% for AGIs over 100k)
Taxable interest for individuals: $2,750 (reported on 64.1% of returns)
This zip code:
$2,750
California:
$2,365
(% of AGI for various income ranges: 14.7% for AGIs below $10k, 4.5% for AGIs $10k-25k, 3.5% for AGIs $25k-50k, 2.8% for AGIs $50k-75k, 3.6% for AGIs $75k-100k, 3.4% for AGIs over 100k)
Taxable dividends: $3,673 (reported on 34.7% of returns)
Here:
$3,673
State:
$4,746
(% of AGI for various income ranges: 14.7% for AGIs below $10k, 4.2% for AGIs $10k-25k, 1.9% for AGIs $25k-50k, 2.0% for AGIs $50k-75k, 2.3% for AGIs $75k-100k, 2.6% for AGIs over 100k)
Net capital gain/loss: +$13,976 (reported on 30.1% of returns)
Here:
+$13,976
State:
+$23,418
(% of AGI for various income ranges: -10.8% for AGIs below $10k, -0.2% for AGIs $10k-25k, 1.1% for AGIs $25k-50k, 1.5% for AGIs $50k-75k, 6.6% for AGIs $75k-100k, 18.2% for AGIs over 100k)
Profit/loss from business: +$14,619 (reported on 23.3% of returns)
Here:
+$14,619
State:
+$16,826
(% of AGI for various income ranges: 12.6% for AGIs below $10k, 10.0% for AGIs $10k-25k, 4.8% for AGIs $25k-50k, 3.1% for AGIs $50k-75k, 4.2% for AGIs $75k-100k, 9.9% for AGIs over 100k)
IRA payment deduction: $3,554 (reported on 3.9% of returns)
95321:
$3,554
California:
$3,192
(% of AGI for various income ranges: 0.4% for AGIs $10k-25k, 0.5% for AGIs $25k-50k, 0.4% for AGIs $50k-75k, 0.2% for AGIs over 100k)
Self-employed pension: $15,476 (reported on 1.3% of returns)
Here:
$15,476
California:
$17,688
Total itemized deductions: $19,490 (25% of AGI, reported on 45.7% of returns)
Here:
$19,490
State:
$28,113
Here:
25.0% of AGI
State:
25.3% of AGI
(% of AGI for various income ranges: 63.1% for AGIs below $10k, 22.8% for AGIs $10k-25k, 18.9% for AGIs $25k-50k, 17.6% for AGIs $50k-75k, 18.8% for AGIs $75k-100k, 14.6% for AGIs over 100k)
Charity contributions deductions: $2,287 (3% of AGI, reported on 39.7% of returns)
Here:
$2,287
State:
$3,923
Here:
2.8% of AGI
State:
3.3% of AGI
(% of AGI for various income ranges: 2.5% for AGIs below $10k, 1.7% for AGIs $10k-25k, 2.1% for AGIs $25k-50k, 1.8% for AGIs $50k-75k, 2.3% for AGIs $75k-100k, 1.5% for AGIs over 100k)
Total tax: $7,244 (reported on 79.1% of returns)
95321:
$7,244
State:
$10,761
(% of AGI for various income ranges: 7.1% for AGIs below $10k, 4.5% for AGIs $10k-25k, 7.1% for AGIs $25k-50k, 9.4% for AGIs $50k-75k, 11.1% for AGIs $75k-100k, 16.1% for AGIs over 100k)
Earned income credit: $1,512 (reported on 10.3% of returns)
Here:
$1,512
State:
$1,763
Percentage of individuals using paid preparers for their 2004 taxes: 62.9%
Here:
63%
State:
66%
(% for various income ranges: 53.7% for AGIs below $10k, 55.5% for AGIs $10k-25k, 64.1% for AGIs $25k-50k, 69.3% for AGIs $50k-75k, 69.8% for AGIs $75k-100k, 76.7% for AGIs over 100k)
Likely homosexual households (counted as self-reported same-sex unmarried-partner households)
Lesbian couples: 0.3% of all households
Gay men: 0.0% of all households
Household received Food Stamps/SNAP in the past 12 months: 254 Household did not receive Food Stamps/SNAP in the past 12 months: 1,553
Women who had a birth in the past 12 months: 12 (4 now married, 8 unmarried) Women who did not have a birth in the past 12 months: 475 (210 now married, 263 unmarried)
Housing units in zip code 95321 with a mortgage: 817 (112 second mortgage, 61 both second mortgage and home equity loan) Houses without a mortgage: 32
Median monthly owner costs for units with a mortgage: $1,884 Median monthly owner costs for units without a mortgage: $774
Residents with income below the poverty level in 2022:
This zip code:
9.6%
Whole state:
12.2%
Residents with income below 50% of the poverty level in 2022:
This zip code:
2.2%
Whole state:
6.2%
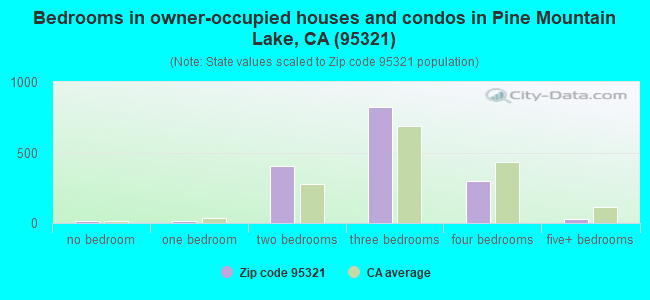
Median number of rooms in houses and condos:
Here:
5.8
State:
6.0
Median number of rooms in apartments:
Here:
4.3
State:
3.9
Notable locations in this zip code not listed on our city pages
Notable locations in zip code 95321: Rainbow Pool Picnic Area (A), Groveland District Ranger Office (B), Crook Ranch (C), Graham Ranch (D), Lake Eleanor District Ranger Office (E), Middlefork Campground (F), Carlon Station (G), Big Oak Flat District Ranger Office (H), Groveland Landfill (I), Harden Ranch (J), Berkeley-Tuolumne Campground (K), Sweetwater Campground (L), Big Oak Flat Entrance (M), Carlon Campground (N), Peach Growers (O), Hetch Hetchy Campground (P), Miguel Meadow Ranger Station (Q), Hetch Hetchy Backpackers Campground (R), Hetch Hetchy Entrance (S), Hodgdon Meadow Campground (T). Display/hide their locations on the map
Rivers and creeks: Deer Creek (A), Middle Tuolumne River (B), Moccasin Creek (C), South Fork Tuolumne River (D), Soldier Creek (E), Rush Creek (F), Miguel Creek (G), Hells Hollow Creek (H), Granite Creek (I). Display/hide their locations on the map
In group quarters: 261 (-1 institutionalized population)
Size of family households: 666 2-persons, 189 3-persons, 127 4-persons, 104 5-persons
Size of nonfamily households: 619 1-person, 110 2-persons
374 married couples with children.
18 single-parent households (18 women).
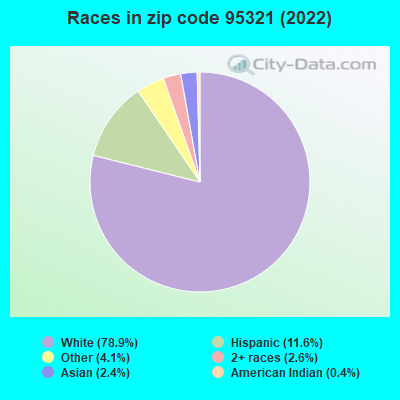
88.0% of residents of 95321 zip code speak English at home.
7.8% of residents speak Spanish at home (55% very well, 33% well, 4% not well, 8% not at all).
3.6% of residents speak other Indo-European language at home (100% very well).
1.6% of residents speak Asian or Pacific Island language at home (61% very well, 28% well, 11% not well).
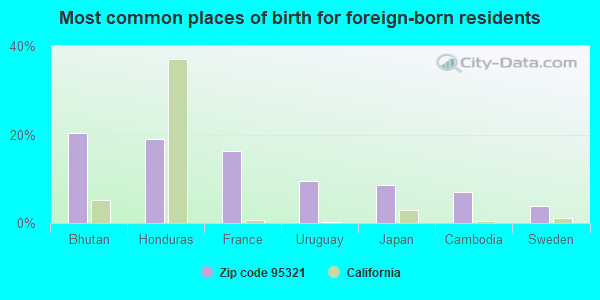
Foreign born population: 433 (10.8%) (59.7% of them are naturalized citizens)
This zip code:
10.8%
Whole state:
26.7%
20%Bhutan
19%Honduras
16%France
9%Uruguay
9%Japan
7%Cambodia
4%Sweden
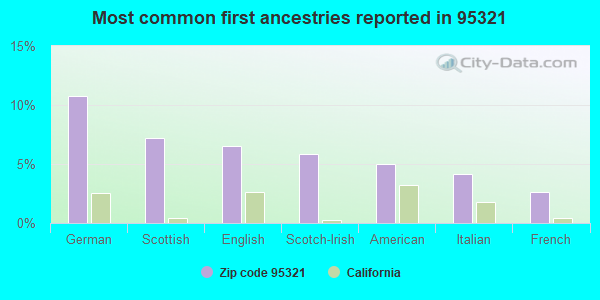
11%German
7%Scottish
7%English
6%Scotch-Irish
5%American
4%Italian
3%French
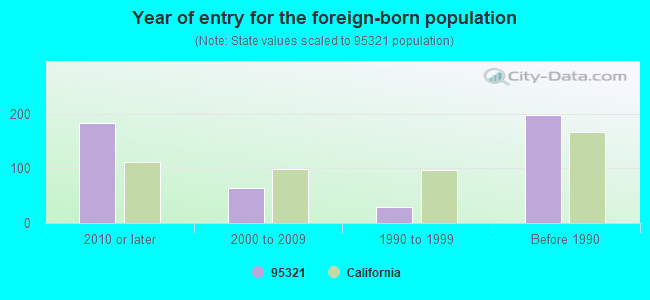
Year of entry for the foreign-born population
1832010 or later
642000 to 2009
291990 to 1999
198Before 1990
Facilities with environmental interests located in this zip code:
GROVELAND RANGER STATION (24545 HIGHWAY 120 in GROVELAND, CA) . Federal Facility. FOREST SERVICE
CRITERIA AND HAZARDOUS AIR POLLUTANT INVENTORY (Inventory of air pollution sources) (Resource Conservation and Recovery Act (tracking hazardous waste)) Business SIC classification: REFUSE SYSTEMS Business NAICS classification: SOLID WASTE LANDFILL. Organizations: USDA FOREST SERVICE (CONTACT/OWNER)
Alternative names: USDA FOREST SERVICE
CAL TRANS (HWY 120 AND SERRETTI RD in GROVELAND, CA)
Small Quantity Generators, between 100 kg and 1000 kg of hazardous waste/month (Resource Conservation and Recovery Act (tracking hazardous waste)) - notification Organizations: CALIFORNIA STATE OF (CONTACT/OWNER)
Housing units lacking complete plumbing facilities: 1.2% Housing units lacking complete kitchen facilities: 2.5%
53.9%Bottled, tank, or LP gas
25.9%Wood
10.9%Electricity
3.7%Other fuel
2.8%Utility gas
2.2%No fuel used
Population in 1990: 3,616. Population change in the 1990s: +47 (+1.3%).
Place of birth for U.S.-born residents:
This state: 2,377
Northeast: 208
Midwest: 357
South: 181
West: 416
60% of the 95321 zip code residents lived in the same house 5 years ago. Out of people who lived in different houses, 30% lived in this county. Out of people who lived in different counties, 50% lived in California.
91% of the 95321 zip code residents lived in the same house 1 year ago. Out of people who lived in different houses, 41% moved from this county. Out of people who lived in different houses, 50% moved from different county within same state. Out of people who lived in different houses, 10% moved from different state.
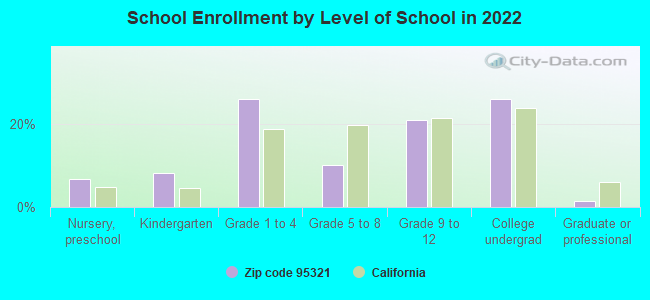
Private vs. public school enrollment:
Students in private schools in grades 1 to 8 (elementary and middle school):
Here:
0.0%
California:
10.5%
Students in private schools in grades 9 to 12 (high school):
Here:
0.0%
California:
8.5%
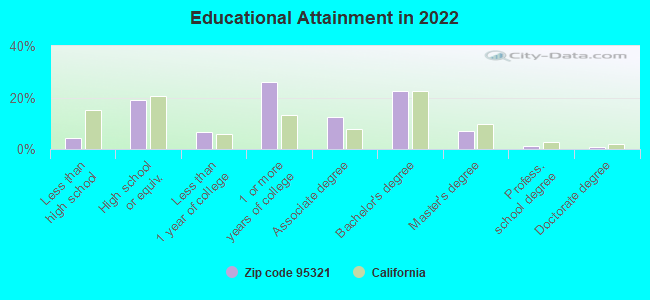
Students in private undergraduate colleges: 42
Here:
27.3%
California:
15.9%
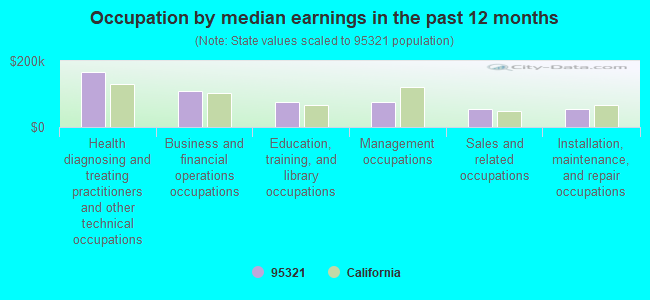
Occupation by median earnings in the past 12 months ($)
165,504Health diagnosing and treating practitioners and other technical occupations
109,732Business and financial operations occupations
76,033Education, training, and library occupations
75,560Management occupations
56,024Sales and related occupations
55,344Installation, maintenance, and repair occupations
Companies with federal contracts located in this zip code:
KENNETH L ORLOFF (PO BOX 990 in GROVELAND, CA; small business) : $1,445,656 in 28 contractsfrom 2001 to 2005
Contracts for Expert Witness, Legal Services by Offices, Boards and Divisions (includes Attorney General, Deputy Attorney General, etc.) Signed by year:2000: $0; 2001: $60,000; 2002: $163,000; 2003: $521,227; 2004: $252,466; 2005: $448,963; 2006: $0.
Biggest contracts:
$130,630 with Offices, Boards and Divisions (includes Attorney General, Deputy Attorney General, etc.) for Expert Witness. Taking place in DC. Signed on 2003-05-15. Completion date: 2004-06-15.
$130,360, same as above.Signed on 2003-08-15. Completion date: 2004-08-15.
$120,959, same as above.Signed on 2003-09-15. Completion date: 2004-01-15.
$87,650 with Offices, Boards and Divisions (includes Attorney General, Deputy Attorney General, etc.) for Expert Witness. Signed on 2005-03-18. Completion date: 2006-10-30.
G & C SYSTEMS INC (20691 CHAPARRAL COURT in GROVELAND, CA; small business)
$99,594 with Air Force for Defense Electronics and Communication Equipment -- Basic Research (R&D). Signed on 2004-05-11. Completion date: 2005-02-07.
ROBERT L RIDGLEY (19353 PINE MOUNTAIN DRIVE in GROVELAND, CA; small business) : $24,998 in 4 contractsin 2004
$12,499 with Army for Other Housekeeping Services. Signed on 2004-06-09. Completion date: 2004-05-01.
$12,499 with U.S. Army Corps of Engineers - civil program financing only for Other Housekeeping Services. Signed on 2004-06-09. Completion date: 2004-05-01.
$0, same as above.Signed on 2004-06-09. Completion date: 2004-05-01.
$0 with Army for Other Housekeeping Services. Signed on 2004-06-09. Completion date: 2004-05-01.
Top industries in this zip code by the number of employees in 2005:
Other Services (except Public Administration): Other Similar Organizations (except Business, Professional, Labor, and Political Organizations) (50-99: 1, 1-4: 1)
Accommodation and Food Services: Hotels (except Casino Hotels) and Motels (20-49: 1, 5-9: 2, 1-4: 3)
Professional, Scientific, and Technical Services: Offices of Lawyers (20-49: 1, 1-4: 1)
Construction: New Single-Family Housing Construction (except Operative Builders) (5-9: 3, 1-4: 6)
Real Estate and Rental and Leasing: Offices of Real Estate Agents and Brokers (5-9: 3, 1-4: 4)
Accommodation and Food Services: Bed-and-Breakfast Inns (10-19: 1, 1-4: 2)
Real Estate and Rental and Leasing: Lessors of Other Real Estate Property (10-19: 1, 1-4: 1)
Educational Services: Educational Support Services (10-19: 1)
Construction: Site Preparation Contractors (10-19: 1)
People in group quarters in 2010:
66 people in other noninstitutional facilities
People in group quarters in 2000:
16 people in other workers' dormitories
Fatal accident statistics in 2014:
Fatal accident count: 3
Vehicles involved in fatal accidents: 5
Fatal accidents caused by drunken drivers: 1
Fatalities: 3
Persons involved in fatal accidents: 7
Pedestrians involved in fatal accidents: 0
Fatal accident statistics in 2011:
Fatal accident count: 2
Vehicles involved in fatal accidents: 3
Fatal accidents caused by drunken drivers: 1
Fatalities: 3
Persons involved in fatal accidents: 4
Pedestrians involved in fatal accidents: 0
2005 - 2018 National Fire Incident Reporting System (NFIRS) incidents
Based on the data from the years 2005 - 2018 the average number of fire incidents per year is 30. The highest number of fires - 53 took place in 2008, and the least - 11 in 2006. The data has a declining trend.
When looking into fire subcategories, the most incidents belonged to: Outside Fires (57.1%), and Structure Fires (21.3%).
Fire incident types reported to NFIRS in Zip Code 95321


 Nearest zip codes: 95311, 95379, 95305, 95346, 95345, 95335.


 . Federal Facility. FOREST SERVICE


 Based on the data from the years 2005 - 2018 the average number of fire incidents per year is 30. The highest number of fires - 53 took place in 2008, and the least - 11 in 2006. The data has a declining trend.
 When looking into fire subcategories, the most incidents belonged to: Outside Fires (57.1%), and Structure Fires (21.3%).