Estimated zip code population in 2022: 3,849 Zip code population in 2010: 4,985 Zip code population in 2000: 4,145
Houses and condos: 1,324 Renter-occupied apartments: 599
% of renters here:
50%
State:
44%
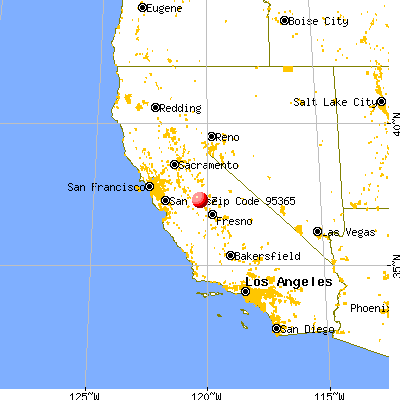
March 2022 cost of living index in zip code 95365: 93.7 (less than average, U.S. average is 100)
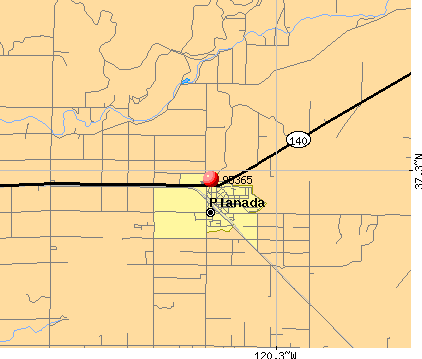
Land area: 15.2 sq. mi. Water area: 0.0 sq. mi.
Population density: 254 people per square mile
(very low).
OSM Map
General Map
Google Map
MSN Map
OSM Map
General Map
Google Map
MSN Map
OSM Map
General Map
Google Map
MSN Map
OSM Map
General Map
Google Map
MSN Map
Please wait while loading the map...
Real estate property taxes paid for housing units in 2022:
This zip code:
0.6% ($1,521)
California:
0.7% ($4,831)
Median real estate property taxes paid for housing units with mortgages in 2022: $1,846 (0.8%) Median real estate property taxes paid for housing units with no mortgage in 2022: $1,284 (0.5%)
Business Search- 14 Million verified businesses
Males: 2,097
(54.5%)
Females: 1,752
(45.5%)
For population 25 years and over in 95365:
High school or higher: 45.6%
Bachelor's degree or higher: 5.8%
Graduate or professional degree: 1.0%
Unemployed: 10.0%
Mean travel time to work (commute): 24.6 minutes
For population 15 years and over in 95365:
Never married: 38.5%
Now married: 45.3%
Separated: 4.8%
Widowed: 6.8%
Divorced: 4.6%
Zip code 95365 compared to state average:
Median household income below state average.
Median house value significantly below state average.
Unemployed percentage above state average.
Black race population percentage significantly below state average.
Hispanic race population percentage above state average.
Median age below state average.
Foreign-born population percentage above state average.
Length of stay since moving in significantly above state average.
Percentage of population with a bachelor's degree or higher significantly below state average.
Averages for the 2020 tax year for zip code 95365, filed in 2021:
Average Adjusted Gross Income (AGI) in 2020: $37,416 (Individual Income Tax Returns)
Here:
$37,416
State:
$95,910
Salary/wage: $31,894 (reported on 92.2% of returns)
Here:
$31,894
State:
$77,331
(% of AGI for various income ranges: 1683.0% for AGIs below $25k, 4581.3% for AGIs $25k-50k, 8757.6% for AGIs $50k-75k, 13331.7% for AGIs $75k-100k, 25883.3% for AGIs $100k-200k)
Taxable interest for individuals: $100 (reported on 14.1% of returns)
This zip code:
$100
California:
$2,294
(% of AGI for various income ranges: 1.2% for AGIs below $25k, 1.1% for AGIs $25k-50k, 3.5% for AGIs $50k-75k, 5.0% for AGIs $75k-100k, 30.0% for AGIs $100k-200k)
Profit/loss from business: +$11,917 (reported on 8.7% of returns)
Here:
+$11,917
State:
+$15,671
(% of AGI for various income ranges: 100.2% for AGIs below $25k, 154.7% for AGIs $25k-50k, 419.4% for AGIs $50k-75k, 340.0% for AGIs $75k-100k)
Total itemized deductions: $27,400 (reported on 1.9% of returns)
Here:
$27,400
State:
$39,517
(% of AGI for various income ranges: 1826.7% for AGIs $75k-100k)
Charity contributions: $4,533 (reported on 1.5% of returns)
Here:
$4,533
State:
$12,598
(% of AGI for various income ranges: 80.0% for AGIs $50k-75k)
Taxes paid: $7,567 (reported on 1.5% of returns)
95365:
$7,567
State:
$8,807
(% of AGI for various income ranges: 133.5% for AGIs $50k-75k)
Earned income credit: $2,317 (reported on 28.6% of returns)
Here:
$2,317
State:
$2,074
(% of AGI for various income ranges: 147.0% for AGIs below $25k, 132.1% for AGIs $25k-50k, 6.5% for AGIs $50k-75k)
Percentage of individuals using paid preparers for their 2020 taxes: 92.2%
Here:
92%
State:
92%
(% for various income ranges: 91.4% for AGIs below $25k, 92.0% for AGIs $25k-50k, 93.5% for AGIs $50k-75k, 100.0% for AGIs $75k-100k, 87.5% for AGIs $100k-200k)
Averages for the 2012 tax year for zip code 95365, filed in 2013:
Average Adjusted Gross Income (AGI) in 2012: $28,170 (Individual Income Tax Returns)
Here:
$28,170
State:
$72,726
Salary/wage: $24,685 (reported on 95.0% of returns)
Here:
$24,685
State:
$59,079
(% of AGI for various income ranges: 79.9% for AGIs below $25k, 83.4% for AGIs $25k-50k, 88.6% for AGIs $50k-75k, 87.5% for AGIs $75k-100k, 76.7% for AGIs $100k-200k)
Taxable interest for individuals: $162 (reported on 11.7% of returns)
This zip code:
$162
California:
$2,146
(% of AGI for various income ranges: 0.1% for AGIs $50k-75k, 27.6% for AGIs $75k-100k)
Profit/loss from business: +$8,000 (reported on 7.8% of returns)
Here:
+$8,000
State:
+$17,064
(% of AGI for various income ranges: 4.1% for AGIs below $25k, 2.5% for AGIs $25k-50k, 0.5% for AGIs $50k-75k)
Total itemized deductions: $18,625 (30% of AGI, reported on 8.9% of returns)
Here:
$18,625
State:
$34,004
Here:
29.8% of AGI
State:
22.7% of AGI
(% of AGI for various income ranges: 2.1% for AGIs below $25k, 3.6% for AGIs $25k-50k, 8.7% for AGIs $50k-75k, 14.2% for AGIs $75k-100k, 19.5% for AGIs $100k-200k)
Charity contributions: $1,938 (reported on 7.3% of returns)
Here:
$1,938
State:
$4,659
(% of AGI for various income ranges: 0.4% for AGIs $25k-50k, 0.6% for AGIs $50k-75k, 3.3% for AGIs $75k-100k)
Taxes paid: $4,331 (reported on 8.9% of returns)
95365:
$4,331
State:
$14,448
(% of AGI for various income ranges: 0.3% for AGIs below $25k, 0.7% for AGIs $25k-50k, 1.8% for AGIs $50k-75k, 2.6% for AGIs $75k-100k, 7.2% for AGIs $100k-200k)
Earned income credit: $2,552 (reported on 43.0% of returns)
Here:
$2,552
State:
$2,286
(% of AGI for various income ranges: 9.9% for AGIs below $25k, 2.9% for AGIs $25k-50k)
Percentage of individuals using paid preparers for their 2012 taxes: 72.1%
Here:
72%
State:
64%
(% for various income ranges: 70.4% for AGIs below $25k, 75.0% for AGIs $25k-50k, 66.7% for AGIs $50k-75k, 75.0% for AGIs $75k-100k, 100.0% for AGIs $100k-200k)
Averages for the 2004 tax year for zip code 95365, filed in 2005:
Average Adjusted Gross Income (AGI) in 2004: $22,593 (Individual Income Tax Returns)
Here:
$22,593
State:
$58,600
Salary/wage: $20,285 (reported on 95.9% of returns)
Here:
$20,285
State:
$49,455
(% of AGI for various income ranges: 94.0% for AGIs below $10k, 85.5% for AGIs $10k-25k, 87.9% for AGIs $25k-50k, 89.3% for AGIs $50k-75k, 125.5% for AGIs $75k-100k)
Taxable interest for individuals: $389 (reported on 15.0% of returns)
This zip code:
$389
California:
$2,365
(% of AGI for various income ranges: 0.6% for AGIs below $10k, 0.4% for AGIs $10k-25k, 0.2% for AGIs $25k-50k, 0.1% for AGIs $50k-75k, 0.2% for AGIs $75k-100k)
Taxable dividends: $267 (reported on 1.7% of returns)
Here:
$267
State:
$4,746
Net capital gain/loss: +$5,812 (reported on 0.9% of returns)
Here:
+$5,812
State:
+$23,418
Profit/loss from business: +$5,950 (reported on 5.7% of returns)
Here:
+$5,950
State:
+$16,826
(% of AGI for various income ranges: -2.5% for AGIs below $10k, 1.3% for AGIs $10k-25k, 2.5% for AGIs $25k-50k, 2.1% for AGIs $50k-75k)
Total itemized deductions: $15,277 (30% of AGI, reported on 9.5% of returns)
Here:
$15,277
State:
$28,113
Here:
29.8% of AGI
State:
25.3% of AGI
(% of AGI for various income ranges: 1.8% for AGIs $10k-25k, 7.7% for AGIs $25k-50k, 11.9% for AGIs $50k-75k, 13.9% for AGIs $75k-100k, 14.9% for AGIs over 100k)
Charity contributions deductions: $1,277 (2% of AGI, reported on 8.1% of returns)
Here:
$1,277
State:
$3,923
Here:
2.4% of AGI
State:
3.3% of AGI
(% of AGI for various income ranges: 0.1% for AGIs $10k-25k, 0.4% for AGIs $25k-50k, 1.0% for AGIs $50k-75k, 2.5% for AGIs $75k-100k)
Total tax: $1,922 (reported on 44.3% of returns)
95365:
$1,922
State:
$10,761
(% of AGI for various income ranges: 1.2% for AGIs below $10k, 1.7% for AGIs $10k-25k, 3.2% for AGIs $25k-50k, 6.7% for AGIs $50k-75k, 9.7% for AGIs $75k-100k, 13.6% for AGIs over 100k)
Earned income credit: $2,018 (reported on 47.0% of returns)
Here:
$2,018
State:
$1,763
Percentage of individuals using paid preparers for their 2004 taxes: 53.6%
Here:
54%
State:
66%
(% for various income ranges: 45.2% for AGIs below $10k, 51.5% for AGIs $10k-25k, 62.4% for AGIs $25k-50k, 58.4% for AGIs $50k-75k, 58.3% for AGIs $75k-100k, 100.0% for AGIs over 100k)
Household received Food Stamps/SNAP in the past 12 months: 270 Household did not receive Food Stamps/SNAP in the past 12 months: 958
Women who had a birth in the past 12 months: 54 (37 now married, 17 unmarried) Women who did not have a birth in the past 12 months: 825 (378 now married, 445 unmarried)
Housing units in zip code 95365 with a mortgage: 348 (58 second mortgage, 47 home equity loan, 14 both second mortgage and home equity loan) Median monthly owner costs for units with a mortgage: $1,100 Median monthly owner costs for units without a mortgage: $357
Residents with income below the poverty level in 2022:
This zip code:
33.8%
Whole state:
12.2%
Residents with income below 50% of the poverty level in 2022:
This zip code:
27.0%
Whole state:
6.2%
Median number of rooms in houses and condos:
Here:
5.3
State:
6.0
Median number of rooms in apartments:
Here:
4.6
State:
3.9
Notable locations in this zip code not listed on our city pages
Size of family households: 254 2-persons, 175 3-persons, 73 4-persons, 236 5-persons, 66 6-persons, 60 7-or-more-persons
Size of nonfamily households: 296 1-person, 37 2-persons
660 married couples with children.
403 single-parent households (85 men, 318 women).
19.7% of residents of 95365 zip code speak English at home.
81.3% of residents speak Spanish at home (39% very well, 20% well, 14% not well, 28% not at all).
Foreign born population: 1,703 (44.2%) (27.5% of them are naturalized citizens)
This zip code:
44.2%
Whole state:
26.7%
99%Honduras
Year of entry for the foreign-born population
1202010 or later
4462000 to 2009
3131990 to 1999
781Before 1990
Facilities with environmental interests located in this zip code:
GRANADA HIGH (CONT.) (9722 E. HASKELL ST. in PLANADA, CA)
(National Center for Education Statistics) - STATE ID-2430064 Organizations: LE GRAND UNION HIGH (SCHOOL DISTRICT)
CEASAR E. CHAVEZ MIDDLE SCHOOL (161 S. PLAINSBURG in PLANADA, CA)
(National Center for Education Statistics) - STATE ID-6120448 Organizations: PLANADA ELEMENTARY (SCHOOL DISTRICT)
MERCED MILLING CO (40 N MARKET ST in PLANADA, CA)
AIR SYNTHETIC MINOR (AIRS/AFS) CRITERIA AND HAZARDOUS AIR POLLUTANT INVENTORY (Inventory of air pollution sources) Business SIC classification: PREPARED FEEDS AND FEED INGREDIENTS FOR ANIMALS AND FOWLS, EXCEPT DOGS AND CATS
Housing units lacking complete kitchen facilities: 4.2%
57.7%Utility gas
40.9%Electricity
0.8%No fuel used
0.7%Bottled, tank, or LP gas
Place of birth for U.S.-born residents:
This state: 1,860
Northeast: 23
Midwest: 143
South: 120
67% of the 95365 zip code residents lived in the same house 5 years ago. Out of people who lived in different houses, 87% lived in this county. Out of people who lived in different counties, 50% lived in California.
97% of the 95365 zip code residents lived in the same house 1 year ago. Out of people who lived in different houses, 58% moved from this county. Out of people who lived in different houses, 55% moved from different county within same state.
Private vs. public school enrollment:
Students in private schools in grades 1 to 8 (elementary and middle school):
Here:
0.0%
California:
10.5%
Students in private schools in grades 9 to 12 (high school):
Here:
0.0%
California:
8.5%
Students in private undergraduate colleges:
Here:
0.0%
California:
15.9%
Occupation by median earnings in the past 12 months ($)
72,084Sales and related occupations
53,167Transportation occupations
49,102Installation, maintenance, and repair occupations
39,242Production occupations
37,838Office and administrative support occupations
33,998Material moving occupations
Top industries in this zip code by the number of employees in 2005:
Accommodation and Food Services: Limited-Service Restaurants (20-49 employees: 1 establishment)
Health Care and Social Assistance: Offices of Physicians (except Mental Health Specialists) (10-19: 1)
Health Care and Social Assistance: Services for the Elderly and Persons with Disabilities (1-4: 2)
Health Care and Social Assistance: Child Day Care Services (1-4: 1)
People in group quarters in 2010:
211 people in workers' group living quarters and job corps centers
People in group quarters in 2000:
176 people in agriculture workers' dormitories on farms
12 people in unknown juvenile institutions
Fatal accident statistics in 2012:
Fatal accident count: 1
Vehicles involved in fatal accidents: 1
Fatal accidents caused by drunken drivers: 1
Fatalities: 1
Persons involved in fatal accidents: 1
Pedestrians involved in fatal accidents: 0
Fatal accident statistics in 2011:
Fatal accident count: 1
Vehicles involved in fatal accidents: 1
Fatal accidents caused by drunken drivers: 1
Fatalities: 1
Persons involved in fatal accidents: 2
Pedestrians involved in fatal accidents: 0
Home Mortgage Disclosure Act Aggregated Statistics For Year 2009 (Based on 2 partial tracts)
A) FHA, FSA/RHS & VA Home Purchase Loans
B) Conventional Home Purchase Loans
C) Refinancings
D) Home Improvement Loans
F) Non-occupant Loans on < 5 Family Dwellings (A B C & D)
Number
Average Value
Number
Average Value
Number
Average Value
Number
Average Value
Number
Average Value
LOANS ORIGINATED
8
$84,354
2
$71,895
2
$220,370
0
$0
1
$84,810
APPLICATIONS APPROVED, NOT ACCEPTED
1
$65,380
0
$0
1
$146,300
0
$0
0
$0
APPLICATIONS DENIED
1
$144,250
0
$0
3
$300,380
0
$0
0
$0
APPLICATIONS WITHDRAWN
1
$87,550
1
$65,150
2
$134,990
1
$51,440
0
$0
FILES CLOSED FOR INCOMPLETENESS
0
$0
0
$0
0
$0
0
$0
0
$0
Aggregated Statistics For Year 2008 (Based on 2 partial tracts)
A) FHA, FSA/RHS & VA Home Purchase Loans
B) Conventional Home Purchase Loans
C) Refinancings
D) Home Improvement Loans
G) Loans On Manufactured Home Dwelling (A B C & D)
Number
Average Value
Number
Average Value
Number
Average Value
Number
Average Value
Number
Average Value
LOANS ORIGINATED
4
$130,988
1
$230,200
5
$183,292
1
$42,980
0
$0
APPLICATIONS APPROVED, NOT ACCEPTED
0
$0
1
$179,450
2
$155,560
0
$0
0
$0
APPLICATIONS DENIED
1
$88,930
1
$253,520
8
$161,735
1
$122,530
1
$224,710
APPLICATIONS WITHDRAWN
0
$0
0
$0
2
$121,845
0
$0
0
$0
FILES CLOSED FOR INCOMPLETENESS
0
$0
0
$0
0
$0
0
$0
0
$0
Aggregated Statistics For Year 2007 (Based on 2 partial tracts)
B) Conventional Home Purchase Loans
C) Refinancings
D) Home Improvement Loans
F) Non-occupant Loans on < 5 Family Dwellings (A B C & D)
G) Loans On Manufactured Home Dwelling (A B C & D)
Number
Average Value
Number
Average Value
Number
Average Value
Number
Average Value
Number
Average Value
LOANS ORIGINATED
6
$203,720
19
$182,338
5
$93,818
2
$190,880
0
$0
APPLICATIONS APPROVED, NOT ACCEPTED
1
$83,900
5
$211,546
1
$152,480
0
$0
0
$0
APPLICATIONS DENIED
4
$319,298
20
$205,968
5
$130,804
2
$125,045
1
$288,260
APPLICATIONS WITHDRAWN
1
$110,640
7
$191,730
0
$0
0
$0
0
$0
FILES CLOSED FOR INCOMPLETENESS
0
$0
2
$157,390
1
$90,300
0
$0
0
$0
Aggregated Statistics For Year 2006 (Based on 2 partial tracts)
B) Conventional Home Purchase Loans
C) Refinancings
D) Home Improvement Loans
F) Non-occupant Loans on < 5 Family Dwellings (A B C & D)
G) Loans On Manufactured Home Dwelling (A B C & D)
Number
Average Value
Number
Average Value
Number
Average Value
Number
Average Value
Number
Average Value
LOANS ORIGINATED
23
$161,600
33
$165,298
6
$78,333
5
$174,148
1
$92,810
APPLICATIONS APPROVED, NOT ACCEPTED
9
$177,648
7
$177,197
2
$58,865
1
$202,310
0
$0
APPLICATIONS DENIED
8
$143,704
25
$196,523
3
$138,380
5
$204,872
0
$0
APPLICATIONS WITHDRAWN
3
$197,283
11
$161,890
1
$106,070
2
$185,965
0
$0
FILES CLOSED FOR INCOMPLETENESS
0
$0
2
$149,735
0
$0
0
$0
0
$0
Aggregated Statistics For Year 2005 (Based on 2 partial tracts)
B) Conventional Home Purchase Loans
C) Refinancings
D) Home Improvement Loans
F) Non-occupant Loans on < 5 Family Dwellings (A B C & D)
G) Loans On Manufactured Home Dwelling (A B C & D)
Number
Average Value
Number
Average Value
Number
Average Value
Number
Average Value
Number
Average Value
LOANS ORIGINATED
17
$155,179
34
$161,499
7
$110,283
7
$172,821
1
$230,660
APPLICATIONS APPROVED, NOT ACCEPTED
3
$158,573
5
$146,030
1
$46,180
0
$0
0
$0
APPLICATIONS DENIED
8
$160,249
21
$153,020
2
$123,445
3
$187,603
1
$56,010
APPLICATIONS WITHDRAWN
3
$216,713
13
$163,625
1
$164,820
2
$174,880
0
$0
FILES CLOSED FOR INCOMPLETENESS
1
$90,300
6
$144,475
1
$107,440
0
$0
0
$0
Aggregated Statistics For Year 2004 (Based on 2 partial tracts)
A) FHA, FSA/RHS & VA Home Purchase Loans
B) Conventional Home Purchase Loans
C) Refinancings
D) Home Improvement Loans
F) Non-occupant Loans on < 5 Family Dwellings (A B C & D)
G) Loans On Manufactured Home Dwelling (A B C & D)
Number
Average Value
Number
Average Value
Number
Average Value
Number
Average Value
Number
Average Value
Number
Average Value
LOANS ORIGINATED
1
$143,790
20
$138,303
27
$112,276
4
$75,722
4
$143,618
1
$106,300
APPLICATIONS APPROVED, NOT ACCEPTED
0
$0
3
$156,820
5
$120,792
1
$57,840
0
$0
0
$0
APPLICATIONS DENIED
0
$0
5
$131,490
13
$103,679
3
$97,307
1
$150,650
0
$0
APPLICATIONS WITHDRAWN
0
$0
2
$197,280
8
$133,360
1
$126,190
1
$87,780
0
$0
FILES CLOSED FOR INCOMPLETENESS
0
$0
0
$0
5
$129,570
0
$0
0
$0
0
$0
Aggregated Statistics For Year 2003 (Based on 2 partial tracts)
B) Conventional Home Purchase Loans
C) Refinancings
D) Home Improvement Loans
F) Non-occupant Loans on < 5 Family Dwellings (A B C & D)
Number
Average Value
Number
Average Value
Number
Average Value
Number
Average Value
LOANS ORIGINATED
5
$106,390
26
$98,430
1
$22,400
2
$89,955
APPLICATIONS APPROVED, NOT ACCEPTED
1
$256,720
3
$109,120
0
$0
0
$0
APPLICATIONS DENIED
2
$227,685
13
$124,921
0
$0
0
$0
APPLICATIONS WITHDRAWN
1
$83,440
7
$95,293
0
$0
0
$0
FILES CLOSED FOR INCOMPLETENESS
0
$0
2
$106,415
0
$0
0
$0
Aggregated Statistics For Year 1999 (Based on 1 partial tract)
Detailed PMIC statistics for the following Tracts:0019.01
2005 - 2018 National Fire Incident Reporting System (NFIRS) incidents
Based on the data from the years 2005 - 2018 the average number of fire incidents per year is 31. The highest number of reported fire incidents - 56 took place in 2016, and the least - 2 in 2006. The data has a growing trend.
When looking into fire subcategories, the most reports belonged to: Outside Fires (65.4%), and Mobile Property/Vehicle Fires (17.0%).
Fire incident types reported to NFIRS in Zip Code 95365


 Nearest zip codes: 95333, 95340, 95306, 95325, 95348, 95341.


 Based on the data from the years 2005 - 2018 the average number of fire incidents per year is 31. The highest number of reported fire incidents - 56 took place in 2016, and the least - 2 in 2006. The data has a growing trend.
 When looking into fire subcategories, the most reports belonged to: Outside Fires (65.4%), and Mobile Property/Vehicle Fires (17.0%).