Estimated zip code population in 2022: 5,958 Zip code population in 2010: 5,418 Zip code population in 2000: 6,201
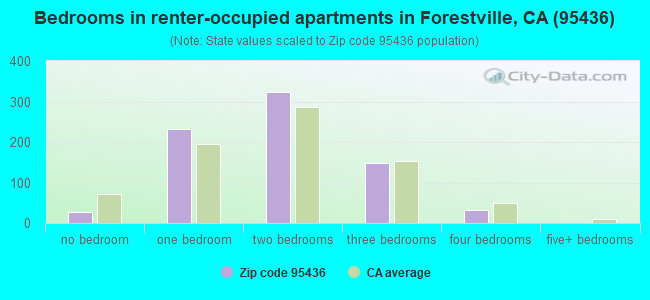
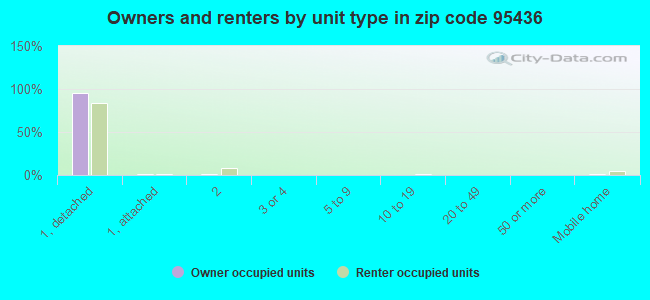
Houses and condos: 2,769 Renter-occupied apartments: 767
% of renters here:
31%
State:
44%
March 2022 cost of living index in zip code 95436: 115.2 (more than average, U.S. average is 100)
Land area: 23.0 sq. mi. Water area: 0.3 sq. mi.
Population density: 259 people per square mile
(very low).
OSM Map
General Map
Google Map
MSN Map
OSM Map
General Map
Google Map
MSN Map
OSM Map
General Map
Google Map
MSN Map
OSM Map
General Map
Google Map
MSN Map
Please wait while loading the map...
Real estate property taxes paid for housing units in 2022:
This zip code:
0.6% ($4,629)
California:
0.7% ($4,831)
Median real estate property taxes paid for housing units with mortgages in 2022: $4,788 (0.7%) Median real estate property taxes paid for housing units with no mortgage in 2022: $3,945 (0.6%)
Business Search- 14 Million verified businesses
Males: 3,079
(51.7%)
Females: 2,878
(48.3%)
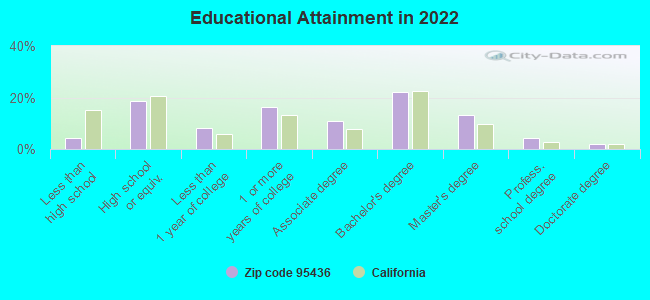
For population 25 years and over in 95436:
High school or higher: 96.0%
Bachelor's degree or higher: 41.8%
Graduate or professional degree: 19.4%
Unemployed: 3.1%
Mean travel time to work (commute): 23.8 minutes
For population 15 years and over in 95436:
Never married: 30.4%
Now married: 50.2%
Separated: 0.7%
Widowed: 6.8%
Divorced: 11.8%
Zip code 95436 compared to state average:
Unemployed percentage below state average.
Black race population percentage below state average.
Hispanic race population percentage significantly below state average.
Foreign-born population percentage significantly below state average.
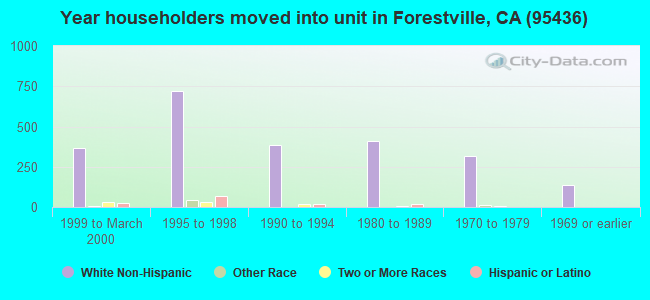
Length of stay since moving in above state average.
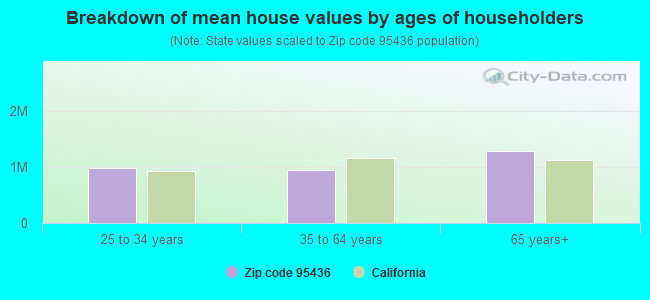
Estimated median house/condo value in 2022: $717,963
95436:
$717,963
California:
$715,900
According to our research of California and other state lists, there were 8 registered sex offenders living in 95436 zip code as of May 28, 2024. The ratio of all residents to sex offenders in zip code 95436 is 756 to 1. The ratio of registered sex offenders to all residents in this zip code is near the state average.
Median resident age:
This zip code:
41.8 years
California median age:
37.9 years
Average household size:
This zip code:
2.4 people
California:
2.8 people
Averages for the 2020 tax year for zip code 95436, filed in 2021:
Average Adjusted Gross Income (AGI) in 2020: $83,547 (Individual Income Tax Returns)
Here:
$83,547
State:
$95,910
Salary/wage: $69,049 (reported on 69.8% of returns)
Here:
$69,049
State:
$77,331
(% of AGI for various income ranges: 1034.3% for AGIs below $25k, 4081.1% for AGIs $25k-50k, 6635.7% for AGIs $50k-75k, 9532.1% for AGIs $75k-100k, 20130.0% for AGIs $100k-200k, 93127.5% for AGIs over 200k)
Taxable interest for individuals: $1,658 (reported on 48.6% of returns)
This zip code:
$1,658
California:
$2,294
(% of AGI for various income ranges: 45.5% for AGIs below $25k, 84.7% for AGIs $25k-50k, 74.3% for AGIs $50k-75k, 136.8% for AGIs $75k-100k, 232.5% for AGIs $100k-200k, 2047.5% for AGIs over 200k)
Ordinary dividends: $8,824 (reported on 27.1% of returns)
Here:
$8,824
State:
$10,949
(% of AGI for various income ranges: 98.6% for AGIs below $25k, 141.3% for AGIs $25k-50k, 133.5% for AGIs $50k-75k, 218.9% for AGIs $75k-100k, 855.4% for AGIs $100k-200k, 7890.0% for AGIs over 200k)
Net capital gain/loss in AGI: +$28,550 (reported on 25.0% of returns)
Here:
+$28,550
State:
+$49,306
(% of AGI for various income ranges: 65.2% for AGIs below $25k, 82.4% for AGIs $25k-50k, 130.9% for AGIs $50k-75k, 313.7% for AGIs $75k-100k, 1151.7% for AGIs $100k-200k, 40770.0% for AGIs over 200k)
Profit/loss from business: +$19,653 (reported on 22.9% of returns)
Here:
+$19,653
State:
+$15,671
(% of AGI for various income ranges: 304.8% for AGIs below $25k, 516.8% for AGIs $25k-50k, 614.8% for AGIs $50k-75k, 926.8% for AGIs $75k-100k, 1260.8% for AGIs $100k-200k, 8815.0% for AGIs over 200k)
Taxable individual retirement arrangement distribution: $18,106 (reported on 11.8% of returns)
95436:
$18,106
California:
$23,505
(% of AGI for various income ranges: 101.2% for AGIs below $25k, 182.1% for AGIs $25k-50k, 242.6% for AGIs $50k-75k, 593.7% for AGIs $75k-100k, 1098.8% for AGIs $100k-200k, 1790.0% for AGIs over 200k)
Self-employed (Keogh) retirement plans: $24,275 (reported on 1.4% of returns)
95436:
$24,275
California:
$30,163
(% of AGI for various income ranges: 404.6% for AGIs $100k-200k)
Total itemized deductions: $31,946 (reported on 18.1% of returns)
Here:
$31,946
State:
$39,517
(% of AGI for various income ranges: 215.5% for AGIs below $25k, 315.0% for AGIs $25k-50k, 750.0% for AGIs $50k-75k, 1105.3% for AGIs $75k-100k, 2310.4% for AGIs $100k-200k, 12850.0% for AGIs over 200k)
Charity contributions: $4,772 (reported on 13.5% of returns)
Here:
$4,772
State:
$12,598
(% of AGI for various income ranges: 4.0% for AGIs below $25k, 14.7% for AGIs $25k-50k, 25.2% for AGIs $50k-75k, 84.2% for AGIs $75k-100k, 284.2% for AGIs $100k-200k, 2220.0% for AGIs over 200k)
Taxes paid: $8,390 (reported on 18.1% of returns)
95436:
$8,390
State:
$8,807
(% of AGI for various income ranges: 52.1% for AGIs below $25k, 80.5% for AGIs $25k-50k, 209.1% for AGIs $50k-75k, 358.4% for AGIs $75k-100k, 722.9% for AGIs $100k-200k, 2352.5% for AGIs over 200k)
Earned income credit: $1,188 (reported on 8.3% of returns)
Here:
$1,188
State:
$2,074
(% of AGI for various income ranges: 44.5% for AGIs below $25k, 25.8% for AGIs $25k-50k)
Percentage of individuals using paid preparers for their 2020 taxes: 91.7%
Here:
92%
State:
92%
(% for various income ranges: 89.5% for AGIs below $25k, 89.6% for AGIs $25k-50k, 92.3% for AGIs $50k-75k, 94.1% for AGIs $75k-100k, 94.4% for AGIs $100k-200k, 94.4% for AGIs over 200k)
Averages for the 2012 tax year for zip code 95436, filed in 2013:
Average Adjusted Gross Income (AGI) in 2012: $59,856 (Individual Income Tax Returns)
Here:
$59,856
State:
$72,726
Salary/wage: $49,288 (reported on 73.6% of returns)
Here:
$49,288
State:
$59,079
(% of AGI for various income ranges: 59.6% for AGIs below $25k, 69.8% for AGIs $25k-50k, 66.5% for AGIs $50k-75k, 61.8% for AGIs $75k-100k, 69.1% for AGIs $100k-200k, 38.8% for AGIs over 200k)
Taxable interest for individuals: $1,410 (reported on 44.0% of returns)
This zip code:
$1,410
California:
$2,146
(% of AGI for various income ranges: 2.2% for AGIs below $25k, 1.4% for AGIs $25k-50k, 1.3% for AGIs $50k-75k, 1.0% for AGIs $75k-100k, 0.8% for AGIs $100k-200k, 0.6% for AGIs over 200k)
Ordinary dividends: $4,500 (reported on 26.4% of returns)
Here:
$4,500
State:
$9,308
(% of AGI for various income ranges: 3.4% for AGIs below $25k, 1.9% for AGIs $25k-50k, 1.9% for AGIs $50k-75k, 1.7% for AGIs $75k-100k, 1.6% for AGIs $100k-200k, 2.3% for AGIs over 200k)
Net capital gain/loss in AGI: +$9,102 (reported on 22.3% of returns)
Here:
+$9,102
State:
+$30,460
(% of AGI for various income ranges: 0.3% for AGIs $25k-50k, 0.8% for AGIs $50k-75k, 1.1% for AGIs $75k-100k, 2.8% for AGIs $100k-200k, 11.1% for AGIs over 200k)
Profit/loss from business: +$20,136 (reported on 26.4% of returns)
Here:
+$20,136
State:
+$17,064
(% of AGI for various income ranges: 20.4% for AGIs below $25k, 10.1% for AGIs $25k-50k, 9.0% for AGIs $50k-75k, 11.0% for AGIs $75k-100k, 6.0% for AGIs $100k-200k, 6.3% for AGIs over 200k)
Taxable individual retirement arrangement distribution: $14,013 (reported on 11.4% of returns)
95436:
$14,013
California:
$19,557
(% of AGI for various income ranges: 3.7% for AGIs below $25k, 2.6% for AGIs $25k-50k, 2.8% for AGIs $50k-75k, 4.6% for AGIs $75k-100k, 2.2% for AGIs $100k-200k, 1.5% for AGIs over 200k)
Self-employment retirement plans: $19,433 (reported on 1.1% of returns)
95436:
$19,433
California:
$24,530
Total itemized deductions: $25,886 (26% of AGI, reported on 41.0% of returns)
Here:
$25,886
State:
$34,004
Here:
25.5% of AGI
State:
22.7% of AGI
(% of AGI for various income ranges: 24.3% for AGIs below $25k, 13.6% for AGIs $25k-50k, 16.7% for AGIs $50k-75k, 19.0% for AGIs $75k-100k, 20.7% for AGIs $100k-200k, 14.2% for AGIs over 200k)
Charity contributions: $2,058 (reported on 33.3% of returns)
Here:
$2,058
State:
$4,659
(% of AGI for various income ranges: 0.8% for AGIs below $25k, 0.7% for AGIs $25k-50k, 1.1% for AGIs $50k-75k, 1.3% for AGIs $75k-100k, 1.4% for AGIs $100k-200k, 1.1% for AGIs over 200k)
Taxes paid: $9,678 (reported on 41.0% of returns)
95436:
$9,678
State:
$14,448
(% of AGI for various income ranges: 4.5% for AGIs below $25k, 3.9% for AGIs $25k-50k, 4.7% for AGIs $50k-75k, 6.0% for AGIs $75k-100k, 8.7% for AGIs $100k-200k, 8.3% for AGIs over 200k)
Earned income credit: $1,533 (reported on 13.2% of returns)
Here:
$1,533
State:
$2,286
(% of AGI for various income ranges: 3.2% for AGIs below $25k, 0.7% for AGIs $25k-50k)
Percentage of individuals using paid preparers for their 2012 taxes: 55.7%
Here:
56%
State:
64%
(% for various income ranges: 44.0% for AGIs below $25k, 54.1% for AGIs $25k-50k, 60.5% for AGIs $50k-75k, 65.4% for AGIs $75k-100k, 73.5% for AGIs $100k-200k, 77.8% for AGIs over 200k)
Averages for the 2004 tax year for zip code 95436, filed in 2005:
Average Adjusted Gross Income (AGI) in 2004: $53,759 (Individual Income Tax Returns)
Here:
$53,759
State:
$58,600
Salary/wage: $42,942 (reported on 77.0% of returns)
Here:
$42,942
State:
$49,455
(% of AGI for various income ranges: 585.7% for AGIs below $10k, 66.1% for AGIs $10k-25k, 77.5% for AGIs $25k-50k, 77.0% for AGIs $50k-75k, 73.0% for AGIs $75k-100k, 41.9% for AGIs over 100k)
Taxable interest for individuals: $1,891 (reported on 53.0% of returns)
This zip code:
$1,891
California:
$2,365
(% of AGI for various income ranges: 49.7% for AGIs below $10k, 3.6% for AGIs $10k-25k, 1.7% for AGIs $25k-50k, 2.0% for AGIs $50k-75k, 1.8% for AGIs $75k-100k, 1.4% for AGIs over 100k)
Taxable dividends: $2,550 (reported on 30.2% of returns)
Here:
$2,550
State:
$4,746
(% of AGI for various income ranges: 52.0% for AGIs below $10k, 2.5% for AGIs $10k-25k, 1.2% for AGIs $25k-50k, 1.6% for AGIs $50k-75k, 1.5% for AGIs $75k-100k, 1.0% for AGIs over 100k)
Net capital gain/loss: +$31,697 (reported on 26.2% of returns)
Here:
+$31,697
State:
+$23,418
(% of AGI for various income ranges: -25.3% for AGIs below $10k, -0.2% for AGIs $10k-25k, 0.5% for AGIs $25k-50k, 1.7% for AGIs $50k-75k, 4.2% for AGIs $75k-100k, 33.2% for AGIs over 100k)
Profit/loss from business: +$15,150 (reported on 25.9% of returns)
Here:
+$15,150
State:
+$16,826
(% of AGI for various income ranges: 82.3% for AGIs below $10k, 13.8% for AGIs $10k-25k, 9.3% for AGIs $25k-50k, 6.5% for AGIs $50k-75k, 8.6% for AGIs $75k-100k, 5.0% for AGIs over 100k)
IRA payment deduction: $3,053 (reported on 4.2% of returns)
95436:
$3,053
California:
$3,192
(% of AGI for various income ranges: 0.5% for AGIs $10k-25k, 0.4% for AGIs $25k-50k, 0.4% for AGIs $50k-75k, 0.2% for AGIs $75k-100k, 0.1% for AGIs over 100k)
Self-employed pension: $10,853 (reported on 2.5% of returns)
Here:
$10,853
California:
$17,688
(% of AGI for various income ranges: 0.3% for AGIs $25k-50k, 0.2% for AGIs $50k-75k, 0.6% for AGIs $75k-100k, 0.7% for AGIs over 100k)
Total itemized deductions: $22,327 (24% of AGI, reported on 43.7% of returns)
Here:
$22,327
State:
$28,113
Here:
24.3% of AGI
State:
25.3% of AGI
(% of AGI for various income ranges: 260.3% for AGIs below $10k, 19.5% for AGIs $10k-25k, 17.2% for AGIs $25k-50k, 21.9% for AGIs $50k-75k, 23.6% for AGIs $75k-100k, 14.0% for AGIs over 100k)
Charity contributions deductions: $2,097 (2% of AGI, reported on 36.7% of returns)
Here:
$2,097
State:
$3,923
Here:
2.3% of AGI
State:
3.3% of AGI
(% of AGI for various income ranges: 8.7% for AGIs below $10k, 1.2% for AGIs $10k-25k, 1.1% for AGIs $25k-50k, 1.4% for AGIs $50k-75k, 2.0% for AGIs $75k-100k, 1.4% for AGIs over 100k)
Total tax: $8,315 (reported on 81.2% of returns)
95436:
$8,315
State:
$10,761
(% of AGI for various income ranges: 49.7% for AGIs below $10k, 5.7% for AGIs $10k-25k, 8.4% for AGIs $25k-50k, 9.7% for AGIs $50k-75k, 10.4% for AGIs $75k-100k, 17.0% for AGIs over 100k)
Earned income credit: $1,202 (reported on 10.9% of returns)
Here:
$1,202
State:
$1,763
Percentage of individuals using paid preparers for their 2004 taxes: 57.5%
Here:
58%
State:
66%
(% for various income ranges: 47.6% for AGIs below $10k, 54.3% for AGIs $10k-25k, 53.6% for AGIs $25k-50k, 60.7% for AGIs $50k-75k, 69.0% for AGIs $75k-100k, 77.8% for AGIs over 100k)
Likely homosexual households (counted as self-reported same-sex unmarried-partner households)
Lesbian couples: 1.3% of all households
Gay men: 3.2% of all households
Household received Food Stamps/SNAP in the past 12 months: 178 Household did not receive Food Stamps/SNAP in the past 12 months: 2,267
Women who had a birth in the past 12 months: 26 (26 now married, 0 unmarried) Women who did not have a birth in the past 12 months: 1,267 (585 now married, 678 unmarried)
Housing units in zip code 95436 with a mortgage: 1,222 (270 second mortgage, 195 both second mortgage and home equity loan) Median monthly owner costs for units with a mortgage: $2,740 Median monthly owner costs for units without a mortgage: $751
Residents with income below the poverty level in 2022:
This zip code:
6.6%
Whole state:
12.2%
Residents with income below 50% of the poverty level in 2022:
This zip code:
3.7%
Whole state:
6.2%
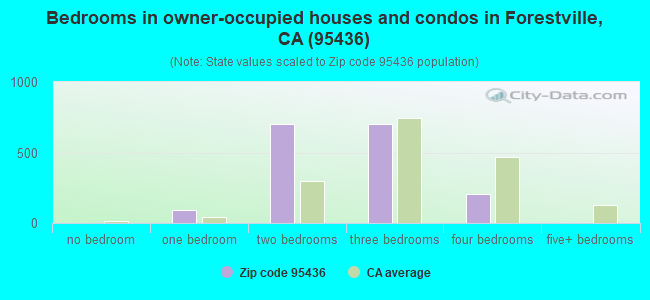
Median number of rooms in houses and condos:
Here:
5.3
State:
6.0
Median number of rooms in apartments:
Here:
4.6
State:
3.9
Notable locations in this zip code not listed on our city pages
Notable locations in zip code 95436: Topolos Vineyards (A), Mark West Vineyards (B), Forestville Branch Sonoma County Library (C), Forestville Fire Protection District (D), Department of Forestry and Fire Protection Hilton Station (E). Display/hide their locations on the map
Churches in zip code 95436 include: Forestville Christian Fellowship Baptist Church (A), Forestville United Methodist Church (B). Display/hide their locations on the map
989 married couples with children.
94 single-parent households (21 men, 73 women).
90.6% of residents of 95436 zip code speak English at home.
5.5% of residents speak Spanish at home (58% very well, 33% well, 4% not well, 5% not at all).
2.1% of residents speak other Indo-European language at home (81% very well, 19% well).
0.9% of residents speak Asian or Pacific Island language at home (29% very well, 29% well, 24% not well, 18% not at all).
0.5% of residents speak other language at home (100% very well).
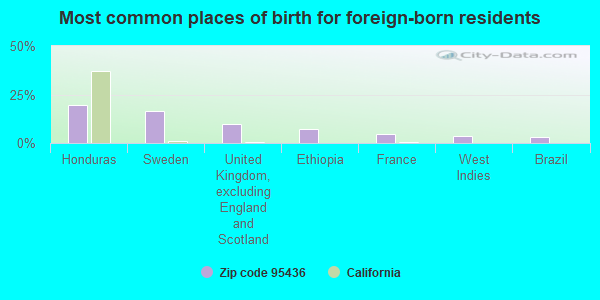
Foreign born population: 447 (7.5%) (76.1% of them are naturalized citizens)
This zip code:
7.5%
Whole state:
26.7%
19%Honduras
17%Sweden
10%United Kingdom, excluding England and Scotland
7%Ethiopia
5%France
4%West Indies
3%Brazil
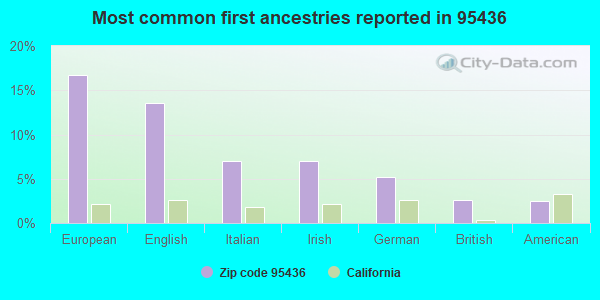
17%European
14%English
7%Italian
7%Irish
5%German
3%British
2%American
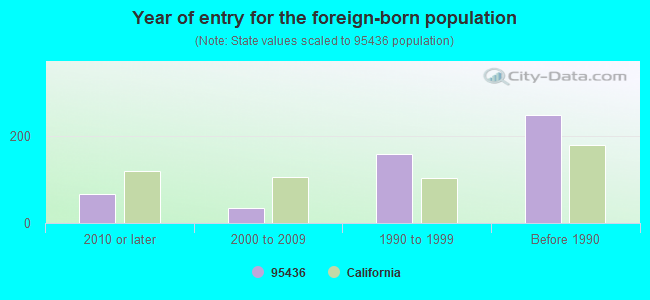
Year of entry for the foreign-born population
662010 or later
342000 to 2009
1591990 to 1999
249Before 1990
Facilities with environmental interests located in this zip code:
EL MOLINO PHARMACY (6652 FRONT ST in FORESTVILLE, CA)
STATE MASTER (California - Hazardous Waste Tracking) - HAZARDOU WASTE PROGRAM Small Quantity Generators, between 100 kg and 1000 kg of hazardous waste/month (Resource Conservation and Recovery Act (tracking hazardous waste)) - notification
EL MOLINO HIGH (7050 COVEY ROAD in FORESTVILLE, CA)
(National Center for Education Statistics) - STATE ID-4931507 Organizations: WEST SONOMA COUNTY UNION HIGH (SCHOOL DISTRICT)
FORESTVILLE ELEMENTARY (6321 HWY. 116 in FORESTVILLE, CA)
(National Center for Education Statistics) - STATE ID-6051718 Organizations: FORESTVILLE UNION ELEMENTARY (SCHOOL DISTRICT)
NUEVO LEON HIGH (CONT.) (7050 COVEY ROAD in FORESTVILLE, CA)
(National Center for Education Statistics) - STATE ID-4930186 Organizations: WEST SONOMA COUNTY UNION HIGH (SCHOOL DISTRICT)
FORESTVILLE CSD (PACKING HOUSE RD in FORESTVILLE, CA)
National Pollutant Discharge Elimination System NON-MAJOR (Tracking pollutant discharge elimination systems) - permit Business SIC classification: SEWERAGE SYSTEMS Organizations: FORESTVILLE WATER DISTRICT (CONTACT/OWNER)
Alternative names: SONOMA COUNTY WATER AGENCY
ANALY UNHSD EL MOLINO HS (7050 COVEY RD in FORESTVILLE, CA)
Small Quantity Generators, between 100 kg and 1000 kg of hazardous waste/month (Resource Conservation and Recovery Act (tracking hazardous waste)) - notification Organizations: ANALY UNION H S DIST (CONTACT/OWNER)
ANGELO GIUSTI DISPOSAL SITE (7750 GUISTI ROAD in FORESTVILLE, CA)
CRITERIA AND HAZARDOUS AIR POLLUTANT INVENTORY (Inventory of air pollution sources) Business SIC classification: REFUSE SYSTEMS Business NAICS classification: SOLID WASTE LANDFILL.; SOLID WASTE LANDFILL. Alternative names: GUISTI RANCH DISPOSAL SITE
FORESTVILLE POTW (SONOMA COUNTY in FORESTVILLE, CA)
CRITERIA AND HAZARDOUS AIR POLLUTANT INVENTORY (Inventory of air pollution sources) Business SIC classification: SEWERAGE SYSTEMS
CANYON ROCK CO INC (7525 HWY 116 in FORESTVILLE, CA)
CRITERIA AND HAZARDOUS AIR POLLUTANT INVENTORY (Inventory of air pollution sources) Business SIC classification: CONSTRUCTION SAND AND GRAVEL
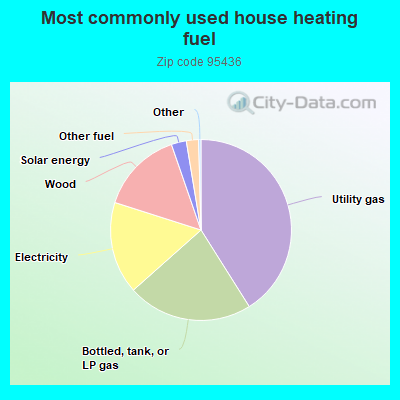
Housing units lacking complete plumbing facilities: 2.5% Housing units lacking complete kitchen facilities: 0.7%
41.1%Utility gas
22.4%Bottled, tank, or LP gas
16.5%Electricity
14.8%Wood
2.7%Solar energy
2.2%Other fuel
Population in 1990: 7,252.
Place of birth for U.S.-born residents:
This state: 4,021
Northeast: 332
Midwest: 447
South: 391
West: 219
59% of the 95436 zip code residents lived in the same house 5 years ago. Out of people who lived in different houses, 68% lived in this county. Out of people who lived in different counties, 50% lived in California.
88% of the 95436 zip code residents lived in the same house 1 year ago. Out of people who lived in different houses, 66% moved from this county. Out of people who lived in different houses, 23% moved from different county within same state. Out of people who lived in different houses, 5% moved from different state. Out of people who lived in different houses, 4% moved from abroad.
Private vs. public school enrollment:
Students in private schools in grades 1 to 8 (elementary and middle school):
Here:
0.0%
California:
10.5%
Students in private schools in grades 9 to 12 (high school): 40
Here:
12.7%
California:
8.5%
Students in private undergraduate colleges:
Here:
0.0%
California:
15.9%
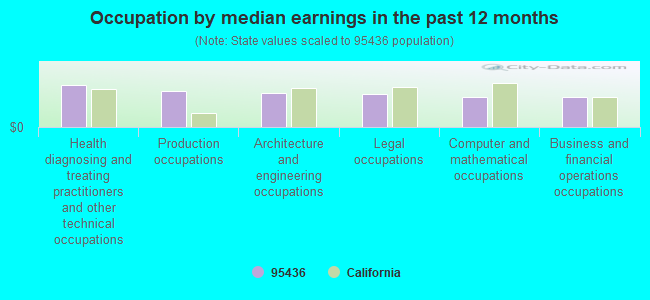
Occupation by median earnings in the past 12 months ($)
123,727Health diagnosing and treating practitioners and other technical occupations
107,144Production occupations
102,014Architecture and engineering occupations
96,948Legal occupations
90,291Computer and mathematical occupations
89,700Business and financial operations occupations
Top industries in this zip code by the number of employees in 2005:
2005 - 2018 National Fire Incident Reporting System (NFIRS) incidents
Based on the data from the years 2005 - 2018 the average number of fire incidents per year is 68. The highest number of reported fires - 107 took place in 2013, and the least - 4 in 2009. The data has a dropping trend.
When looking into fire subcategories, the most reports belonged to: Outside Fires (38.9%), and Structure Fires (38.5%).
Fire incident types reported to NFIRS in Zip Code 95436

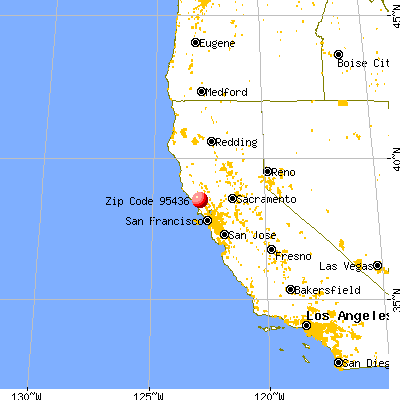


 Nearest zip codes: 95444, 95471, 95492, 95472, 95446, 95462.


 Based on the data from the years 2005 - 2018 the average number of fire incidents per year is 68. The highest number of reported fires - 107 took place in 2013, and the least - 4 in 2009. The data has a dropping trend.
 When looking into fire subcategories, the most reports belonged to: Outside Fires (38.9%), and Structure Fires (38.5%).