Estimated zip code population in 2022: 4,669 Zip code population in 2010: 4,750 Zip code population in 2000: 4,893
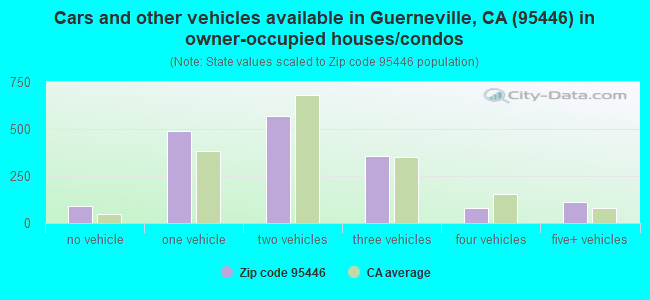
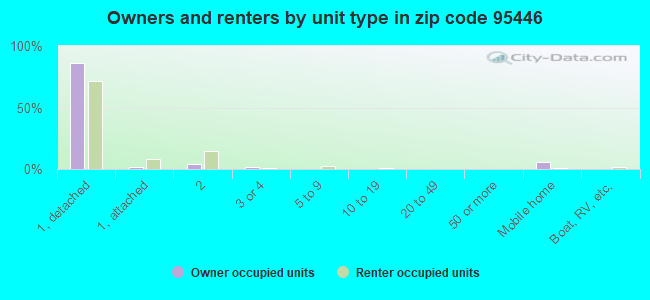
Houses and condos: 3,290 Renter-occupied apartments: 759
% of renters here:
31%
State:
44%
March 2022 cost of living index in zip code 95446: 113.9 (more than average, U.S. average is 100)
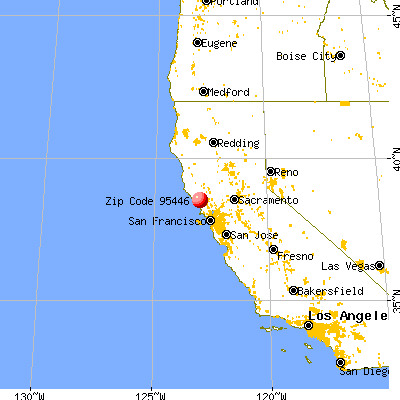
Land area: 32.9 sq. mi. Water area: 0.2 sq. mi.
Population density: 142 people per square mile
(very low).
OSM Map
General Map
Google Map
MSN Map
OSM Map
General Map
Google Map
MSN Map
OSM Map
General Map
Google Map
MSN Map
OSM Map
General Map
Google Map
MSN Map
Please wait while loading the map...
Real estate property taxes paid for housing units in 2022:
This zip code:
0.9% ($5,659)
California:
0.7% ($4,831)
Median real estate property taxes paid for housing units with mortgages in 2022: $6,043 (0.9%) Median real estate property taxes paid for housing units with no mortgage in 2022: $5,176 (0.9%)
Business Search- 14 Million verified businesses
Males: 2,633
(56.4%)
Females: 2,035
(43.6%)
For population 25 years and over in 95446:
High school or higher: 95.2%
Bachelor's degree or higher: 40.0%
Graduate or professional degree: 15.1%
Unemployed: 7.6%
Mean travel time to work (commute): 31.2 minutes
For population 15 years and over in 95446:
Never married: 33.7%
Now married: 45.1%
Separated: 1.7%
Widowed: 4.2%
Divorced: 15.3%
Zip code 95446 compared to state average:
Black race population percentage significantly below state average.
Hispanic race population percentage below state average.
Median age significantly above state average.
Foreign-born population percentage significantly below state average.
Length of stay since moving in significantly above state average.
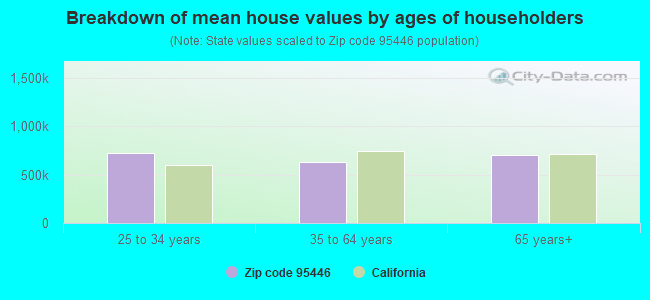
Estimated median house/condo value in 2022: $634,570
95446:
$634,570
California:
$715,900
According to our research of California and other state lists, there were 8 registered sex offenders living in 95446 zip code as of May 28, 2024. The ratio of all residents to sex offenders in zip code 95446 is 574 to 1. The ratio of registered sex offenders to all residents in this zip code is near the state average.
Median resident age:
This zip code:
55.2 years
California median age:
37.9 years
Average household size:
This zip code:
1.9 people
California:
2.8 people
Averages for the 2020 tax year for zip code 95446, filed in 2021:
Average Adjusted Gross Income (AGI) in 2020: $70,117 (Individual Income Tax Returns)
Here:
$70,117
State:
$95,910
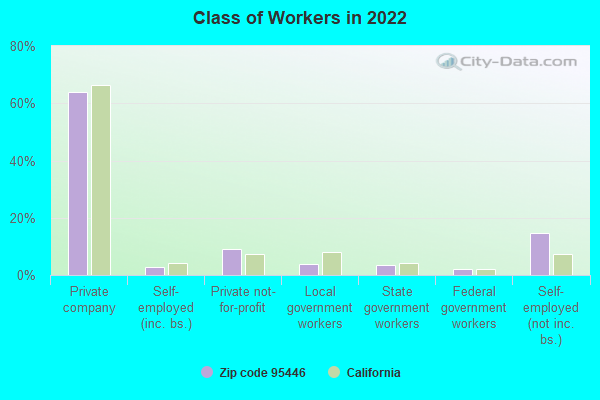
Salary/wage: $61,836 (reported on 70.0% of returns)
Here:
$61,836
State:
$77,331
(% of AGI for various income ranges: 1170.2% for AGIs below $25k, 4060.9% for AGIs $25k-50k, 6990.5% for AGIs $50k-75k, 9503.6% for AGIs $75k-100k, 19547.3% for AGIs $100k-200k, 61884.0% for AGIs over 200k)
Taxable interest for individuals: $1,248 (reported on 40.8% of returns)
This zip code:
$1,248
California:
$2,294
(% of AGI for various income ranges: 28.2% for AGIs below $25k, 70.3% for AGIs $25k-50k, 77.1% for AGIs $50k-75k, 142.7% for AGIs $75k-100k, 223.3% for AGIs $100k-200k, 434.0% for AGIs over 200k)
Ordinary dividends: $4,914 (reported on 21.2% of returns)
Here:
$4,914
State:
$10,949
(% of AGI for various income ranges: 52.8% for AGIs below $25k, 87.4% for AGIs $25k-50k, 120.0% for AGIs $50k-75k, 414.5% for AGIs $75k-100k, 484.0% for AGIs $100k-200k, 1128.0% for AGIs over 200k)
Net capital gain/loss in AGI: +$22,420 (reported on 20.8% of returns)
Here:
+$22,420
State:
+$49,306
(% of AGI for various income ranges: 12.2% for AGIs below $25k, 98.5% for AGIs $25k-50k, 147.1% for AGIs $50k-75k, 283.6% for AGIs $75k-100k, 1233.3% for AGIs $100k-200k, 16710.0% for AGIs over 200k)
Profit/loss from business: +$13,828 (reported on 22.1% of returns)
Here:
+$13,828
State:
+$15,671
(% of AGI for various income ranges: 297.5% for AGIs below $25k, 517.9% for AGIs $25k-50k, 507.1% for AGIs $50k-75k, 368.2% for AGIs $75k-100k, 1826.7% for AGIs $100k-200k, 336.0% for AGIs over 200k)
Taxable individual retirement arrangement distribution: $23,818 (reported on 9.2% of returns)
95446:
$23,818
California:
$23,505
(% of AGI for various income ranges: 54.0% for AGIs below $25k, 179.7% for AGIs $25k-50k, 265.2% for AGIs $50k-75k, 754.5% for AGIs $75k-100k, 2017.3% for AGIs $100k-200k)
Self-employed (Keogh) retirement plans: $23,650 (reported on 0.8% of returns)
95446:
$23,650
California:
$30,163
(% of AGI for various income ranges: 139.1% for AGIs $25k-50k)
Total itemized deductions: $25,968 (reported on 15.4% of returns)
Here:
$25,968
State:
$39,517
(% of AGI for various income ranges: 168.8% for AGIs below $25k, 410.0% for AGIs $25k-50k, 681.0% for AGIs $50k-75k, 1064.5% for AGIs $75k-100k, 1784.0% for AGIs $100k-200k, 4524.0% for AGIs over 200k)
Charity contributions: $3,024 (reported on 10.4% of returns)
Here:
$3,024
State:
$12,598
(% of AGI for various income ranges: 27.6% for AGIs $25k-50k, 30.0% for AGIs $50k-75k, 40.0% for AGIs $75k-100k, 172.0% for AGIs $100k-200k, 594.0% for AGIs over 200k)
Taxes paid: $8,244 (reported on 15.0% of returns)
95446:
$8,244
State:
$8,807
(% of AGI for various income ranges: 46.5% for AGIs below $25k, 106.8% for AGIs $25k-50k, 225.7% for AGIs $50k-75k, 347.3% for AGIs $75k-100k, 615.3% for AGIs $100k-200k, 1280.0% for AGIs over 200k)
Earned income credit: $1,444 (reported on 11.2% of returns)
Here:
$1,444
State:
$2,074
(% of AGI for various income ranges: 63.0% for AGIs below $25k, 40.6% for AGIs $25k-50k)
Percentage of individuals using paid preparers for their 2020 taxes: 92.1%
Here:
92%
State:
92%
(% for various income ranges: 89.5% for AGIs below $25k, 91.7% for AGIs $25k-50k, 91.9% for AGIs $50k-75k, 95.0% for AGIs $75k-100k, 94.1% for AGIs $100k-200k, 100.0% for AGIs over 200k)
Averages for the 2012 tax year for zip code 95446, filed in 2013:
Average Adjusted Gross Income (AGI) in 2012: $45,565 (Individual Income Tax Returns)
Here:
$45,565
State:
$72,726
Salary/wage: $41,298 (reported on 71.5% of returns)
Here:
$41,298
State:
$59,079
(% of AGI for various income ranges: 59.4% for AGIs below $25k, 68.1% for AGIs $25k-50k, 68.2% for AGIs $50k-75k, 67.0% for AGIs $75k-100k, 78.8% for AGIs $100k-200k)
Taxable interest for individuals: $1,562 (reported on 40.4% of returns)
This zip code:
$1,562
California:
$2,146
(% of AGI for various income ranges: 2.1% for AGIs below $25k, 1.2% for AGIs $25k-50k, 1.4% for AGIs $50k-75k, 0.6% for AGIs $75k-100k, 1.2% for AGIs $100k-200k, 3.0% for AGIs over 200k)
Ordinary dividends: $5,367 (reported on 19.7% of returns)
Here:
$5,367
State:
$9,308
(% of AGI for various income ranges: 2.9% for AGIs below $25k, 1.8% for AGIs $25k-50k, 2.1% for AGIs $50k-75k, 0.9% for AGIs $75k-100k, 4.2% for AGIs $100k-200k)
Net capital gain/loss in AGI: +$4,455 (reported on 19.3% of returns)
Here:
+$4,455
State:
+$30,460
(% of AGI for various income ranges: 0.2% for AGIs $25k-50k, 0.7% for AGIs $50k-75k, 1.5% for AGIs $75k-100k, 6.0% for AGIs $100k-200k)
Profit/loss from business: +$15,245 (reported on 21.5% of returns)
Here:
+$15,245
State:
+$17,064
(% of AGI for various income ranges: 15.6% for AGIs below $25k, 6.2% for AGIs $25k-50k, 5.9% for AGIs $50k-75k, 6.4% for AGIs $75k-100k, 7.9% for AGIs $100k-200k)
Taxable individual retirement arrangement distribution: $13,584 (reported on 11.0% of returns)
95446:
$13,584
California:
$19,557
(% of AGI for various income ranges: 3.6% for AGIs below $25k, 3.5% for AGIs $25k-50k, 2.6% for AGIs $50k-75k, 3.1% for AGIs $75k-100k, 4.5% for AGIs $100k-200k)
Total itemized deductions: $21,293 (29% of AGI, reported on 37.7% of returns)
Here:
$21,293
State:
$34,004
Here:
29.0% of AGI
State:
22.7% of AGI
(% of AGI for various income ranges: 16.2% for AGIs below $25k, 15.6% for AGIs $25k-50k, 17.5% for AGIs $50k-75k, 18.9% for AGIs $75k-100k, 18.6% for AGIs $100k-200k, 19.9% for AGIs over 200k)
Charity contributions: $1,444 (reported on 27.2% of returns)
Here:
$1,444
State:
$4,659
(% of AGI for various income ranges: 0.5% for AGIs below $25k, 0.6% for AGIs $25k-50k, 0.8% for AGIs $50k-75k, 0.8% for AGIs $75k-100k, 1.2% for AGIs $100k-200k, 1.1% for AGIs over 200k)
Taxes paid: $7,643 (reported on 37.7% of returns)
95446:
$7,643
State:
$14,448
(% of AGI for various income ranges: 3.5% for AGIs below $25k, 3.9% for AGIs $25k-50k, 6.0% for AGIs $50k-75k, 7.2% for AGIs $75k-100k, 8.1% for AGIs $100k-200k, 10.2% for AGIs over 200k)
Earned income credit: $1,553 (reported on 15.8% of returns)
Here:
$1,553
State:
$2,286
(% of AGI for various income ranges: 3.9% for AGIs below $25k, 0.5% for AGIs $25k-50k)
Percentage of individuals using paid preparers for their 2012 taxes: 53.1%
Here:
53%
State:
64%
(% for various income ranges: 44.1% for AGIs below $25k, 54.2% for AGIs $25k-50k, 62.9% for AGIs $50k-75k, 61.1% for AGIs $75k-100k, 65.0% for AGIs $100k-200k, 66.7% for AGIs over 200k)
Averages for the 2004 tax year for zip code 95446, filed in 2005:
Average Adjusted Gross Income (AGI) in 2004: $42,994 (Individual Income Tax Returns)
Here:
$42,994
State:
$58,600
Salary/wage: $37,607 (reported on 76.7% of returns)
Here:
$37,607
State:
$49,455
(% of AGI for various income ranges: 117.4% for AGIs below $10k, 68.3% for AGIs $10k-25k, 82.6% for AGIs $25k-50k, 79.2% for AGIs $50k-75k, 77.9% for AGIs $75k-100k, 41.7% for AGIs over 100k)
Taxable interest for individuals: $1,674 (reported on 46.0% of returns)
This zip code:
$1,674
California:
$2,365
(% of AGI for various income ranges: 11.6% for AGIs below $10k, 2.8% for AGIs $10k-25k, 1.3% for AGIs $25k-50k, 1.0% for AGIs $50k-75k, 1.6% for AGIs $75k-100k, 2.0% for AGIs over 100k)
Taxable dividends: $2,841 (reported on 23.1% of returns)
Here:
$2,841
State:
$4,746
(% of AGI for various income ranges: 6.8% for AGIs below $10k, 2.5% for AGIs $10k-25k, 1.1% for AGIs $25k-50k, 1.2% for AGIs $50k-75k, 1.0% for AGIs $75k-100k, 1.7% for AGIs over 100k)
Net capital gain/loss: +$13,631 (reported on 20.5% of returns)
Here:
+$13,631
State:
+$23,418
(% of AGI for various income ranges: -9.2% for AGIs below $10k, 0.3% for AGIs $10k-25k, 1.3% for AGIs $25k-50k, 1.1% for AGIs $50k-75k, 3.8% for AGIs $75k-100k, 17.1% for AGIs over 100k)
Profit/loss from business: +$14,421 (reported on 20.7% of returns)
Here:
+$14,421
State:
+$16,826
(% of AGI for various income ranges: 14.5% for AGIs below $10k, 11.3% for AGIs $10k-25k, 6.2% for AGIs $25k-50k, 5.9% for AGIs $50k-75k, 6.3% for AGIs $75k-100k, 6.7% for AGIs over 100k)
IRA payment deduction: $2,969 (reported on 3.9% of returns)
95446:
$2,969
California:
$3,192
(% of AGI for various income ranges: 1.3% for AGIs below $10k, 0.4% for AGIs $10k-25k, 0.4% for AGIs $25k-50k, 0.3% for AGIs $50k-75k, 0.5% for AGIs $75k-100k)
Self-employed pension: $10,158 (reported on 1.5% of returns)
Here:
$10,158
California:
$17,688
Total itemized deductions: $18,824 (25% of AGI, reported on 39.2% of returns)
Here:
$18,824
State:
$28,113
Here:
25.4% of AGI
State:
25.3% of AGI
(% of AGI for various income ranges: 54.6% for AGIs below $10k, 18.5% for AGIs $10k-25k, 16.7% for AGIs $25k-50k, 21.1% for AGIs $50k-75k, 20.2% for AGIs $75k-100k, 11.8% for AGIs over 100k)
Charity contributions deductions: $1,577 (2% of AGI, reported on 30.7% of returns)
Here:
$1,577
State:
$3,923
Here:
2.1% of AGI
State:
3.3% of AGI
(% of AGI for various income ranges: 2.3% for AGIs below $10k, 0.8% for AGIs $10k-25k, 0.9% for AGIs $25k-50k, 1.1% for AGIs $50k-75k, 1.6% for AGIs $75k-100k, 1.1% for AGIs over 100k)
Total tax: $6,927 (reported on 78.1% of returns)
95446:
$6,927
State:
$10,761
(% of AGI for various income ranges: 6.9% for AGIs below $10k, 5.4% for AGIs $10k-25k, 8.2% for AGIs $25k-50k, 10.3% for AGIs $50k-75k, 11.6% for AGIs $75k-100k, 19.9% for AGIs over 100k)
Earned income credit: $1,244 (reported on 13.5% of returns)
Here:
$1,244
State:
$1,763
Percentage of individuals using paid preparers for their 2004 taxes: 56.3%
Here:
56%
State:
66%
(% for various income ranges: 53.8% for AGIs below $10k, 49.1% for AGIs $10k-25k, 55.8% for AGIs $25k-50k, 66.5% for AGIs $50k-75k, 62.4% for AGIs $75k-100k, 67.1% for AGIs over 100k)
Likely homosexual households (counted as self-reported same-sex unmarried-partner households)
Lesbian couples: 1.4% of all households
Gay men: 1.4% of all households
Household received Food Stamps/SNAP in the past 12 months: 202 Household did not receive Food Stamps/SNAP in the past 12 months: 2,223
Women who had a birth in the past 12 months: 14 (14 now married, 0 unmarried) Women who did not have a birth in the past 12 months: 699 (258 now married, 441 unmarried)
Housing units in zip code 95446 with a mortgage: 963 (35 second mortgage, 25 both second mortgage and home equity loan) Median monthly owner costs for units with a mortgage: $2,474 Median monthly owner costs for units without a mortgage: $887
Residents with income below the poverty level in 2022:
This zip code:
8.9%
Whole state:
12.2%
Residents with income below 50% of the poverty level in 2022:
This zip code:
5.6%
Whole state:
6.2%
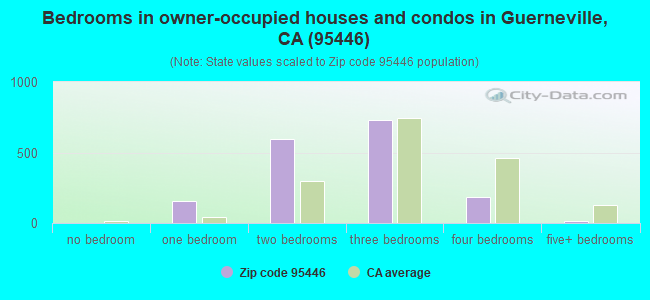
Median number of rooms in houses and condos:
Here:
5.0
State:
6.0
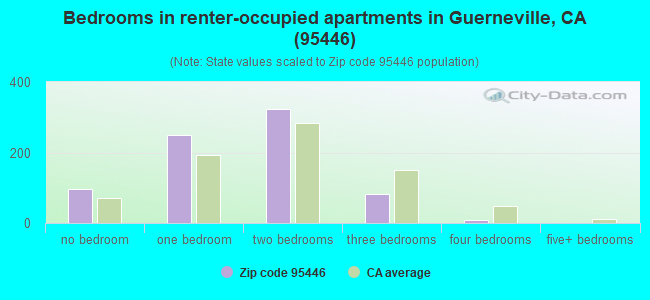
Median number of rooms in apartments:
Here:
3.5
State:
3.9
Notable locations in this zip code not listed on our city pages
Notable locations in zip code 95446: Colonel Armstrong Tree (A), Madrone Ranch (B), Luttrell Ranch (C), Tom King Trail Camp (D), Redwood Forest Theater (E), Parson Jones Tree (F), Korbel Winery (G), Icicle Tree (H), Gilliam Creek Trail Camp (I), Burbank Circle (J), Bullfrog Pond Campground (K), Veterans Memorial Building (L), Guerneville Branch Sonoma County Public Library (M), Russian River Fire Protection District (N). Display/hide their locations on the map
Creeks: Black Rock Creek (A), Fife Creek (B), Gilliam Creek (C), Livereau Creek (D), Sweetwater Creek (E), Thompson Creek (F), Smith Creek (G), Hulbert Creek (H), Schoolhouse Creek (I). Display/hide their locations on the map
In group quarters: 10 (-1 institutionalized population)
Size of family households: 765 2-persons, 164 3-persons, 100 4-persons, 53 5-persons, 17 6-persons, 7 7-or-more-persons
Size of nonfamily households: 973 1-person, 274 2-persons, 125 3-persons
231 married couples with children.
66 single-parent households (7 men, 59 women).
90.5% of residents of 95446 zip code speak English at home.
7.7% of residents speak Spanish at home (61% very well, 16% well, 23% not well).
1.4% of residents speak other Indo-European language at home (100% very well).
0.4% of residents speak other language at home (41% well, 59% not well).
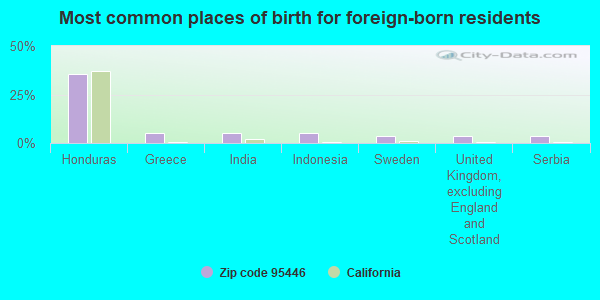
Foreign born population: 317 (6.8%) (70.4% of them are naturalized citizens)
This zip code:
6.8%
Whole state:
26.7%
35%Honduras
5%Greece
5%India
5%Indonesia
3%Sweden
3%United Kingdom, excluding England and Scotland
3%Serbia
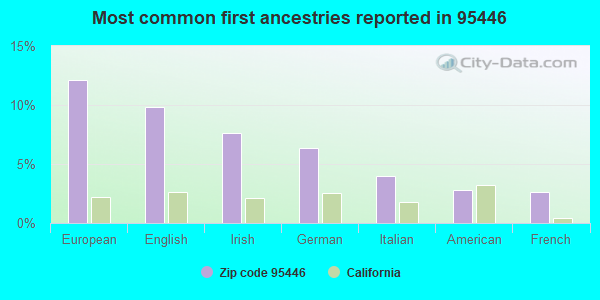
12%European
10%English
8%Irish
6%German
4%Italian
3%American
3%French
Year of entry for the foreign-born population
512010 or later
322000 to 2009
761990 to 1999
191Before 1990
Facilities with environmental interests located in this zip code:
F KORBEL & BROTHERS INCORPORATED (13250 RIVER RD. in GUERNEVILLE, CA)
STATE MASTER (California - Hazardous Waste Tracking) - HAZARDOU WASTE PROGRAM Small Quantity Generators, between 100 kg and 1000 kg of hazardous waste/month (Resource Conservation and Recovery Act (tracking hazardous waste)) - notification TRI REPORTER (Tracking of toxic chemicals releasing facilities) Business SIC classification: WINES, BRANDY, AND BRANDY SPIRITS Organizations: GARY HECK (CONTACT/OWNER)
GUERNEVILLE COMMUNITY DAY (14630 ARMSTRONG WOODS RD. in GUERNEVILLE, CA)
(National Center for Education Statistics) - STATE ID-6119465 Organizations: GUERNEVILLE ELEMENTARY (SCHOOL DISTRICT)
GUERNEVILLE ELEMENTARY (14630 ARMSTRONG WOODS ROAD in GUERNEVILLE, CA)
(National Center for Education Statistics) - STATE ID-6051767
HAYNES TRANSPORTATION (17495 OLD MONTE RIO RD in GUERNEVILLE, CA)
TRANSPORTER (Resource Conservation and Recovery Act (tracking hazardous waste)) - notification Organizations: RUSSELL HAYNES (CONTACT/OWNER)
GUERNEVILLE LANDFILL (POCKET DRIVE - HWY 116 AT NOE in GUERNEVILLE, CA)
CRITERIA AND HAZARDOUS AIR POLLUTANT INVENTORY (Inventory of air pollution sources) Business SIC classification: REFUSE SYSTEMS Business NAICS classification: SOLID WASTE LANDFILL.
KORBEL MAINTENANCE DISPOSAL SITE (1.5 MI EAST OF GUERNEVILLE OFF in GUERNEVILLE, CA)
CRITERIA AND HAZARDOUS AIR POLLUTANT INVENTORY (Inventory of air pollution sources) Business SIC classification: REFUSE SYSTEMS Business NAICS classification: SOLID WASTE LANDFILL.
Housing units lacking complete plumbing facilities: 2.4% Housing units lacking complete kitchen facilities: 2.9%
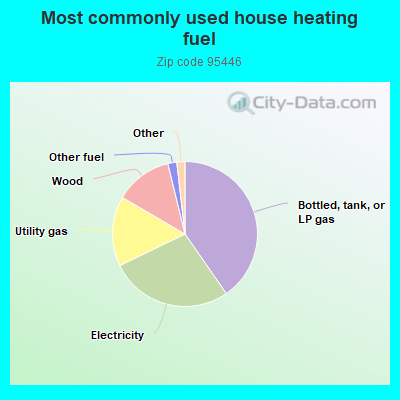
40.4%Bottled, tank, or LP gas
27.5%Electricity
15.6%Utility gas
12.8%Wood
2.0%Other fuel
0.7%No fuel used
0.6%Fuel oil, kerosene, etc.
0.6%Solar energy
Population in 1990: 5,060.
Place of birth for U.S.-born residents:
This state: 2,780
Northeast: 473
Midwest: 408
South: 314
West: 302
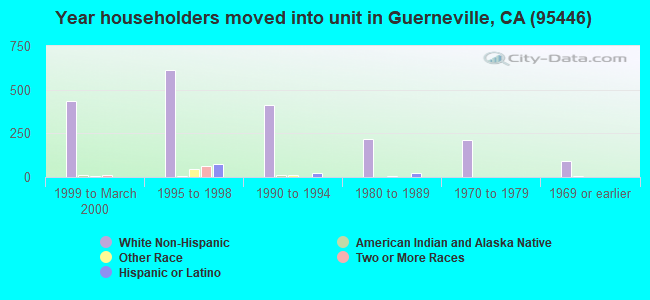
48% of the 95446 zip code residents lived in the same house 5 years ago. Out of people who lived in different houses, 58% lived in this county. Out of people who lived in different counties, 50% lived in California.
87% of the 95446 zip code residents lived in the same house 1 year ago. Out of people who lived in different houses, 65% moved from this county. Out of people who lived in different houses, 15% moved from different county within same state. Out of people who lived in different houses, 12% moved from different state. Out of people who lived in different houses, 5% moved from abroad.
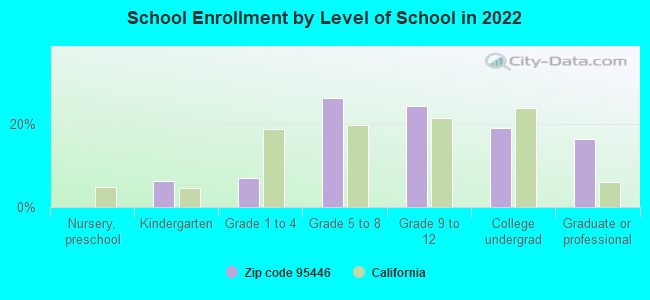
Private vs. public school enrollment:
Students in private schools in grades 1 to 8 (elementary and middle school):
Here:
0.0%
California:
10.5%
Students in private schools in grades 9 to 12 (high school): 14
Here:
10.9%
California:
8.5%
Students in private undergraduate colleges:
Here:
0.0%
California:
15.9%
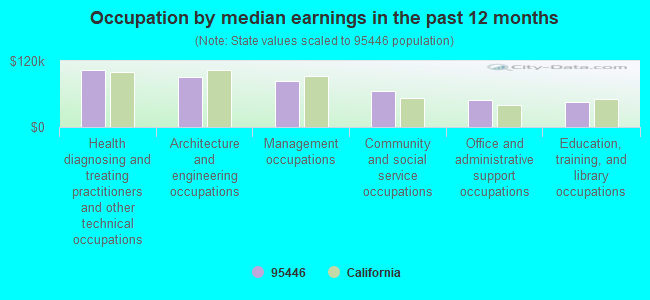
Occupation by median earnings in the past 12 months ($)
104,001Health diagnosing and treating practitioners and other technical occupations
90,569Architecture and engineering occupations
82,910Management occupations
64,793Community and social service occupations
49,239Office and administrative support occupations
46,296Education, training, and library occupations
Top industries in this zip code by the number of employees in 2005:
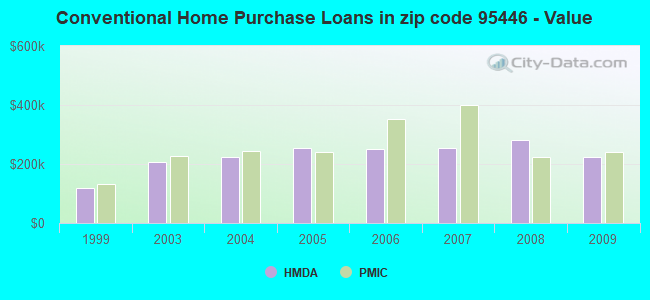
Detailed PMIC statistics for the following Tracts:1537.04
2005 - 2018 National Fire Incident Reporting System (NFIRS) incidents
According to the data from the years 2005 - 2018 the average number of fire incidents per year is 14. The highest number of reported fire incidents - 38 took place in 2007, and the least - 5 in 2010. The data has a dropping trend.
When looking into fire subcategories, the most reports belonged to: Outside Fires (70.6%), and Structure Fires (17.0%).
Fire incident types reported to NFIRS in Zip Code 95446


 Nearest zip codes: 95471, 95486, 95462, 95430, 95436, 95465.
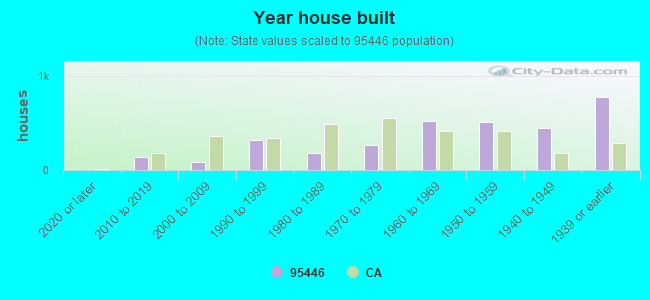


 According to the data from the years 2005 - 2018 the average number of fire incidents per year is 14. The highest number of reported fire incidents - 38 took place in 2007, and the least - 5 in 2010. The data has a dropping trend.
 When looking into fire subcategories, the most reports belonged to: Outside Fires (70.6%), and Structure Fires (17.0%).