Estimated zip code population in 2022: 41,739
Zip code population in 2010: 39,819
Zip code population in 2000: 41,629
Houses and condos: 17,200
Renter-occupied apartments: 5,288
% of renters here:
32%State:
44%
March 2022 cost of living index in zip code 95621: 101.1
(near average, U.S. average is 100)
Land area: 6.8
sq. mi.
Water area: 0.0
sq. mi.
Population density: 6,146 people per square mile (high).
OSM Map
General Map
Google Map
MSN Map
OSM Map
General Map
Google Map
MSN Map
OSM Map
General Map
Google Map
MSN Map
OSM Map
General Map
Google Map
MSN Map
Please wait while loading the map...
Real estate property taxes paid for housing units in 2022:
This zip code:
0.6% ($2,470)California:
0.7% ($4,831)
Median real estate property taxes paid for housing units with mortgages in 2022: $2,862 (0.7%)
Median real estate property taxes paid for housing units with no mortgage in 2022: $1,626 (0.5%)
Profiles of local businesses
Business Search - 14 Million verified businesses
Males: 20,343 Females: 21,396
For population 25 years and over in 95621:
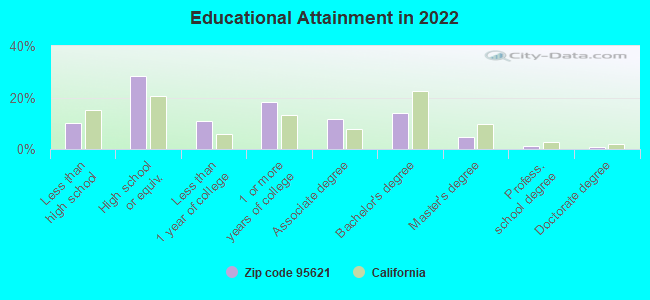
High school or higher: 89.5%Bachelor's degree or higher: 20.6%Graduate or professional degree: 6.6%Unemployed: 5.3%Mean travel time to work (commute): 26.3 minutes
For population 15 years and over in 95621:
Never married: 34.6%Now married: 43.1%Separated: 2.3%Widowed: 6.4%Divorced: 13.6%
Zip code 95621 compared to state average:
Median house value below state average. Black race population percentage below state average. Hispanic race population percentage below state average. Foreign-born population percentage below state average. Length of stay since moving in above state average. Percentage of population with a bachelor's degree or higher below state average. 27,369 65.6% White 8,416 20.2% Hispanic or Latino 2,451 5.9% Asian 2,124 5.1% Two or more races 828 2.0% Black 249 0.6% Some other race 147 0.4% American Indian 151 0.4% Native Hawaiian and Other
Data:
Median household income ($)
Median household income (% change since 2000)
Household income diversity
Ratio of average income to average house value (%)
Ratio of average income to average rent
Median household income ($) - White
Median household income ($) - Black or African American
Median household income ($) - Asian
Median household income ($) - Hispanic or Latino
Median household income ($) - American Indian and Alaska Native
Median household income ($) - Multirace
Median household income ($) - Other Race
Median household income for houses/condos with a mortgage ($)
Median household income for apartments without a mortgage ($)
Races - White alone (%)
Races - White alone (% change since 2000)
Races - Black alone (%)
Races - Black alone (% change since 2000)
Races - American Indian alone (%)
Races - American Indian alone (% change since 2000)
Races - Asian alone (%)
Races - Asian alone (% change since 2000)
Races - Hispanic (%)
Races - Hispanic (% change since 2000)
Races - Native Hawaiian and Other Pacific Islander alone (%)
Races - Native Hawaiian and Other Pacific Islander alone (% change since 2000)
Races - Two or more races (%)
Races - Two or more races (% change since 2000)
Races - Other race alone (%)
Races - Other race alone (% change since 2000)
Racial diversity
Unemployment (%)
Unemployment (% change since 2000)
Unemployment (%) - White
Unemployment (%) - Black or African American
Unemployment (%) - Asian
Unemployment (%) - Hispanic or Latino
Unemployment (%) - American Indian and Alaska Native
Unemployment (%) - Multirace
Unemployment (%) - Other Race
Population density (people per square mile)
Population - Males (%)
Population - Females (%)
Population - Males (%) - White
Population - Males (%) - Black or African American
Population - Males (%) - Asian
Population - Males (%) - Hispanic or Latino
Population - Males (%) - American Indian and Alaska Native
Population - Males (%) - Multirace
Population - Males (%) - Other Race
Population - Females (%) - White
Population - Females (%) - Black or African American
Population - Females (%) - Asian
Population - Females (%) - Hispanic or Latino
Population - Females (%) - American Indian and Alaska Native
Population - Females (%) - Multirace
Population - Females (%) - Other Race
Coronavirus confirmed cases (May 28, 2024)
Deaths caused by coronavirus (May 28, 2024)
Coronavirus confirmed cases (per 100k population) (May 28, 2024)
Deaths caused by coronavirus (per 100k population) (May 28, 2024)
Daily increase in number of cases (May 28, 2024)
Weekly increase in number of cases (May 28, 2024)
Cases doubled (in days) (May 28, 2024)
Hospitalized patients (Apr 18, 2022)
Negative test results (Apr 18, 2022)
Total test results (Apr 18, 2022)
COVID Vaccine doses distributed (per 100k population) (Sep 19, 2023)
COVID Vaccine doses administered (per 100k population) (Sep 19, 2023)
COVID Vaccine doses distributed (Sep 19, 2023)
COVID Vaccine doses administered (Sep 19, 2023)
Likely homosexual households (%)
Likely homosexual households (% change since 2000)
Likely homosexual households - Lesbian couples (%)
Likely homosexual households - Lesbian couples (% change since 2000)
Likely homosexual households - Gay men (%)
Likely homosexual households - Gay men (% change since 2000)
Cost of living index
Median gross rent ($)
Median contract rent ($)
Median monthly housing costs ($)
Median house or condo value ($)
Median house or condo value ($ change since 2000)
Mean house or condo value by units in structure - 1, detached ($)
Mean house or condo value by units in structure - 1, attached ($)
Mean house or condo value by units in structure - 2 ($)
Mean house or condo value by units in structure by units in structure - 3 or 4 ($)
Mean house or condo value by units in structure - 5 or more ($)
Mean house or condo value by units in structure - Boat, RV, van, etc. ($)
Mean house or condo value by units in structure - Mobile home ($)
Median house or condo value ($) - White
Median house or condo value ($) - Black or African American
Median house or condo value ($) - Asian
Median house or condo value ($) - Hispanic or Latino
Median house or condo value ($) - American Indian and Alaska Native
Median house or condo value ($) - Multirace
Median house or condo value ($) - Other Race
Median resident age
Resident age diversity
Median resident age - Males
Median resident age - Females
Median resident age - White
Median resident age - Black or African American
Median resident age - Asian
Median resident age - Hispanic or Latino
Median resident age - American Indian and Alaska Native
Median resident age - Multirace
Median resident age - Other Race
Median resident age - Males - White
Median resident age - Males - Black or African American
Median resident age - Males - Asian
Median resident age - Males - Hispanic or Latino
Median resident age - Males - American Indian and Alaska Native
Median resident age - Males - Multirace
Median resident age - Males - Other Race
Median resident age - Females - White
Median resident age - Females - Black or African American
Median resident age - Females - Asian
Median resident age - Females - Hispanic or Latino
Median resident age - Females - American Indian and Alaska Native
Median resident age - Females - Multirace
Median resident age - Females - Other Race
Commute - mean travel time to work (minutes)
Travel time to work - Less than 5 minutes (%)
Travel time to work - Less than 5 minutes (% change since 2000)
Travel time to work - 5 to 9 minutes (%)
Travel time to work - 5 to 9 minutes (% change since 2000)
Travel time to work - 10 to 19 minutes (%)
Travel time to work - 10 to 19 minutes (% change since 2000)
Travel time to work - 20 to 29 minutes (%)
Travel time to work - 20 to 29 minutes (% change since 2000)
Travel time to work - 30 to 39 minutes (%)
Travel time to work - 30 to 39 minutes (% change since 2000)
Travel time to work - 40 to 59 minutes (%)
Travel time to work - 40 to 59 minutes (% change since 2000)
Travel time to work - 60 to 89 minutes (%)
Travel time to work - 60 to 89 minutes (% change since 2000)
Travel time to work - 90 or more minutes (%)
Travel time to work - 90 or more minutes (% change since 2000)
Marital status - Never married (%)
Marital status - Now married (%)
Marital status - Separated (%)
Marital status - Widowed (%)
Marital status - Divorced (%)
Median family income ($)
Median family income (% change since 2000)
Median non-family income ($)
Median non-family income (% change since 2000)
Median per capita income ($)
Median per capita income (% change since 2000)
Median family income ($) - White
Median family income ($) - Black or African American
Median family income ($) - Asian
Median family income ($) - Hispanic or Latino
Median family income ($) - American Indian and Alaska Native
Median family income ($) - Multirace
Median family income ($) - Other Race
Median year house/condo built
Median year apartment built
Year house built - Built 2005 or later (%)
Year house built - Built 2000 to 2004 (%)
Year house built - Built 1990 to 1999 (%)
Year house built - Built 1980 to 1989 (%)
Year house built - Built 1970 to 1979 (%)
Year house built - Built 1960 to 1969 (%)
Year house built - Built 1950 to 1959 (%)
Year house built - Built 1940 to 1949 (%)
Year house built - Built 1939 or earlier (%)
Average household size
Household density (households per square mile)
Average household size - White
Average household size - Black or African American
Average household size - Asian
Average household size - Hispanic or Latino
Average household size - American Indian and Alaska Native
Average household size - Multirace
Average household size - Other Race
Occupied housing units (%)
Vacant housing units (%)
Owner occupied housing units (%)
Renter occupied housing units (%)
Vacancy status - For rent (%)
Vacancy status - For sale only (%)
Vacancy status - Rented or sold, not occupied (%)
Vacancy status - For seasonal, recreational, or occasional use (%)
Vacancy status - For migrant workers (%)
Vacancy status - Other vacant (%)
Residents with income below the poverty level (%)
Residents with income below 50% of the poverty level (%)
Children below poverty level (%)
Poor families by family type - Married-couple family (%)
Poor families by family type - Male, no wife present (%)
Poor families by family type - Female, no husband present (%)
Poverty status for native-born residents (%)
Poverty status for foreign-born residents (%)
Poverty among high school graduates not in families (%)
Poverty among people who did not graduate high school not in families (%)
Residents with income below the poverty level (%) - White
Residents with income below the poverty level (%) - Black or African American
Residents with income below the poverty level (%) - Asian
Residents with income below the poverty level (%) - Hispanic or Latino
Residents with income below the poverty level (%) - American Indian and Alaska Native
Residents with income below the poverty level (%) - Multirace
Residents with income below the poverty level (%) - Other Race
Air pollution - Air Quality Index (AQI)
Air pollution - CO
Air pollution - NO2
Air pollution - SO2
Air pollution - Ozone
Air pollution - PM10
Air pollution - PM25
Air pollution - Pb
Crime - Murders per 100,000 population
Crime - Rapes per 100,000 population
Crime - Robberies per 100,000 population
Crime - Assaults per 100,000 population
Crime - Burglaries per 100,000 population
Crime - Thefts per 100,000 population
Crime - Auto thefts per 100,000 population
Crime - Arson per 100,000 population
Crime - City-data.com crime index
Crime - Violent crime index
Crime - Property crime index
Crime - Murders per 100,000 population (5 year average)
Crime - Rapes per 100,000 population (5 year average)
Crime - Robberies per 100,000 population (5 year average)
Crime - Assaults per 100,000 population (5 year average)
Crime - Burglaries per 100,000 population (5 year average)
Crime - Thefts per 100,000 population (5 year average)
Crime - Auto thefts per 100,000 population (5 year average)
Crime - Arson per 100,000 population (5 year average)
Crime - City-data.com crime index (5 year average)
Crime - Violent crime index (5 year average)
Crime - Property crime index (5 year average)
1996 Presidential Elections Results (%) - Democratic Party (Clinton)
1996 Presidential Elections Results (%) - Republican Party (Dole)
1996 Presidential Elections Results (%) - Other
2000 Presidential Elections Results (%) - Democratic Party (Gore)
2000 Presidential Elections Results (%) - Republican Party (Bush)
2000 Presidential Elections Results (%) - Other
2004 Presidential Elections Results (%) - Democratic Party (Kerry)
2004 Presidential Elections Results (%) - Republican Party (Bush)
2004 Presidential Elections Results (%) - Other
2008 Presidential Elections Results (%) - Democratic Party (Obama)
2008 Presidential Elections Results (%) - Republican Party (McCain)
2008 Presidential Elections Results (%) - Other
2012 Presidential Elections Results (%) - Democratic Party (Obama)
2012 Presidential Elections Results (%) - Republican Party (Romney)
2012 Presidential Elections Results (%) - Other
2016 Presidential Elections Results (%) - Democratic Party (Clinton)
2016 Presidential Elections Results (%) - Republican Party (Trump)
2016 Presidential Elections Results (%) - Other
2020 Presidential Elections Results (%) - Democratic Party (Biden)
2020 Presidential Elections Results (%) - Republican Party (Trump)
2020 Presidential Elections Results (%) - Other
Ancestries Reported - Arab (%)
Ancestries Reported - Czech (%)
Ancestries Reported - Danish (%)
Ancestries Reported - Dutch (%)
Ancestries Reported - English (%)
Ancestries Reported - French (%)
Ancestries Reported - French Canadian (%)
Ancestries Reported - German (%)
Ancestries Reported - Greek (%)
Ancestries Reported - Hungarian (%)
Ancestries Reported - Irish (%)
Ancestries Reported - Italian (%)
Ancestries Reported - Lithuanian (%)
Ancestries Reported - Norwegian (%)
Ancestries Reported - Polish (%)
Ancestries Reported - Portuguese (%)
Ancestries Reported - Russian (%)
Ancestries Reported - Scotch-Irish (%)
Ancestries Reported - Scottish (%)
Ancestries Reported - Slovak (%)
Ancestries Reported - Subsaharan African (%)
Ancestries Reported - Swedish (%)
Ancestries Reported - Swiss (%)
Ancestries Reported - Ukrainian (%)
Ancestries Reported - United States (%)
Ancestries Reported - Welsh (%)
Ancestries Reported - West Indian (%)
Ancestries Reported - Other (%)
Educational Attainment - No schooling completed (%)
Educational Attainment - Less than high school (%)
Educational Attainment - High school or equivalent (%)
Educational Attainment - Less than 1 year of college (%)
Educational Attainment - 1 or more years of college (%)
Educational Attainment - Associate degree (%)
Educational Attainment - Bachelor's degree (%)
Educational Attainment - Master's degree (%)
Educational Attainment - Professional school degree (%)
Educational Attainment - Doctorate degree (%)
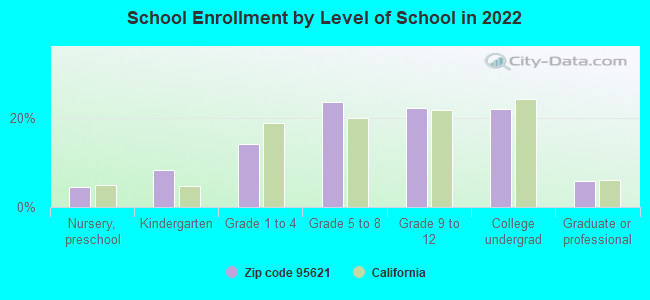
School Enrollment - Nursery, preschool (%)
School Enrollment - Kindergarten (%)
School Enrollment - Grade 1 to 4 (%)
School Enrollment - Grade 5 to 8 (%)
School Enrollment - Grade 9 to 12 (%)
School Enrollment - College undergrad (%)
School Enrollment - Graduate or professional (%)
School Enrollment - Not enrolled in school (%)
School enrollment - Public schools (%)
School enrollment - Private schools (%)
School enrollment - Not enrolled (%)
Median number of rooms in houses and condos
Median number of rooms in apartments
Housing units lacking complete plumbing facilities (%)
Housing units lacking complete kitchen facilities (%)
Density of houses
Urban houses (%)
Rural houses (%)
Households with people 60 years and over (%)
Households with people 65 years and over (%)
Households with people 75 years and over (%)
Households with one or more nonrelatives (%)
Households with no nonrelatives (%)
Population in households (%)
Family households (%)
Nonfamily households (%)
Population in families (%)
Family households with own children (%)
Median number of bedrooms in owner occupied houses
Mean number of bedrooms in owner occupied houses
Median number of bedrooms in renter occupied houses
Mean number of bedrooms in renter occupied houses
Median number of vehichles in owner occupied houses
Mean number of vehichles in owner occupied houses
Median number of vehichles in renter occupied houses
Mean number of vehichles in renter occupied houses
Mortgage status - with mortgage (%)
Mortgage status - with second mortgage (%)
Mortgage status - with home equity loan (%)
Mortgage status - with both second mortgage and home equity loan (%)
Mortgage status - without a mortgage (%)
Average family size
Average family size - White
Average family size - Black or African American
Average family size - Asian
Average family size - Hispanic or Latino
Average family size - American Indian and Alaska Native
Average family size - Multirace
Average family size - Other Race
Geographical mobility - Same house 1 year ago (%)
Geographical mobility - Moved within same county (%)
Geographical mobility - Moved from different county within same state (%)
Geographical mobility - Moved from different state (%)
Geographical mobility - Moved from abroad (%)
Place of birth - Born in state of residence (%)
Place of birth - Born in other state (%)
Place of birth - Native, outside of US (%)
Place of birth - Foreign born (%)
Housing units in structures - 1, detached (%)
Housing units in structures - 1, attached (%)
Housing units in structures - 2 (%)
Housing units in structures - 3 or 4 (%)
Housing units in structures - 5 to 9 (%)
Housing units in structures - 10 to 19 (%)
Housing units in structures - 20 to 49 (%)
Housing units in structures - 50 or more (%)
Housing units in structures - Mobile home (%)
Housing units in structures - Boat, RV, van, etc. (%)
House/condo owner moved in on average (years ago)
Renter moved in on average (years ago)
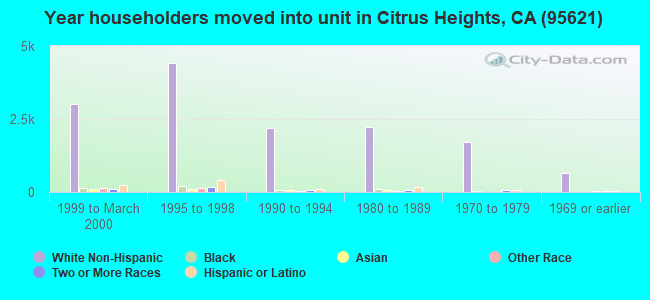
Year householder moved into unit - Moved in 1999 to March 2000 (%)
Year householder moved into unit - Moved in 1995 to 1998 (%)
Year householder moved into unit - Moved in 1990 to 1994 (%)
Year householder moved into unit - Moved in 1980 to 1989 (%)
Year householder moved into unit - Moved in 1970 to 1979 (%)
Year householder moved into unit - Moved in 1969 or earlier (%)
Means of transportation to work - Drove car alone (%)
Means of transportation to work - Carpooled (%)
Means of transportation to work - Public transportation (%)
Means of transportation to work - Bus or trolley bus (%)
Means of transportation to work - Streetcar or trolley car (%)
Means of transportation to work - Subway or elevated (%)
Means of transportation to work - Railroad (%)
Means of transportation to work - Ferryboat (%)
Means of transportation to work - Taxicab (%)
Means of transportation to work - Motorcycle (%)
Means of transportation to work - Bicycle (%)
Means of transportation to work - Walked (%)
Means of transportation to work - Other means (%)
Working at home (%)
Industry diversity
Most Common Industries - Agriculture, forestry, fishing and hunting, and mining (%)
Most Common Industries - Agriculture, forestry, fishing and hunting (%)
Most Common Industries - Mining, quarrying, and oil and gas extraction (%)
Most Common Industries - Construction (%)
Most Common Industries - Manufacturing (%)
Most Common Industries - Wholesale trade (%)
Most Common Industries - Retail trade (%)
Most Common Industries - Transportation and warehousing, and utilities (%)
Most Common Industries - Transportation and warehousing (%)
Most Common Industries - Utilities (%)
Most Common Industries - Information (%)
Most Common Industries - Finance and insurance, and real estate and rental and leasing (%)
Most Common Industries - Finance and insurance (%)
Most Common Industries - Real estate and rental and leasing (%)
Most Common Industries - Professional, scientific, and management, and administrative and waste management services (%)
Most Common Industries - Professional, scientific, and technical services (%)
Most Common Industries - Management of companies and enterprises (%)
Most Common Industries - Administrative and support and waste management services (%)
Most Common Industries - Educational services, and health care and social assistance (%)
Most Common Industries - Educational services (%)
Most Common Industries - Health care and social assistance (%)
Most Common Industries - Arts, entertainment, and recreation, and accommodation and food services (%)
Most Common Industries - Arts, entertainment, and recreation (%)
Most Common Industries - Accommodation and food services (%)
Most Common Industries - Other services, except public administration (%)
Most Common Industries - Public administration (%)
Occupation diversity
Most Common Occupations - Management, business, science, and arts occupations (%)
Most Common Occupations - Management, business, and financial occupations (%)
Most Common Occupations - Management occupations (%)
Most Common Occupations - Business and financial operations occupations (%)
Most Common Occupations - Computer, engineering, and science occupations (%)
Most Common Occupations - Computer and mathematical occupations (%)
Most Common Occupations - Architecture and engineering occupations (%)
Most Common Occupations - Life, physical, and social science occupations (%)
Most Common Occupations - Education, legal, community service, arts, and media occupations (%)
Most Common Occupations - Community and social service occupations (%)
Most Common Occupations - Legal occupations (%)
Most Common Occupations - Education, training, and library occupations (%)
Most Common Occupations - Arts, design, entertainment, sports, and media occupations (%)
Most Common Occupations - Healthcare practitioners and technical occupations (%)
Most Common Occupations - Health diagnosing and treating practitioners and other technical occupations (%)
Most Common Occupations - Health technologists and technicians (%)
Most Common Occupations - Service occupations (%)
Most Common Occupations - Healthcare support occupations (%)
Most Common Occupations - Protective service occupations (%)
Most Common Occupations - Fire fighting and prevention, and other protective service workers including supervisors (%)
Most Common Occupations - Law enforcement workers including supervisors (%)
Most Common Occupations - Food preparation and serving related occupations (%)
Most Common Occupations - Building and grounds cleaning and maintenance occupations (%)
Most Common Occupations - Personal care and service occupations (%)
Most Common Occupations - Sales and office occupations (%)
Most Common Occupations - Sales and related occupations (%)
Most Common Occupations - Office and administrative support occupations (%)
Most Common Occupations - Natural resources, construction, and maintenance occupations (%)
Most Common Occupations - Farming, fishing, and forestry occupations (%)
Most Common Occupations - Construction and extraction occupations (%)
Most Common Occupations - Installation, maintenance, and repair occupations (%)
Most Common Occupations - Production, transportation, and material moving occupations (%)
Most Common Occupations - Production occupations (%)
Most Common Occupations - Transportation occupations (%)
Most Common Occupations - Material moving occupations (%)
People in Group quarters - Institutionalized population (%)
People in Group quarters - Correctional institutions (%)
People in Group quarters - Federal prisons and detention centers (%)
People in Group quarters - Halfway houses (%)
People in Group quarters - Local jails and other confinement facilities (including police lockups) (%)
People in Group quarters - Military disciplinary barracks (%)
People in Group quarters - State prisons (%)
People in Group quarters - Other types of correctional institutions (%)
People in Group quarters - Nursing homes (%)
People in Group quarters - Hospitals/wards, hospices, and schools for the handicapped (%)
People in Group quarters - Hospitals/wards and hospices for chronically ill (%)
People in Group quarters - Hospices or homes for chronically ill (%)
People in Group quarters - Military hospitals or wards for chronically ill (%)
People in Group quarters - Other hospitals or wards for chronically ill (%)
People in Group quarters - Hospitals or wards for drug/alcohol abuse (%)
People in Group quarters - Mental (Psychiatric) hospitals or wards (%)
People in Group quarters - Schools, hospitals, or wards for the mentally retarded (%)
People in Group quarters - Schools, hospitals, or wards for the physically handicapped (%)
People in Group quarters - Institutions for the deaf (%)
People in Group quarters - Institutions for the blind (%)
People in Group quarters - Orthopedic wards and institutions for the physically handicapped (%)
People in Group quarters - Wards in general hospitals for patients who have no usual home elsewhere (%)
People in Group quarters - Wards in military hospitals for patients who have no usual home elsewhere (%)
People in Group quarters - Juvenile institutions (%)
People in Group quarters - Long-term care (%)
People in Group quarters - Homes for abused, dependent, and neglected children (%)
People in Group quarters - Residential treatment centers for emotionally disturbed children (%)
People in Group quarters - Training schools for juvenile delinquents (%)
People in Group quarters - Short-term care, detention or diagnostic centers for delinquent children (%)
People in Group quarters - Type of juvenile institution unknown (%)
People in Group quarters - Noninstitutionalized population (%)
People in Group quarters - College dormitories (includes college quarters off campus) (%)
People in Group quarters - Military quarters (%)
People in Group quarters - On base (%)
People in Group quarters - Barracks, unaccompanied personnel housing (UPH), (Enlisted/Officer), ;and similar group living quarters for military personnel (%)
People in Group quarters - Transient quarters for temporary residents (%)
People in Group quarters - Military ships (%)
People in Group quarters - Group homes (%)
People in Group quarters - Homes or halfway houses for drug/alcohol abuse (%)
People in Group quarters - Homes for the mentally ill (%)
People in Group quarters - Homes for the mentally retarded (%)
People in Group quarters - Homes for the physically handicapped (%)
People in Group quarters - Other group homes (%)
People in Group quarters - Religious group quarters (%)
People in Group quarters - Dormitories (%)
People in Group quarters - Agriculture workers' dormitories on farms (%)
People in Group quarters - Job Corps and vocational training facilities (%)
People in Group quarters - Other workers' dormitories (%)
People in Group quarters - Crews of maritime vessels (%)
People in Group quarters - Other nonhousehold living situations (%)
People in Group quarters - Other noninstitutional group quarters (%)
Residents speaking English at home (%)
Residents speaking English at home - Born in the United States (%)
Residents speaking English at home - Native, born elsewhere (%)
Residents speaking English at home - Foreign born (%)
Residents speaking Spanish at home (%)
Residents speaking Spanish at home - Born in the United States (%)
Residents speaking Spanish at home - Native, born elsewhere (%)
Residents speaking Spanish at home - Foreign born (%)
Residents speaking other language at home (%)
Residents speaking other language at home - Born in the United States (%)
Residents speaking other language at home - Native, born elsewhere (%)
Residents speaking other language at home - Foreign born (%)
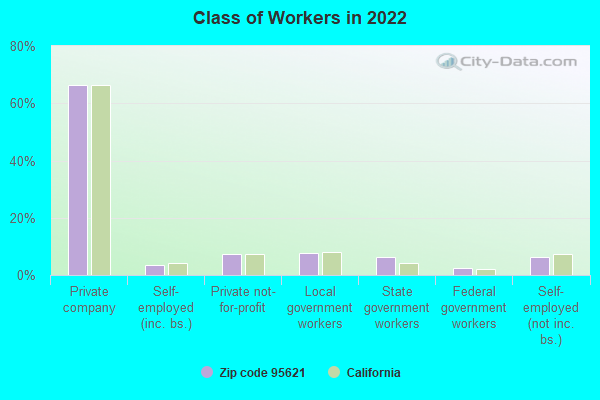
Class of Workers - Employee of private company (%)
Class of Workers - Self-employed in own incorporated business (%)
Class of Workers - Private not-for-profit wage and salary workers (%)
Class of Workers - Local government workers (%)
Class of Workers - State government workers (%)
Class of Workers - Federal government workers (%)
Class of Workers - Self-employed workers in own not incorporated business and Unpaid family workers (%)
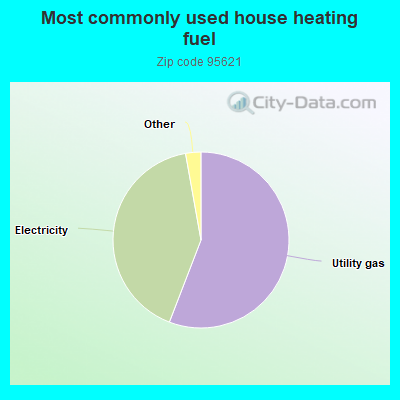
House heating fuel used in houses and condos - Utility gas (%)
House heating fuel used in houses and condos - Bottled, tank, or LP gas (%)
House heating fuel used in houses and condos - Electricity (%)
House heating fuel used in houses and condos - Fuel oil, kerosene, etc. (%)
House heating fuel used in houses and condos - Coal or coke (%)
House heating fuel used in houses and condos - Wood (%)
House heating fuel used in houses and condos - Solar energy (%)
House heating fuel used in houses and condos - Other fuel (%)
House heating fuel used in houses and condos - No fuel used (%)
House heating fuel used in apartments - Utility gas (%)
House heating fuel used in apartments - Bottled, tank, or LP gas (%)
House heating fuel used in apartments - Electricity (%)
House heating fuel used in apartments - Fuel oil, kerosene, etc. (%)
House heating fuel used in apartments - Coal or coke (%)
House heating fuel used in apartments - Wood (%)
House heating fuel used in apartments - Solar energy (%)
House heating fuel used in apartments - Other fuel (%)
House heating fuel used in apartments - No fuel used (%)
Armed forces status - In Armed Forces (%)
Armed forces status - Civilian (%)
Armed forces status - Civilian - Veteran (%)
Armed forces status - Civilian - Nonveteran (%)
Fatal accidents locations in years 2005-2021
Fatal accidents locations in 2005
Fatal accidents locations in 2006
Fatal accidents locations in 2007
Fatal accidents locations in 2008
Fatal accidents locations in 2009
Fatal accidents locations in 2010
Fatal accidents locations in 2011
Fatal accidents locations in 2012
Fatal accidents locations in 2013
Fatal accidents locations in 2014
Fatal accidents locations in 2015
Fatal accidents locations in 2016
Fatal accidents locations in 2017
Fatal accidents locations in 2018
Fatal accidents locations in 2019
Fatal accidents locations in 2020
Fatal accidents locations in 2021
Alcohol use - People drinking some alcohol every month (%)
Alcohol use - People not drinking at all (%)
Alcohol use - Average days/month drinking alcohol
Alcohol use - Average drinks/week
Alcohol use - Average days/year people drink much
Audiometry - Average condition of hearing (%)
Audiometry - People that can hear a whisper from across a quiet room (%)
Audiometry - People that can hear normal voice from across a quiet room (%)
Audiometry - Ears ringing, roaring, buzzing (%)
Audiometry - Had a job exposure to loud noise (%)
Audiometry - Had off-work exposure to loud noise (%)
Blood Pressure & Cholesterol - Has high blood pressure (%)
Blood Pressure & Cholesterol - Checking blood pressure at home (%)
Blood Pressure & Cholesterol - Frequently checking blood cholesterol (%)
Blood Pressure & Cholesterol - Has high cholesterol level (%)
Consumer Behavior - Money monthly spent on food at supermarket/grocery store
Consumer Behavior - Money monthly spent on food at other stores
Consumer Behavior - Money monthly spent on eating out
Consumer Behavior - Money monthly spent on carryout/delivered foods
Consumer Behavior - Income spent on food at supermarket/grocery store (%)
Consumer Behavior - Income spent on food at other stores (%)
Consumer Behavior - Income spent on eating out (%)
Consumer Behavior - Income spent on carryout/delivered foods (%)
Current Health Status - General health condition (%)
Current Health Status - Blood donors (%)
Current Health Status - Has blood ever tested for HIV virus (%)
Current Health Status - Left-handed people (%)
Dermatology - People using sunscreen (%)
Diabetes - Diabetics (%)
Diabetes - Had a blood test for high blood sugar (%)
Diabetes - People taking insulin (%)
Diet Behavior & Nutrition - Diet health (%)
Diet Behavior & Nutrition - Milk product consumption (# of products/month)
Diet Behavior & Nutrition - Meals not home prepared (#/week)
Diet Behavior & Nutrition - Meals from fast food or pizza place (#/week)
Diet Behavior & Nutrition - Ready-to-eat foods (#/month)
Diet Behavior & Nutrition - Frozen meals/pizza (#/month)
Drug Use - People that ever used marijuana or hashish (%)
Drug Use - Ever used hard drugs (%)
Drug Use - Ever used any form of cocaine (%)
Drug Use - Ever used heroin (%)
Drug Use - Ever used methamphetamine (%)
Health Insurance - People covered by health insurance (%)
Kidney Conditions-Urology - Avg. # of times urinating at night
Medical Conditions - People with asthma (%)
Medical Conditions - People with anemia (%)
Medical Conditions - People with psoriasis (%)
Medical Conditions - People with overweight (%)
Medical Conditions - Elderly people having difficulties in thinking or remembering (%)
Medical Conditions - People who ever received blood transfusion (%)
Medical Conditions - People having trouble seeing even with glass/contacts (%)
Medical Conditions - People with arthritis (%)
Medical Conditions - People with gout (%)
Medical Conditions - People with congestive heart failure (%)
Medical Conditions - People with coronary heart disease (%)
Medical Conditions - People with angina pectoris (%)
Medical Conditions - People who ever had heart attack (%)
Medical Conditions - People who ever had stroke (%)
Medical Conditions - People with emphysema (%)
Medical Conditions - People with thyroid problem (%)
Medical Conditions - People with chronic bronchitis (%)
Medical Conditions - People with any liver condition (%)
Medical Conditions - People who ever had cancer or malignancy (%)
Mental Health - People who have little interest in doing things (%)
Mental Health - People feeling down, depressed, or hopeless (%)
Mental Health - People who have trouble sleeping or sleeping too much (%)
Mental Health - People feeling tired or having little energy (%)
Mental Health - People with poor appetite or overeating (%)
Mental Health - People feeling bad about themself (%)
Mental Health - People who have trouble concentrating on things (%)
Mental Health - People moving or speaking slowly or too fast (%)
Mental Health - People having thoughts they would be better off dead (%)
Oral Health - Average years since last visit a dentist
Oral Health - People embarrassed because of mouth (%)
Oral Health - People with gum disease (%)
Oral Health - General health of teeth and gums (%)
Oral Health - Average days a week using dental floss/device
Oral Health - Average days a week using mouthwash for dental problem
Oral Health - Average number of teeth
Pesticide Use - Households using pesticides to control insects (%)
Pesticide Use - Households using pesticides to kill weeds (%)
Physical Activity - People doing vigorous-intensity work activities (%)
Physical Activity - People doing moderate-intensity work activities (%)
Physical Activity - People walking or bicycling (%)
Physical Activity - People doing vigorous-intensity recreational activities (%)
Physical Activity - People doing moderate-intensity recreational activities (%)
Physical Activity - Average hours a day doing sedentary activities
Physical Activity - Average hours a day watching TV or videos
Physical Activity - Average hours a day using computer
Physical Functioning - People having limitations keeping them from working (%)
Physical Functioning - People limited in amount of work they can do (%)
Physical Functioning - People that need special equipment to walk (%)
Physical Functioning - People experiencing confusion/memory problems (%)
Physical Functioning - People requiring special healthcare equipment (%)
Prescription Medications - Average number of prescription medicines taking
Preventive Aspirin Use - Adults 40+ taking low-dose aspirin (%)
Reproductive Health - Vaginal deliveries (%)
Reproductive Health - Cesarean deliveries (%)
Reproductive Health - Deliveries resulted in a live birth (%)
Reproductive Health - Pregnancies resulted in a delivery (%)
Reproductive Health - Women breastfeeding newborns (%)
Reproductive Health - Women that had a hysterectomy (%)
Reproductive Health - Women that had both ovaries removed (%)
Reproductive Health - Women that have ever taken birth control pills (%)
Reproductive Health - Women taking birth control pills (%)
Reproductive Health - Women that have ever used Depo-Provera or injectables (%)
Reproductive Health - Women that have ever used female hormones (%)
Sexual Behavior - People 18+ that ever had sex (vaginal, anal, or oral) (%)
Sexual Behavior - Males 18+ that ever had vaginal sex with a woman (%)
Sexual Behavior - Males 18+ that ever performed oral sex on a woman (%)
Sexual Behavior - Males 18+ that ever had anal sex with a woman (%)
Sexual Behavior - Males 18+ that ever had any sex with a man (%)
Sexual Behavior - Females 18+ that ever had vaginal sex with a man (%)
Sexual Behavior - Females 18+ that ever performed oral sex on a man (%)
Sexual Behavior - Females 18+ that ever had anal sex with a man (%)
Sexual Behavior - Females 18+ that ever had any kind of sex with a woman (%)
Sexual Behavior - Average age people first had sex
Sexual Behavior - Average number of female sex partners in lifetime (males 18+)
Sexual Behavior - Average number of female vaginal sex partners in lifetime (males 18+)
Sexual Behavior - Average age people first performed oral sex on a woman (18+)
Sexual Behavior - Average number of woman performed oral sex on in lifetime (18+)
Sexual Behavior - Average number of male sex partners in lifetime (males 18+)
Sexual Behavior - Average number of male anal sex partners in lifetime (males 18+)
Sexual Behavior - Average age people first performed oral sex on a man (18+)
Sexual Behavior - Average number of male oral sex partners in lifetime (18+)
Sexual Behavior - People using protection when performing oral sex (%)
Sexual Behavior - Average number of times people have vaginal or anal sex a year
Sexual Behavior - People having sex without condom (%)
Sexual Behavior - Average number of male sex partners in lifetime (females 18+)
Sexual Behavior - Average number of male vaginal sex partners in lifetime (females 18+)
Sexual Behavior - Average number of female sex partners in lifetime (females 18+)
Sexual Behavior - Circumcised males 18+ (%)
Sleep Disorders - Average hours sleeping at night
Sleep Disorders - People that has trouble sleeping (%)
Smoking-Cigarette Use - People smoking cigarettes (%)
Taste & Smell - People 40+ having problems with smell (%)
Taste & Smell - People 40+ having problems with taste (%)
Taste & Smell - People 40+ that ever had wisdom teeth removed (%)
Taste & Smell - People 40+ that ever had tonsils teeth removed (%)
Taste & Smell - People 40+ that ever had a loss of consciousness because of a head injury (%)
Taste & Smell - People 40+ that ever had a broken nose or other serious injury to face or skull (%)
Taste & Smell - People 40+ that ever had two or more sinus infections (%)
Weight - Average height (inches)
Weight - Average weight (pounds)
Weight - Average BMI
Weight - People that are obese (%)
Weight - People that ever were obese (%)
Weight - People trying to lose weight (%)
100%
urban population.
Estimated median house/condo value in 2022: $408,170
95621:
$408,170California:
$715,900
According to our research of California and other state lists, there were 66 registered sex offenders living in 95621 zip code as of May 28, 2024 . The ratio of all residents to sex offenders in zip code 95621 is 644 to 1.The ratio of registered sex offenders to all residents in this zip code is near the state average.
Median resident age: This zip code:
40.0 yearsCalifornia median age:
37.9 years
Average household size: This zip code:
2.5 peopleCalifornia:
2.8 people
Averages for the 2020 tax year for zip code 95621, filed in 2021:
Average Adjusted Gross Income (AGI) in 2020: $54,984 (Individual Income Tax Returns) Here:
$54,984State:
$95,910
Salary/wage: $51,072 (reported on 77.8% of returns )Here:
$51,072State:
$77,331
(% of AGI for various income ranges: 1129.2% for AGIs below $25k , 3711.6% for AGIs $25k-50k , 6824.4% for AGIs $50k-75k , 10214.2% for AGIs $75k-100k , 18292.2% for AGIs $100k-200k , 42425.0% for AGIs over 200k ) Taxable interest for individuals: $636 (reported on 35.4% of returns )This zip code:
$636California:
$2,294
(% of AGI for various income ranges: 14.9% for AGIs below $25k , 15.9% for AGIs $25k-50k , 33.2% for AGIs $50k-75k , 43.5% for AGIs $75k-100k , 94.6% for AGIs $100k-200k , 604.0% for AGIs over 200k ) Ordinary dividends: $2,727 (reported on 11.9% of returns )(% of AGI for various income ranges: 19.1% for AGIs below $25k , 21.6% for AGIs $25k-50k , 44.5% for AGIs $50k-75k , 68.5% for AGIs $75k-100k , 130.2% for AGIs $100k-200k , 1129.0% for AGIs over 200k ) Net capital gain/loss in AGI: +$7,505 (reported on 11.6% of returns )Here:
+$7,505State:
+$49,306
(% of AGI for various income ranges: 6.3% for AGIs below $25k , 15.3% for AGIs $25k-50k , 48.2% for AGIs $50k-75k , 139.2% for AGIs $75k-100k , 355.6% for AGIs $100k-200k , 8999.0% for AGIs over 200k ) Profit/loss from business: +$10,022 (reported on 14.5% of returns )Here:
+$10,022State:
+$15,671
(% of AGI for various income ranges: 137.1% for AGIs below $25k , 197.5% for AGIs $25k-50k , 239.3% for AGIs $50k-75k , 263.5% for AGIs $75k-100k , 336.2% for AGIs $100k-200k , 1812.0% for AGIs over 200k ) Taxable individual retirement arrangement distribution: $14,237 (reported on 7.7% of returns )95621:
$14,237California:
$23,505
(% of AGI for various income ranges: 62.4% for AGIs below $25k , 82.2% for AGIs $25k-50k , 152.0% for AGIs $50k-75k , 279.4% for AGIs $75k-100k , 488.7% for AGIs $100k-200k , 2013.0% for AGIs over 200k ) Self-employed (Keogh) retirement plans: $12,800 (reported on 0.1% of returns )95621:
$12,800California:
$30,163
(% of AGI for various income ranges: 24.6% for AGIs $75k-100k ) Total itemized deductions: $25,010 (reported on 10.4% of returns )Here:
$25,010State:
$39,517
(% of AGI for various income ranges: 67.3% for AGIs below $25k , 135.1% for AGIs $25k-50k , 431.2% for AGIs $50k-75k , 795.6% for AGIs $75k-100k , 1232.8% for AGIs $100k-200k , 5207.0% for AGIs over 200k ) Charity contributions: $5,595 (reported on 7.6% of returns )(% of AGI for various income ranges: 4.4% for AGIs below $25k , 11.2% for AGIs $25k-50k , 44.3% for AGIs $50k-75k , 118.2% for AGIs $75k-100k , 240.3% for AGIs $100k-200k , 1953.0% for AGIs over 200k ) Taxes paid: $7,247 (reported on 10.3% of returns )(% of AGI for various income ranges: 11.7% for AGIs below $25k , 25.8% for AGIs $25k-50k , 124.7% for AGIs $50k-75k , 256.9% for AGIs $75k-100k , 412.0% for AGIs $100k-200k , 1108.0% for AGIs over 200k ) Earned income credit: $1,915 (reported on 13.0% of returns )(% of AGI for various income ranges: 70.8% for AGIs below $25k , 56.4% for AGIs $25k-50k , 1.1% for AGIs $50k-75k ) Percentage of individuals using paid preparers for their 2020 taxes: 92.5%(% for various income ranges: 91.2% for AGIs below $25k , 92.9% for AGIs $25k-50k , 93.5% for AGIs $50k-75k , 93.2% for AGIs $75k-100k , 92.6% for AGIs $100k-200k , 92.3% for AGIs over 200k )
Averages for the 2012 tax year for zip code 95621, filed in 2013:
Average Adjusted Gross Income (AGI) in 2012: $43,404 (Individual Income Tax Returns) Here:
$43,404State:
$72,726
Salary/wage: $39,897 (reported on 78.9% of returns )Here:
$39,897State:
$59,079
(% of AGI for various income ranges: 66.5% for AGIs below $25k , 74.7% for AGIs $25k-50k , 72.7% for AGIs $50k-75k , 73.1% for AGIs $75k-100k , 73.7% for AGIs $100k-200k , 61.2% for AGIs over 200k ) Taxable interest for individuals: $588 (reported on 36.2% of returns )This zip code:
$588California:
$2,146
(% of AGI for various income ranges: 0.9% for AGIs below $25k , 0.5% for AGIs $25k-50k , 0.5% for AGIs $50k-75k , 0.4% for AGIs $75k-100k , 0.4% for AGIs $100k-200k , 0.9% for AGIs over 200k ) Ordinary dividends: $2,586 (reported on 13.0% of returns )(% of AGI for various income ranges: 1.0% for AGIs below $25k , 0.6% for AGIs $25k-50k , 0.8% for AGIs $50k-75k , 0.7% for AGIs $75k-100k , 0.8% for AGIs $100k-200k , 1.2% for AGIs over 200k ) Net capital gain/loss in AGI: +$1,161 (reported on 10.1% of returns )Here:
+$1,161State:
+$30,460
(% of AGI for various income ranges: 0.3% for AGIs $50k-75k , 0.3% for AGIs $75k-100k , 0.4% for AGIs $100k-200k , 2.4% for AGIs over 200k ) Profit/loss from business: +$9,473 (reported on 13.6% of returns )Here:
+$9,473State:
+$17,064
(% of AGI for various income ranges: 9.0% for AGIs below $25k , 3.8% for AGIs $25k-50k , 2.1% for AGIs $50k-75k , 1.6% for AGIs $75k-100k , 1.2% for AGIs $100k-200k ) Taxable individual retirement arrangement distribution: $11,271 (reported on 9.7% of returns )95621:
$11,271California:
$19,557
(% of AGI for various income ranges: 2.7% for AGIs below $25k , 2.0% for AGIs $25k-50k , 2.2% for AGIs $50k-75k , 2.5% for AGIs $75k-100k , 3.7% for AGIs $100k-200k ) Self-employment retirement plans: $9,950 (reported on 0.2% of returns )95621:
$9,950California:
$24,530
Total itemized deductions: $18,342 (26% of AGI, reported on 30.8% of returns )Here:
$18,342State:
$34,004
Here:
25.9% of AGIState:
22.7% of AGI
(% of AGI for various income ranges: 9.3% for AGIs below $25k , 10.0% for AGIs $25k-50k , 13.7% for AGIs $50k-75k , 14.9% for AGIs $75k-100k , 16.1% for AGIs $100k-200k , 15.2% for AGIs over 200k ) Charity contributions: $2,665 (reported on 24.5% of returns )(% of AGI for various income ranges: 0.7% for AGIs below $25k , 1.0% for AGIs $25k-50k , 1.5% for AGIs $50k-75k , 1.8% for AGIs $75k-100k , 2.3% for AGIs $100k-200k , 2.6% for AGIs over 200k ) Taxes paid: $5,046 (reported on 30.8% of returns )95621:
$5,046State:
$14,448
(% of AGI for various income ranges: 1.4% for AGIs below $25k , 2.1% for AGIs $25k-50k , 3.4% for AGIs $50k-75k , 4.3% for AGIs $75k-100k , 5.7% for AGIs $100k-200k , 6.9% for AGIs over 200k ) Earned income credit: $2,026 (reported on 18.3% of returns )(% of AGI for various income ranges: 5.5% for AGIs below $25k , 1.0% for AGIs $25k-50k ) Percentage of individuals using paid preparers for their 2012 taxes: 48.7%(% for various income ranges: 44.8% for AGIs below $25k , 48.6% for AGIs $25k-50k , 51.8% for AGIs $50k-75k , 53.1% for AGIs $75k-100k , 55.3% for AGIs $100k-200k , 71.4% for AGIs over 200k )
Averages for the 2004 tax year for zip code 95621, filed in 2005:
Average Adjusted Gross Income (AGI) in 2004: $40,087 (Individual Income Tax Returns) Here:
$40,087State:
$58,600
Salary/wage: $37,923 (reported on 82.0% of returns )Here:
$37,923State:
$49,455
(% of AGI for various income ranges: 99.4% for AGIs below $10k , 69.6% for AGIs $10k-25k , 78.6% for AGIs $25k-50k , 79.5% for AGIs $50k-75k , 82.3% for AGIs $75k-100k , 70.4% for AGIs over 100k ) Taxable interest for individuals: $908 (reported on 47.6% of returns )This zip code:
$908California:
$2,365
(% of AGI for various income ranges: 4.8% for AGIs below $10k , 1.9% for AGIs $10k-25k , 1.1% for AGIs $25k-50k , 0.8% for AGIs $50k-75k , 0.8% for AGIs $75k-100k , 1.0% for AGIs over 100k ) Taxable dividends: $1,657 (reported on 18.3% of returns )(% of AGI for various income ranges: 2.8% for AGIs below $10k , 1.4% for AGIs $10k-25k , 0.6% for AGIs $25k-50k , 0.6% for AGIs $50k-75k , 0.6% for AGIs $75k-100k , 0.8% for AGIs over 100k ) Net capital gain/loss: +$4,553 (reported on 13.7% of returns )Here:
+$4,553State:
+$23,418
(% of AGI for various income ranges: -0.2% for AGIs below $10k , -0.2% for AGIs $10k-25k , 0.1% for AGIs $25k-50k , 0.5% for AGIs $50k-75k , 0.6% for AGIs $75k-100k , 8.5% for AGIs over 100k ) Profit/loss from business: +$9,633 (reported on 13.6% of returns )Here:
+$9,633State:
+$16,826
(% of AGI for various income ranges: 4.7% for AGIs below $10k , 6.3% for AGIs $10k-25k , 2.9% for AGIs $25k-50k , 2.5% for AGIs $50k-75k , 2.4% for AGIs $75k-100k , 4.2% for AGIs over 100k ) IRA payment deduction: $2,621 (reported on 2.3% of returns )95621:
$2,621California:
$3,192
(% of AGI for various income ranges: 0.2% for AGIs below $10k , 0.2% for AGIs $10k-25k , 0.2% for AGIs $25k-50k , 0.1% for AGIs $50k-75k , 0.1% for AGIs $75k-100k , 0.1% for AGIs over 100k ) Self-employed pension: $12,151 (reported on 0.5% of returns )Here:
$12,151California:
$17,688
(% of AGI for various income ranges: 0.3% for AGIs below $10k , 0.1% for AGIs $25k-50k , 0.1% for AGIs $50k-75k , 0.1% for AGIs $75k-100k , 0.5% for AGIs over 100k ) Total itemized deductions: $17,423 (28% of AGI, reported on 39.2% of returns )Here:
$17,423State:
$28,113
Here:
28.4% of AGIState:
25.3% of AGI
(% of AGI for various income ranges: 22.2% for AGIs below $10k , 11.8% for AGIs $10k-25k , 15.2% for AGIs $25k-50k , 19.1% for AGIs $50k-75k , 19.4% for AGIs $75k-100k , 17.1% for AGIs over 100k ) Charity contributions deductions: $2,247 (4% of AGI, reported on 34.1% of returns )Here:
3.6% of AGIState:
3.3% of AGI
(% of AGI for various income ranges: 1.2% for AGIs below $10k , 1.2% for AGIs $10k-25k , 1.5% for AGIs $25k-50k , 2.0% for AGIs $50k-75k , 2.2% for AGIs $75k-100k , 2.7% for AGIs over 100k ) Total tax: $4,439 (reported on 80.0% of returns )95621:
$4,439State:
$10,761
(% of AGI for various income ranges: 3.5% for AGIs below $10k , 4.6% for AGIs $10k-25k , 7.0% for AGIs $25k-50k , 8.6% for AGIs $50k-75k , 10.0% for AGIs $75k-100k , 14.8% for AGIs over 100k ) Earned income credit: $1,554 (reported on 12.2% of returns )Percentage of individuals using paid preparers for their 2004 taxes: 55.1%(% for various income ranges: 45.4% for AGIs below $10k , 54.7% for AGIs $10k-25k , 55.6% for AGIs $25k-50k , 58.8% for AGIs $50k-75k , 58.5% for AGIs $75k-100k , 65.0% for AGIs over 100k )
Estimated median household income in 2022: This zip code:
$74,286California:
$91,551
Nearest zip codes: 95610 ,
95842 ,
95841 ,
95843 ,
95628 ,
95678 .
Foothill Farms Zip Code Map
Percentage of family households: This zip code:
42.6%California:
46.8%
Percentage of households with unmarried partners: This zip code:
9.6%California:
48.1%
Likely homosexual households (counted as self-reported same-sex unmarried-partner households)
Lesbian couples: 0.2% of all households Gay men: 0.5% of all households
Household received Food Stamps/SNAP in the past 12 months: 2,283Household did not receive Food Stamps/SNAP in the past 12 months: 14,242
Women who had a birth in the past 12 months: 391 (247 now married , 144 unmarried) Women who did not have a birth in the past 12 months: 9,123 (3,452 now married , 5,678 unmarried)
Housing units in zip code 95621 with a mortgage: 7,284 (412
second mortgage , 11
home equity loan , 296
both second mortgage and home equity loan )
Houses without a mortgage: 134
Median monthly owner costs for units with a mortgage: $1,878
Median monthly owner costs for units without a mortgage: $601
Residents with income below the poverty level in 2022:
This zip code:
10.4%Whole state:
12.2%
Residents with income below 50% of the poverty level in 2022:
This zip code:
5.1%Whole state:
6.2%
Median number of rooms in houses and condos: Median number of rooms in apartments: Notable locations in this zip code not listed on our city pages
Click to draw/clear zip code borders Notable locations in zip code 95621: (A) , Foothill Golf Center (B) , Laymens Retreat House (C) , Sylvan Oaks Community Library (D) , Sacramento Metropolitan Fire District Station 27 (E) , Sacramento Metropolitan Fire District Station 23 (F) , Citrus Heights Police Station (G) , Citrus Heights City Hall (H) . Display/hide their locations on the map
Shopping Centers: (1) , San Juan Plaza Shopping Center (2) , Fountain Square Shopping Center (3) , Auburn Plaza Shopping Center (4) , Summer Hills Plaza Shopping Center (5) . Display/hide their locations on the map
Churches in zip code 95621 include: (A) , Ascension Lutheran Church (B) , Messiah Lutheran Church (C) , Resurrection Life of Jesus Church (D) . Display/hide their locations on the map
Cemeteries: (1) , Sylvan Cemetery (2) . Display/hide their locations on the map
Creek: (A) . Display/hide its location on the map
Parks in zip code 95621 include: (1) , Rusch Park (2) , Westwood Park (3) , Crosswoods Park (4) , Brooktree Park (5) , Cherry Creek Park (6) , Greenback Park (7) , Shadowcreek Park (8) . Display/hide their locations on the map
Year house built (houses)
0 2020 or later204 2010 to 2019845 2000 to 20091,298 1990 to 19993,310 1980 to 19897,023 1970 to 19792,147 1960 to 19691,564 1950 to 1959246 1940 to 194969 1939 or earlier
Zip code 95621 household income distribution in 2022 819 Less than $10,000446 $10,000 to $14,999401 $15,000 to $19,999631 $20,000 to $24,999608 $25,000 to $29,999598 $30,000 to $34,999715 $35,000 to $39,999811 $40,000 to $44,999571 $45,000 to $49,999952 $50,000 to $59,9991,759 $60,000 to $74,9992,498 $75,000 to $99,9992,046 $100,000 to $124,9991,173 $125,000 to $149,9991,504 $150,000 to $199,999929 $200,000 or moreEstimate of home value of owner-occupied houses/condos in 2022 in zip code 95621 236 Less than $10,000137 $10,000 to $14,99976 $15,000 to $19,99912 $20,000 to $24,99942 $25,000 to $29,99974 $30,000 to $34,99916 $35,000 to $39,99995 $40,000 to $49,99953 $50,000 to $59,999139 $60,000 to $69,999114 $70,000 to $79,99949 $80,000 to $89,99963 $90,000 to $99,999134 $100,000 to $124,999150 $125,000 to $149,999169 $150,000 to $174,99970 $175,000 to $199,999346 $200,000 to $249,999467 $250,000 to $299,9992,933 $300,000 to $399,9992,931 $400,000 to $499,9991,032 $500,000 to $749,99980 $750,000 to $999,99989 $1,000,000 to $1,499,999228 $2,000,000 or moreRent paid by renters in 2022 in zip code 95621 33 Less than $1009 $300 to $34911 $350 to $39915 $450 to $499102 $500 to $54915 $550 to $5999 $650 to $69977 $700 to $74967 $750 to $799189 $800 to $899106 $900 to $999968 $1,000 to $1,2491,236 $1,250 to $1,4992,034 $1,500 to $1,999166 $2,000 to $2,49980 $2,500 to $2,99912 $3,500 or more123 No cash rent
Median gross rent in 2022: $1,640.
Median price asked for vacant for-sale houses and condos in 2022: $332,383.
Estimated median house (or condo) value in 2022 for: White Non-Hispanic householders: $433,299Black or African American householders: $444,165American Indian or Alaska Native householders: $449,259Asian householders: $495,101Native Hawaiian and other Pacific Islander householders: $391,191Some other race householders: $400,699Two or more races householders: $399,001Hispanic or Latino householders: $431,261Estimated median house or condo value in 2022: $408,170
95621:
$408,170California:
$715,900
Lower value quartile - upper value quartile: $321,720 - $498,978
Mean price in 2022: Detached houses: $412,937Here:
$412,937State:
$988,808
Townhouses or other attached units: $330,073Here:
$330,073State:
$838,546
In 2-unit structures: $431,017Here:
$431,017State:
$1,138,100
In 3-to-4-unit structures: $154,752Here:
$154,752State:
$824,253
In 5-or-more-unit structures: $265,219Here:
$265,219State:
$730,996
Mobile homes: $118,533Here:
$118,533State:
$184,506
Occupied boats, RVs, vans, etc.: $160,048Here:
$160,048State:
$204,957
Housing units in structures:
One, detached: 10,452One, attached: 1,796Two: 3053 or 4: 1,0795 to 9: 75210 to 19: 39220 to 49: 24450 or more: 478Mobile homes: 1,620Boats, RVs, vans, etc.: 38Unemployment : 5.3%
Means of transportation to work in zip code 95621 71.7% 14,655 Drove a car alone8.3% 1,688 Carpooled0.5% 94 Bus or trolley bus0.1% 16 Railroad0.0% 9 Taxi0.8% 172 Motorcycle0.2% 45 Bicycle0.5% 98 Walked0.8% 159 Other means17.6% 3,603 Worked at homeTravel time to work (commute) in zip code 95621 164 Less than 5 minutes789 5 to 9 minutes1,813 10 to 14 minutes2,950 15 to 19 minutes3,105 20 to 24 minutes1,296 25 to 29 minutes3,484 30 to 34 minutes625 35 to 39 minutes563 40 to 44 minutes1,029 45 to 59 minutes564 60 to 89 minutes471 90 or more minutes
Neighborhoods in zip code 95621: Percentage of zip code residents living and working in this county: 74.1%
Household type by relationship:
Households: 41,739
Male householders: 7,202 (1,767 living alone ), Female householders: 9,308 (3,152 living alone )6,803 spouses (6,671 opposite-sex spouses ), 1,381 unmarried partners , (1,351 opposite-sex unmarried partners ), 11,143 children (10,473 natural , 409 adopted , 265 stepchildren ), 1,437 grandchildren , 852 brothers or sisters , 661 parents , 0 foster children , 934 other relatives , 1,831 non-relatives In group quarters: 299 (-1 institutionalized population )
Size of family households: 4,192 2-persons , 2,692 3-persons , 2,127 4-persons , 556 5-persons , 368 6-persons , 180 7-or-more-persons
Size of nonfamily households: 4,929 1-person , 1,185 2-persons , 201 3-persons , 79 4-persons , 28 5-persons
4,333 married couples with children. single-parent households (584 men , 1,974 women ).
78.4% of residents of 95621 zip code speak English at home. of residents speak Spanish at home (66% very well, 16% well, 12% not well, 7% not at all ).of residents speak other Indo-European language at home (45% very well, 33% well, 18% not well, 4% not at all ).of residents speak Asian or Pacific Island language at home (58% very well, 25% well, 15% not well, 2% not at all ).of residents speak other language at home (80% very well, 20% well ).
Foreign born population: 6,221 (14.9%)
(68.6%
of them are naturalized citizens )
This zip code:
14.9%Whole state:
26.7%
23% Honduras 20% Serbia 14% Malaysia 8% Romania 4% Nepal 4% Poland 3% Thailand 9% English 7% Irish 7% German 7% Ukrainian 4% American 4% Russian 3% Italian
Year of entry for the foreign-born population
1,348 2010 or later 1,723 2000 to 2009 1,587 1990 to 1999 1,907 Before 1990
There are
67 Medical Specialists in Zip Code 95621 .
Facilities with environmental interests located in this zip code:
EQUILON ENTERPRISES (6600 GREENBACK LN in CITRUS HEIGHTS, CA)
STATE MASTER (California - Hazardous Waste Tracking) - HAZARDOU WASTE PROGRAM HAZARDOUS WASTE BIENNIAL REPORTER (Resource Conservation and Recovery Act (tracking hazardous waste)) Small Quantity Generators, between 100 kg and 1000 kg of hazardous waste/month (Resource Conservation and Recovery Act (tracking hazardous waste)) - notification Organizations: EQUILON ENTERPRISES L L C (CONTACT/OWNER)
Alternative names: SHELL OIL CO
CARMICHAEL HONDA (6151 AUBURN BLVD in CITRUS HEIGHTS, CA)
STATE MASTER (California - Hazardous Waste Tracking) - HAZARDOU WASTE PROGRAM Small Quantity Generators, between 100 kg and 1000 kg of hazardous waste/month (Resource Conservation and Recovery Act (tracking hazardous waste)) - notification Organizations: CARMICHAEL HONDA INC (CONTACT/OWNER)
CHEVRON STATION 90102 (6151 GREENBACK LANE in CITRUS HEIGHTS, CA)
STATE MASTER (California - Hazardous Waste Tracking) - HAZARDOU WASTE PROGRAM Small Quantity Generators, between 100 kg and 1000 kg of hazardous waste/month (Resource Conservation and Recovery Act (tracking hazardous waste)) - notification Organizations: CHEVRON PRODUCTS CO (CONTACT/OWNER)
Alternative names: CHEVRON STATION #90102
GRAND OAKS ELEMENTARY (7901 ROSSWOOD DR. in CITRUS HEIGHTS, CA)
(National Center for Education Statistics) - STATE ID-6034573 Organizations: SAN JUAN UNIFIED (SCHOOL DISTRICT)
LICHEN ELEMENTARY (8319 LICHEN DR. in CITRUS HEIGHTS, CA)
(National Center for Education Statistics) - STATE ID-6034680 Organizations: SAN JUAN UNIFIED (SCHOOL DISTRICT)
MESA VERDE HIGH (7600 LAUPPE LANE in CITRUS HEIGHTS, CA)
(National Center for Education Statistics) - STATE ID-3430048 Organizations: SAN JUAN UNIFIED (SCHOOL DISTRICT)
CAMBRIDGE HEIGHTS ELEMENTARY (5555 FLEETWOOD DR. in CITRUS HEIGHTS, CA)
(National Center for Education Statistics) - STATE ID-6068670 Organizations: SAN JUAN UNIFIED (SCHOOL DISTRICT)
CARRIAGE DRIVE ELEMENTARY (7519 CARRIAGE DR. in CITRUS HEIGHTS, CA)
(National Center for Education Statistics) - STATE ID-6105910 Organizations: SAN JUAN UNIFIED (SCHOOL DISTRICT)
ENVIRONMENTAL CLEANUP (7220 KERSTEN ST in CITRUS HEIGHTS, CA)
TRANSPORTER (Resource Conservation and Recovery Act (tracking hazardous waste)) Organizations: PETER DISANDRA (CONTACT/OWNER)
LITTLES AUTOMOTIVE (5916 AUBURN BLVD in CITRUS HEIGHTS, CA)
Small Quantity Generators, between 100 kg and 1000 kg of hazardous waste/month (Resource Conservation and Recovery Act (tracking hazardous waste)) Organizations: GEORGE W LITTLE (CONTACT/OWNER)
CARCOA OF NORTHERN CA. INC. (6145 AUBURN BOULEVARD in CITRUS HEIGHTS, CA)
CRITERIA AND HAZARDOUS AIR POLLUTANT INVENTORY (Inventory of air pollution sources) Business SIC classification: TOP, BODY, AND UPHOLSTERY REPAIR SHOPS AND PAINT SHOPS
Housing units lacking complete plumbing facilities: 0.6%
Housing units lacking complete kitchen facilities: 1.2%
55.8% Utility gas 41.3% Electricity 0.8% Coal or coke 0.7% Bottled, tank, or LP gas 0.7% No fuel used
Population in 1990: 40,540. Population change in the 1990s: +1,089 (+2.7%).
Place of birth for U.S.-born residents:
This state: 28,588Northeast: 905Midwest: 2,061South: 1,674West: 1,864
46% of the 95621 zip code residents lived in the same house 5 years ago.
Out of people who lived in different houses, 64% lived in this county.
Out of people who lived in different counties, 50% lived in California.
91% of the 95621 zip code residents lived in the same house 1 year ago.
Out of people who lived in different houses, 61% moved from this county.
Out of people who lived in different houses, 24% moved from different county within same state.
Out of people who lived in different houses, 13% moved from different state.
Out of people who lived in different houses, 2% moved from abroad.
Private vs. public school enrollment:
Students in private schools in grades 1 to 8 (elementary and middle school): 505
Here:
15.0%California:
10.5%
Students in private schools in grades 9 to 12 (high school): 204
Here:
10.4%California:
8.5%
Students in private undergraduate colleges: 242
Here:
12.4%California:
15.9%
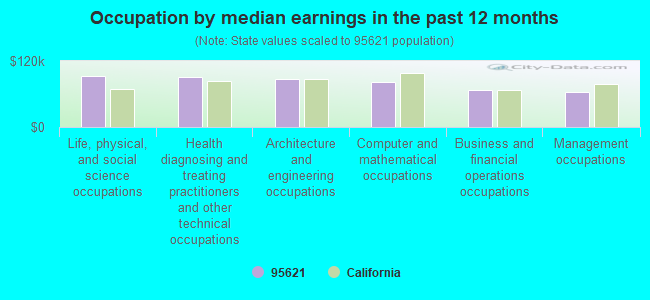
Occupation by median earnings in the past 12 months ($)
92,357 Life, physical, and social science occupations 91,505 Health diagnosing and treating practitioners and other technical occupations 86,504 Architecture and engineering occupations 82,621 Computer and mathematical occupations 67,988 Business and financial operations occupations 63,160 Management occupations
Companies with federal contracts located in this zip code:
DAVIS AND ASSOCIATES (6021 CENTURION CIR in CITRUS HEIGHTS, CA; small business) in 3 contracts from 2004 to 2005
$6,536 with Army for Other Education and Training Services. Taking place in AL. Signed on 2005-09-16. Completion date: 2006-01-27.
with Army for Other Education and Training Services. Signed on 2004-12-17. Completion date: 2005-01-28.
with U.S. Army Corps of Engineers - civil program financing only for Other Education and Training Services. Signed on 2004-12-17. Completion date: 2005-01-28.
HANNAN, JOHN (6600 VAN MAREN LN in CITRUS HEIGHTS, CA; small business) in 2 contracts in 2005
$10,950 with Air Force for Chaplain Services. Signed on 2005-01-07. Completion date: 2005-06-05.
, same as above. Signed on 2005-09-15. Completion date: 2005-06-05.
BLUE RIVER DIGITAL INC (6341 AUBURN BLVD #B in CITRUS HEIGHTS, CA; small business)
$8,109 with Air Force for Arts/Graphics Services. Taking place in DC. Signed on 2005-09-29. Completion date: 2005-10-29.
Top industries in this zip code by the number of employees in 2005:
Accommodation and Food Services: Limited-Service Restaurants (50-99 employees: 1 establishment, 20-49 employees: 6 establishments, 10-19 employees: 3 establishments, 1-4 employees: 2 establishments)Construction: Electrical Contractors (100-249: 1, 20-49: 1, 5-9: 2, 1-4: 5)Arts, Entertainment, and Recreation: Other Gambling Industries (100-249: 1)Educational Services: Exam Preparation and Tutoring (100-249: 1)Health Care and Social Assistance: Continuing Care Retirement Communities (50-99: 1, 20-49: 2)Arts, Entertainment, and Recreation: Fitness and Recreational Sports Centers (20-49: 3, 5-9: 1, 1-4: 1)
People in group quarters in 2010:
77 people in group homes intended for adults
13 people in residential treatment centers for adults
7 people in workers' group living quarters and job corps centers
6 people in residential treatment centers for juveniles (non-correctional)
5 people in other noninstitutional facilities
People in group quarters in 2000:
203 people in nursing homes
104 people in other noninstitutional group quarters
16 people in other nonhousehold living situations
12 people in residential treatment centers for emotionally disturbed children
8 people in religious group quarters
6 people in homes for the mentally retarded
6 people in other group homes
3 people in hospitals/wards and hospices for chronically ill
3 people in hospices or homes for chronically ill
2 people in homes or halfway houses for drug/alcohol abuse
Fatal accident statistics in 2014:
Fatal accident count: 2Vehicles involved in fatal accidents: 3Fatal accidents caused by drunken drivers: 0Fatalities: 2Persons involved in fatal accidents: 5Pedestrians involved in fatal accidents: 0
Fatal accident statistics in 2013:
Fatal accident count: 1Vehicles involved in fatal accidents: 1Fatal accidents caused by drunken drivers: 0Fatalities: 1Persons involved in fatal accidents: 1Pedestrians involved in fatal accidents: 0
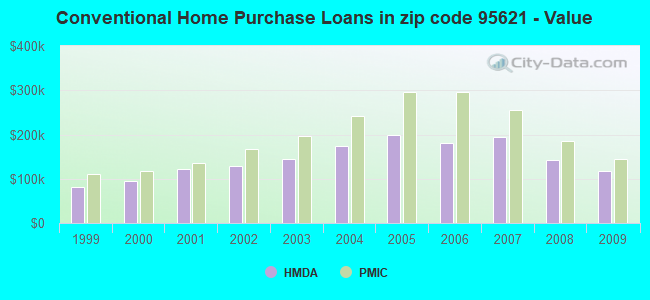
Home Mortgage Disclosure Act Aggregated Statistics For Year 2009(Based on 12 full and 8 partial tracts) A) FHA, FSA/RHS & VA B) Conventional C) Refinancings D) Home Improvement Loans E) Loans on Dwellings For 5+ Families F) Non-occupant Loans on G) Loans On Manufactured Number Average Value Number Average Value Number Average Value Number Average Value Number Average Value Number Average Value Number Average Value
LOANS ORIGINATED 579 $171,444 364 $118,228 727 $157,832 30 $95,965 2 $2,356,020 177 $110,474 12 $49,721 APPLICATIONS APPROVED, NOT ACCEPTED 52 $172,672 27 $129,614 79 $149,904 9 $36,202 0 $0 20 $116,742 1 $127,000 APPLICATIONS DENIED 110 $147,659 79 $122,418 339 $168,726 56 $42,363 2 $3,081,875 61 $94,828 17 $42,654 APPLICATIONS WITHDRAWN 88 $174,955 61 $116,710 252 $176,152 23 $119,806 1 $1,828,510 39 $105,173 0 $0 FILES CLOSED FOR INCOMPLETENESS 8 $201,595 12 $140,464 49 $175,003 0 $0 0 $0 7 $105,169 0 $0
Aggregated Statistics For Year 2008(Based on 12 full and 8 partial tracts) A) FHA, FSA/RHS & VA B) Conventional C) Refinancings D) Home Improvement Loans E) Loans on Dwellings For 5+ Families F) Non-occupant Loans on G) Loans On Manufactured Number Average Value Number Average Value Number Average Value Number Average Value Number Average Value Number Average Value Number Average Value
LOANS ORIGINATED 496 $187,385 568 $142,836 596 $163,908 94 $67,910 3 $3,188,553 269 $135,378 31 $61,081 APPLICATIONS APPROVED, NOT ACCEPTED 33 $197,968 94 $146,575 143 $190,674 29 $34,997 0 $0 43 $137,856 16 $60,539 APPLICATIONS DENIED 101 $188,465 153 $180,272 549 $209,582 129 $60,401 0 $0 71 $165,626 17 $41,890 APPLICATIONS WITHDRAWN 70 $180,092 116 $166,825 211 $209,042 20 $121,671 1 $319,730 62 $153,702 0 $0 FILES CLOSED FOR INCOMPLETENESS 10 $173,921 24 $205,366 56 $219,853 8 $84,956 0 $0 5 $181,822 0 $0
Aggregated Statistics For Year 2007(Based on 12 full and 8 partial tracts) A) FHA, FSA/RHS & VA B) Conventional C) Refinancings D) Home Improvement Loans E) Loans on Dwellings For 5+ Families F) Non-occupant Loans on G) Loans On Manufactured Number Average Value Number Average Value Number Average Value Number Average Value Number Average Value Number Average Value Number Average Value
LOANS ORIGINATED 44 $250,488 842 $193,347 1,552 $196,704 296 $92,007 8 $5,581,574 307 $189,636 32 $54,790 APPLICATIONS APPROVED, NOT ACCEPTED 3 $260,063 144 $166,553 363 $218,073 64 $80,339 0 $0 72 $205,970 13 $66,836 APPLICATIONS DENIED 1 $280,200 359 $225,235 1,384 $248,279 242 $99,154 0 $0 128 $222,509 30 $82,723 APPLICATIONS WITHDRAWN 5 $225,742 128 $195,471 573 $225,363 73 $132,530 1 $1,444,460 64 $191,216 1 $44,230 FILES CLOSED FOR INCOMPLETENESS 0 $0 35 $214,153 172 $251,306 12 $144,446 0 $0 27 $242,266 0 $0
Aggregated Statistics For Year 2006(Based on 12 full and 8 partial tracts) A) FHA, FSA/RHS & VA B) Conventional C) Refinancings D) Home Improvement Loans E) Loans on Dwellings For 5+ Families F) Non-occupant Loans on G) Loans On Manufactured Number Average Value Number Average Value Number Average Value Number Average Value Number Average Value Number Average Value Number Average Value
LOANS ORIGINATED 10 $266,754 1,490 $181,180 2,964 $204,412 498 $103,595 6 $8,747,292 423 $205,243 42 $90,485 APPLICATIONS APPROVED, NOT ACCEPTED 0 $0 291 $178,752 550 $223,487 86 $114,581 0 $0 92 $210,479 13 $88,358 APPLICATIONS DENIED 2 $265,530 516 $181,886 1,503 $222,571 305 $110,350 0 $0 157 $213,704 29 $88,558 APPLICATIONS WITHDRAWN 3 $292,730 243 $191,305 1,089 $237,452 114 $132,803 2 $75,520 87 $214,193 4 $67,312 FILES CLOSED FOR INCOMPLETENESS 3 $307,790 67 $181,320 271 $237,345 13 $155,762 0 $0 16 $224,298 1 $98,000
Aggregated Statistics For Year 2005(Based on 12 full and 8 partial tracts) A) FHA, FSA/RHS & VA B) Conventional C) Refinancings D) Home Improvement Loans E) Loans on Dwellings For 5+ Families F) Non-occupant Loans on G) Loans On Manufactured Number Average Value Number Average Value Number Average Value Number Average Value Number Average Value Number Average Value Number Average Value
LOANS ORIGINATED 21 $251,235 2,594 $198,669 4,439 $208,670 640 $121,175 5 $9,228,868 731 $218,999 48 $68,705 APPLICATIONS APPROVED, NOT ACCEPTED 1 $125,000 391 $208,164 624 $213,085 74 $152,340 0 $0 72 $216,752 17 $66,574 APPLICATIONS DENIED 3 $168,667 580 $200,892 1,446 $224,455 313 $118,664 0 $0 167 $228,327 43 $62,785 APPLICATIONS WITHDRAWN 1 $455,330 480 $205,261 1,317 $216,867 166 $148,042 1 $33,818,800 142 $218,108 11 $119,773 FILES CLOSED FOR INCOMPLETENESS 0 $0 92 $193,263 440 $225,315 17 $149,390 0 $0 24 $201,880 2 $219,610
Aggregated Statistics For Year 2004(Based on 12 full and 8 partial tracts) A) FHA, FSA/RHS & VA B) Conventional C) Refinancings D) Home Improvement Loans E) Loans on Dwellings For 5+ Families F) Non-occupant Loans on G) Loans On Manufactured Number Average Value Number Average Value Number Average Value Number Average Value Number Average Value Number Average Value Number Average Value
LOANS ORIGINATED 57 $223,698 2,583 $173,585 4,641 $174,218 566 $102,261 7 $6,339,006 768 $184,222 69 $59,228 APPLICATIONS APPROVED, NOT ACCEPTED 6 $188,073 334 $163,126 630 $172,394 74 $115,915 0 $0 90 $154,099 31 $66,614 APPLICATIONS DENIED 15 $243,521 590 $171,178 1,442 $178,269 303 $91,492 0 $0 163 $189,800 45 $56,462 APPLICATIONS WITHDRAWN 20 $182,464 346 $198,369 1,135 $183,874 133 $102,126 0 $0 91 $195,764 2 $8,915 FILES CLOSED FOR INCOMPLETENESS 4 $204,702 72 $188,766 478 $183,930 34 $66,031 0 $0 31 $146,798 0 $0
Aggregated Statistics For Year 2003(Based on 12 full and 8 partial tracts) A) FHA, FSA/RHS & VA B) Conventional C) Refinancings D) Home Improvement Loans E) Loans on Dwellings For 5+ Families F) Non-occupant Loans on Number Average Value Number Average Value Number Average Value Number Average Value Number Average Value Number Average Value
LOANS ORIGINATED 398 $186,328 1,848 $144,382 6,473 $138,727 286 $38,675 5 $1,644,064 747 $144,914 APPLICATIONS APPROVED, NOT ACCEPTED 23 $169,516 232 $139,719 834 $139,095 68 $53,536 0 $0 82 $152,278 APPLICATIONS DENIED 43 $181,037 341 $141,569 1,783 $148,117 248 $32,041 1 $1,604,960 174 $157,386 APPLICATIONS WITHDRAWN 64 $157,608 258 $144,885 1,554 $147,600 52 $45,089 2 $2,011,550 81 $137,713 FILES CLOSED FOR INCOMPLETENESS 6 $176,878 25 $153,521 223 $152,040 16 $38,194 0 $0 25 $148,965
Aggregated Statistics For Year 2002(Based on 4 full and 2 partial tracts) A) FHA, FSA/RHS & VA B) Conventional C) Refinancings D) Home Improvement Loans E) Loans on Dwellings For 5+ Families F) Non-occupant Loans on Number Average Value Number Average Value Number Average Value Number Average Value Number Average Value Number Average Value
LOANS ORIGINATED 237 $157,316 551 $128,605 2,136 $126,361 135 $33,461 0 $0 196 $121,509 APPLICATIONS APPROVED, NOT ACCEPTED 7 $104,863 36 $112,882 307 $127,038 27 $26,802 0 $0 18 $103,533 APPLICATIONS DENIED 26 $166,551 85 $126,043 537 $123,322 88 $28,445 0 $0 16 $115,360 APPLICATIONS WITHDRAWN 27 $127,222 77 $108,556 491 $132,054 28 $27,996 2 $1,499,495 31 $133,169 FILES CLOSED FOR INCOMPLETENESS 2 $89,000 23 $124,833 83 $126,019 2 $25,000 2 $1,515,395 9 $108,020
Aggregated Statistics For Year 2001(Based on 4 full and 2 partial tracts) A) FHA, FSA/RHS & VA B) Conventional C) Refinancings D) Home Improvement Loans E) Loans on Dwellings For 5+ Families F) Non-occupant Loans on Number Average Value Number Average Value Number Average Value Number Average Value Number Average Value Number Average Value
LOANS ORIGINATED 360 $136,809 603 $122,963 1,561 $110,526 69 $31,894 1 $7,114,570 152 $105,767 APPLICATIONS APPROVED, NOT ACCEPTED 18 $116,459 73 $115,099 197 $100,014 13 $24,439 0 $0 15 $87,551 APPLICATIONS DENIED 31 $139,672 99 $101,636 473 $98,979 47 $22,583 0 $0 28 $91,085 APPLICATIONS WITHDRAWN 25 $141,479 138 $139,340 466 $106,642 27 $23,794 0 $0 17 $68,331 FILES CLOSED FOR INCOMPLETENESS 9 $167,988 9 $106,790 79 $111,548 0 $0 0 $0 0 $0
Aggregated Statistics For Year 2000(Based on 4 full and 2 partial tracts) A) FHA, FSA/RHS & VA B) Conventional C) Refinancings D) Home Improvement Loans E) Loans on Dwellings For 5+ Families F) Non-occupant Loans on Number Average Value Number Average Value Number Average Value Number Average Value Number Average Value Number Average Value
LOANS ORIGINATED 455 $118,639 449 $95,592 313 $78,697 79 $24,964 0 $0 68 $87,852 APPLICATIONS APPROVED, NOT ACCEPTED 25 $103,921 52 $110,709 77 $90,681 46 $29,537 0 $0 4 $70,000 APPLICATIONS DENIED 32 $127,743 99 $89,477 259 $79,581 97 $22,798 1 $175,130 19 $77,246 APPLICATIONS WITHDRAWN 54 $132,328 109 $122,836 104 $65,272 10 $49,510 0 $0 3 $48,000 FILES CLOSED FOR INCOMPLETENESS 2 $156,000 14 $96,568 41 $91,657 8 $20,711 0 $0 2 $90,000
Aggregated Statistics For Year 1999(Based on 2 full and 6 partial tracts) A) FHA, FSA/RHS & VA B) Conventional C) Refinancings D) Home Improvement Loans E) Loans on Dwellings For 5+ Families F) Non-occupant Loans on Number Average Value Number Average Value Number Average Value Number Average Value Number Average Value Number Average Value
LOANS ORIGINATED 422 $111,175 412 $81,827 656 $85,742 95 $21,769 12 $1,732,592 134 $81,861 APPLICATIONS APPROVED, NOT ACCEPTED 20 $116,727 33 $94,162 128 $93,445 65 $18,096 1 $93,650 11 $76,991 APPLICATIONS DENIED 46 $114,779 88 $80,680 372 $73,644 105 $20,831 2 $427,115 38 $84,466 APPLICATIONS WITHDRAWN 44 $116,007 77 $94,804 238 $81,640 9 $13,427 3 $111,480 22 $73,075 FILES CLOSED FOR INCOMPLETENESS 0 $0 7 $87,719 79 $102,284 3 $24,303 2 $698,055 4 $92,038
Private Mortgage Insurance Companies Aggregated Statistics For Year 2009(Based on 10 full and 8 partial tracts) A) Conventional B) Refinancings C) Non-occupant Loans on Number Average Value Number Average Value Number Average Value
LOANS ORIGINATED 50 $143,575 4 $197,468 2 $123,000 APPLICATIONS APPROVED, NOT ACCEPTED 12 $206,160 5 $224,574 0 $0 APPLICATIONS DENIED 8 $179,198 2 $239,000 0 $0 APPLICATIONS WITHDRAWN 0 $0 0 $0 0 $0 FILES CLOSED FOR INCOMPLETENESS 0 $0 0 $0 0 $0
Aggregated Statistics For Year 2008(Based on 12 full and 8 partial tracts) A) Conventional B) Refinancings C) Non-occupant Loans on Number Average Value Number Average Value Number Average Value
LOANS ORIGINATED 166 $185,563 64 $237,452 15 $185,967 APPLICATIONS APPROVED, NOT ACCEPTED 74 $229,172 51 $262,048 7 $151,509 APPLICATIONS DENIED 19 $146,957 6 $264,938 7 $175,039 APPLICATIONS WITHDRAWN 1 $205,210 3 $295,973 0 $0 FILES CLOSED FOR INCOMPLETENESS 2 $162,000 2 $254,385 2 $254,385
Aggregated Statistics For Year 2007(Based on 12 full and 8 partial tracts) A) Conventional B) Refinancings C) Non-occupant Loans on Number Average Value Number Average Value Number Average Value
LOANS ORIGINATED 209 $255,604 116 $283,103 23 $227,868 APPLICATIONS APPROVED, NOT ACCEPTED 18 $291,763 26 $287,914 0 $0 APPLICATIONS DENIED 7 $291,923 5 $307,360 1 $465,310 APPLICATIONS WITHDRAWN 5 $235,714 11 $246,047 1 $228,510 FILES CLOSED FOR INCOMPLETENESS 2 $274,750 0 $0 0 $0
Aggregated Statistics For Year 2006(Based on 10 full and 8 partial tracts) A) Conventional B) Refinancings C) Non-occupant Loans on Number Average Value Number Average Value Number Average Value
LOANS ORIGINATED 41 $295,703 66 $306,809 5 $287,532 APPLICATIONS APPROVED, NOT ACCEPTED 1 $252,000 17 $279,564 0 $0 APPLICATIONS DENIED 1 $525,380 3 $216,963 0 $0 APPLICATIONS WITHDRAWN 2 $268,000 9 $307,066 0 $0 FILES CLOSED FOR INCOMPLETENESS 2 $314,000 0 $0 0 $0
Aggregated Statistics For Year 2005(Based on 12 full and 8 partial tracts) A) Conventional B) Refinancings C) Non-occupant Loans on Number Average Value Number Average Value Number Average Value
LOANS ORIGINATED 82 $295,565 77 $279,108 13 $273,185 APPLICATIONS APPROVED, NOT ACCEPTED 17 $306,108 19 $265,862 2 $204,700 APPLICATIONS DENIED 4 $324,188 6 $296,577 2 $324,190 APPLICATIONS WITHDRAWN 5 $215,002 7 $276,131 3 $290,727 FILES CLOSED FOR INCOMPLETENESS 2 $203,710 1 $363,390 1 $363,390
Aggregated Statistics For Year 2004(Based on 12 full and 8 partial tracts) A) Conventional B) Refinancings C) Non-occupant Loans on Number Average Value Number Average Value Number Average Value
LOANS ORIGINATED 108 $240,855 120 $217,246 36 $231,398 APPLICATIONS APPROVED, NOT ACCEPTED 42 $234,222 66 $198,524 6 $251,105 APPLICATIONS DENIED 1 $131,000 1 $182,000 1 $131,000 APPLICATIONS WITHDRAWN 11 $217,624 10 $196,691 4 $197,875 FILES CLOSED FOR INCOMPLETENESS 0 $0 0 $0 0 $0
Aggregated Statistics For Year 2003(Based on 12 full and 8 partial tracts) A) Conventional B) Refinancings C) Non-occupant Loans on Number Average Value Number Average Value Number Average Value
LOANS ORIGINATED 273 $197,330 288 $175,677 43 $171,749 APPLICATIONS APPROVED, NOT ACCEPTED 45 $198,282 117 $174,866 9 $211,684 APPLICATIONS DENIED 1 $126,000 5 $186,434 0 $0 APPLICATIONS WITHDRAWN 10 $184,840 10 $180,590 2 $158,765 FILES CLOSED FOR INCOMPLETENESS 1 $226,660 1 $112,000 0 $0
Aggregated Statistics For Year 2002(Based on 4 full and 2 partial tracts) A) Conventional B) Refinancings C) Non-occupant Loans on Number Average Value Number Average Value Number Average Value
LOANS ORIGINATED 156 $166,700 129 $158,757 17 $165,795 APPLICATIONS APPROVED, NOT ACCEPTED 15 $144,828 32 $150,826 4 $162,500 APPLICATIONS DENIED 6 $126,742 9 $163,219 4 $125,520 APPLICATIONS WITHDRAWN 5 $147,418 17 $159,888 4 $129,180 FILES CLOSED FOR INCOMPLETENESS 0 $0 0 $0 0 $0
Aggregated Statistics For Year 2001(Based on 4 full and 2 partial tracts) A) Conventional B) Refinancings C) Non-occupant Loans on Number Average Value Number Average Value Number Average Value
LOANS ORIGINATED 148 $135,805 142 $139,844 15 $121,882 APPLICATIONS APPROVED, NOT ACCEPTED 14 $129,776 14 $148,100 6 $150,378 APPLICATIONS DENIED 1 $283,120 3 $165,887 3 $187,777 APPLICATIONS WITHDRAWN 3 $165,763 5 $152,106 0 $0 FILES CLOSED FOR INCOMPLETENESS 1 $169,290 0 $0 1 $169,290
Aggregated Statistics For Year 2000(Based on 4 full and 2 partial tracts) A) Conventional B) Refinancings C) Non-occupant Loans on Number Average Value Number Average Value Number Average Value
LOANS ORIGINATED 96 $117,195 34 $108,659 16 $105,146 APPLICATIONS APPROVED, NOT ACCEPTED 6 $131,812 7 $124,673 0 $0 APPLICATIONS DENIED 1 $169,290 1 $170,750 1 $169,290 APPLICATIONS WITHDRAWN 0 $0 0 $0 0 $0 FILES CLOSED FOR INCOMPLETENESS 0 $0 0 $0 0 $0
Aggregated Statistics For Year 1999(Based on 2 full and 6 partial tracts) A) Conventional B) Refinancings C) Non-occupant Loans on Number Average Value Number Average Value Number Average Value
LOANS ORIGINATED 96 $110,984 93 $112,748 14 $82,731 APPLICATIONS APPROVED, NOT ACCEPTED 9 $111,727 15 $114,051 2 $48,595 APPLICATIONS DENIED 7 $90,563 5 $96,958 0 $0 APPLICATIONS WITHDRAWN 4 $86,150 4 $102,668 0 $0 FILES CLOSED FOR INCOMPLETENESS 4 $87,650 3 $95,013 0 $0
Most common first names in zip code 95621 among deceased individuals Name Count Lived (average)
John 134 75.7 years William 125 75.5 years Robert 119 72.4 years Mary 109 78.9 years James 100 74.3 years Charles 92 75.3 years Helen 77 82.3 years Dorothy 74 81.5 years Richard 71 69.3 years Joseph 61 79.4 years
Most common last names in zip code 95621 among deceased individuals Last name Count Lived (average)
Smith 45 76.8 years Johnson 35 74.4 years Williams 33 76.0 years Brown 32 78.3 years Davis 29 76.6 years Miller 29 79.5 years Wilson 24 71.7 years Jones 23 77.4 years Moore 20 73.6 years Anderson 19 80.7 years
Businesses in zip code 95621
Name Count Name Count
24 Hour Fitness 1 Payless 1 7-Eleven 3 Popeyes 1 Baskin-Robbins 1 Rite Aid 1 Blockbuster 1 SAS Shoes 1 Carl\s Jr. 1 Safeway 1 Costco 1 Sam's Club 1 Dairy Queen 1 Sprint Nextel 1 FedEx 2 Subway 3 GNC 1 T-Mobile 2 H&R Block 1 Taco Bell 1 Honda 1 U-Haul 1 Hot Topic 1 UPS 1 Jones New York 1 Vons 1 KFC 1 Walmart 1 Little Caesars Pizza 1 Wendy's 1 McDonald's 2

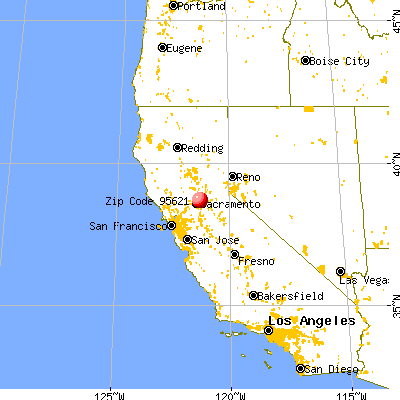


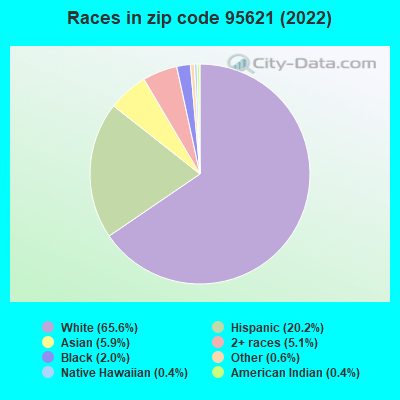


 Nearest zip codes: 95610, 95842, 95841, 95843, 95628, 95678.
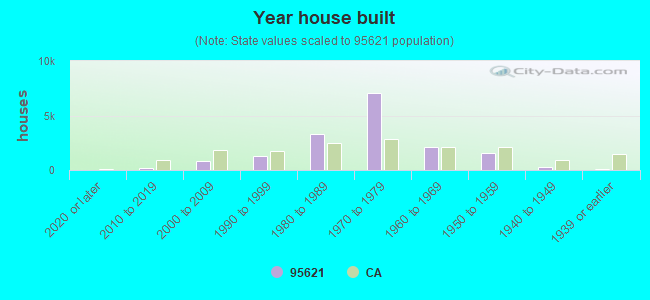
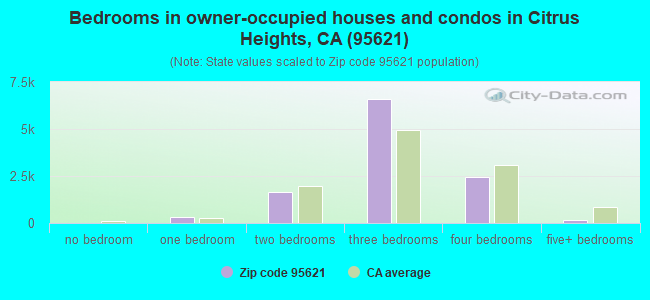
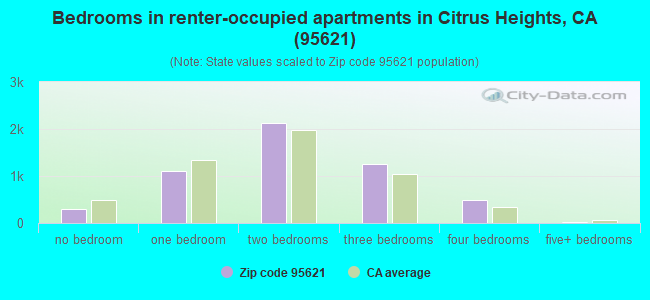
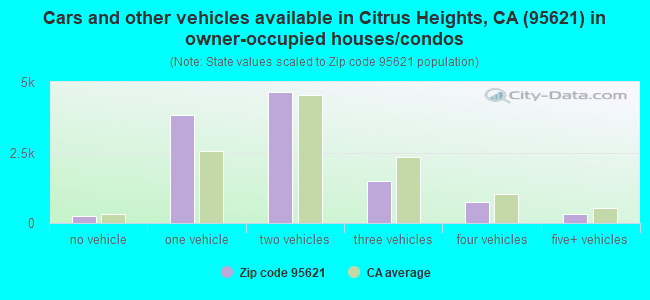
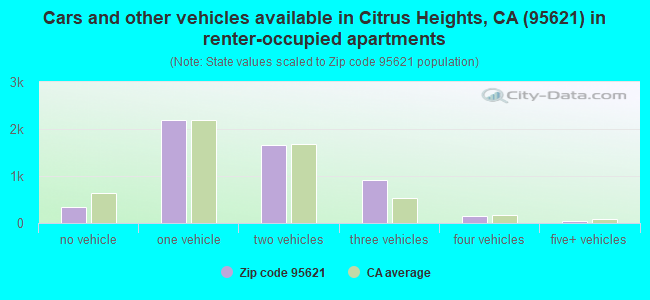


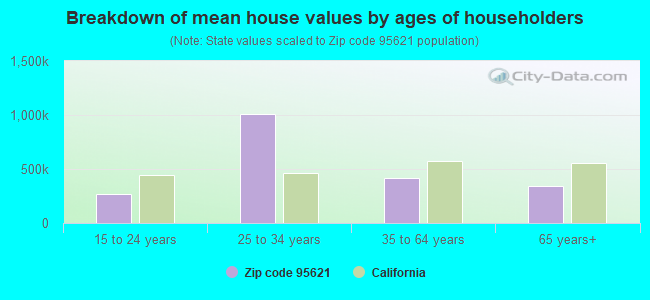


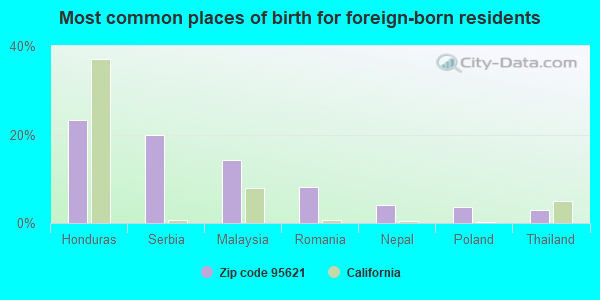
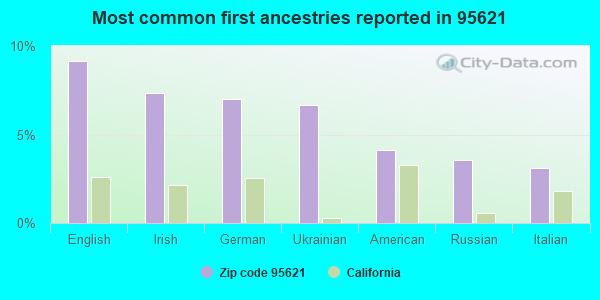
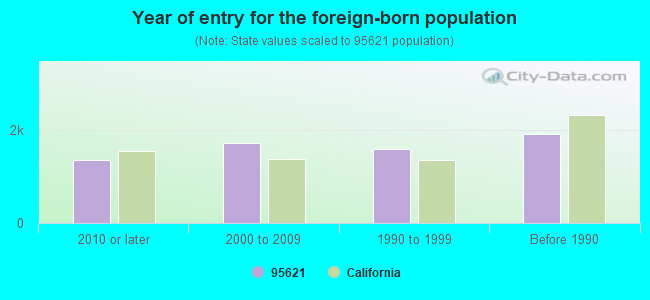
 . Federal Facility