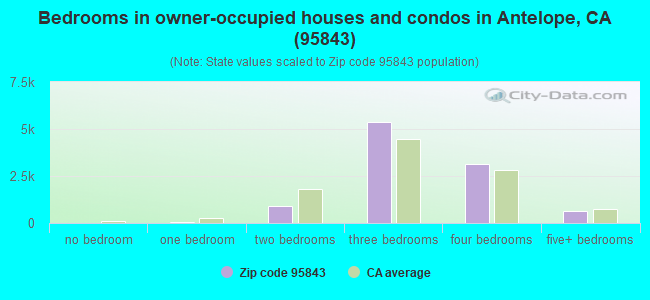
Estimated zip code population in 2022: 46,803 Zip code population in 2010: 45,048 Zip code population in 2000: 36,421
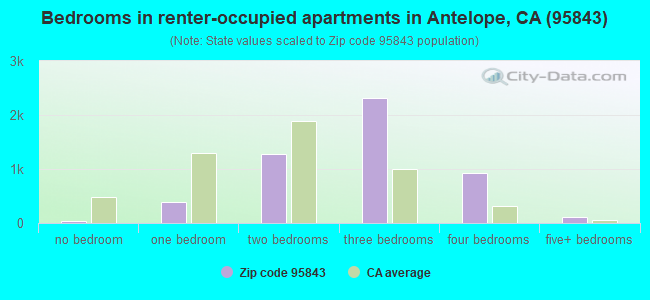
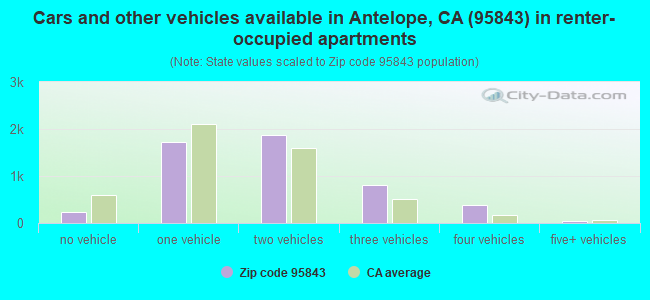
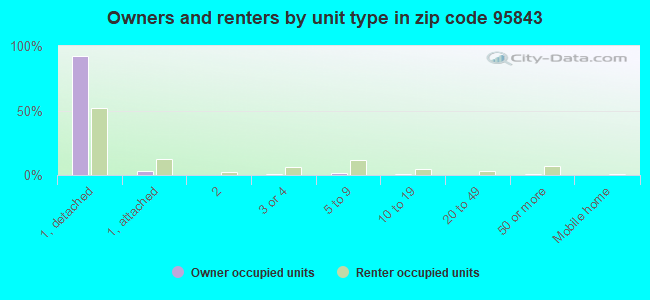
Houses and condos: 15,413 Renter-occupied apartments: 5,069
% of renters here:
33%
State:
44%
March 2022 cost of living index in zip code 95843: 101.5 (near average, U.S. average is 100)
Land area: 6.4 sq. mi. Water area: 0.0 sq. mi.
Population density: 7,258 people per square mile
(high).
OSM Map
General Map
Google Map
MSN Map
OSM Map
General Map
Google Map
MSN Map
OSM Map
General Map
Google Map
MSN Map
OSM Map
General Map
Google Map
MSN Map
Please wait while loading the map...
Real estate property taxes paid for housing units in 2022:
This zip code:
0.8% ($3,523)
California:
0.7% ($4,831)
Median real estate property taxes paid for housing units with mortgages in 2022: $3,628 (0.8%) Median real estate property taxes paid for housing units with no mortgage in 2022: $3,231 (0.7%)
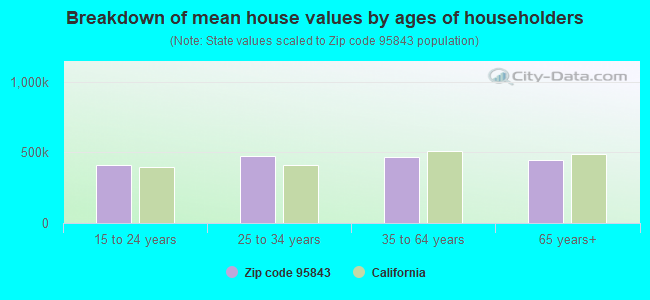
Estimated median house/condo value in 2022: $469,412
95843:
$469,412
California:
$715,900
According to our research of California and other state lists, there were 33 registered sex offenders living in 95843 zip code as of May 28, 2024. The ratio of all residents to sex offenders in zip code 95843 is 1,465 to 1. The ratio of registered sex offenders to all residents in this zip code is lower than the state average.
Median resident age:
This zip code:
36.3 years
California median age:
37.9 years
Average household size:
This zip code:
3.1 people
California:
2.8 people
Averages for the 2020 tax year for zip code 95843, filed in 2021:
Average Adjusted Gross Income (AGI) in 2020: $59,576 (Individual Income Tax Returns)
Here:
$59,576
State:
$95,910
Salary/wage: $54,888 (reported on 84.1% of returns)
Here:
$54,888
State:
$77,331
(% of AGI for various income ranges: 1212.1% for AGIs below $25k, 3804.6% for AGIs $25k-50k, 7353.9% for AGIs $50k-75k, 11000.0% for AGIs $75k-100k, 21116.6% for AGIs $100k-200k, 67657.7% for AGIs over 200k)
Taxable interest for individuals: $339 (reported on 34.4% of returns)
This zip code:
$339
California:
$2,294
(% of AGI for various income ranges: 6.4% for AGIs below $25k, 7.8% for AGIs $25k-50k, 18.3% for AGIs $50k-75k, 28.7% for AGIs $75k-100k, 44.7% for AGIs $100k-200k, 221.5% for AGIs over 200k)
Ordinary dividends: $1,454 (reported on 10.2% of returns)
Here:
$1,454
State:
$10,949
(% of AGI for various income ranges: 6.2% for AGIs below $25k, 7.1% for AGIs $25k-50k, 19.8% for AGIs $50k-75k, 33.2% for AGIs $75k-100k, 70.4% for AGIs $100k-200k, 357.7% for AGIs over 200k)
Net capital gain/loss in AGI: +$6,523 (reported on 10.8% of returns)
Here:
+$6,523
State:
+$49,306
(% of AGI for various income ranges: 3.6% for AGIs below $25k, 12.0% for AGIs $25k-50k, 37.9% for AGIs $50k-75k, 60.3% for AGIs $75k-100k, 235.6% for AGIs $100k-200k, 6910.8% for AGIs over 200k)
Profit/loss from business: +$13,498 (reported on 19.6% of returns)
Here:
+$13,498
State:
+$15,671
(% of AGI for various income ranges: 180.4% for AGIs below $25k, 404.8% for AGIs $25k-50k, 565.7% for AGIs $50k-75k, 449.0% for AGIs $75k-100k, 514.8% for AGIs $100k-200k, 3062.3% for AGIs over 200k)
Taxable individual retirement arrangement distribution: $13,371 (reported on 4.3% of returns)
95843:
$13,371
California:
$23,505
(% of AGI for various income ranges: 30.0% for AGIs below $25k, 47.2% for AGIs $25k-50k, 88.0% for AGIs $50k-75k, 155.4% for AGIs $75k-100k, 229.7% for AGIs $100k-200k, 561.5% for AGIs over 200k)
Self-employed (Keogh) retirement plans: $14,467 (reported on 0.1% of returns)
95843:
$14,467
California:
$30,163
(% of AGI for various income ranges: 17.6% for AGIs $50k-75k)
Total itemized deductions: $27,360 (reported on 11.5% of returns)
Here:
$27,360
State:
$39,517
(% of AGI for various income ranges: 40.0% for AGIs below $25k, 153.2% for AGIs $25k-50k, 475.7% for AGIs $50k-75k, 884.1% for AGIs $75k-100k, 1540.8% for AGIs $100k-200k, 6743.8% for AGIs over 200k)
Charity contributions: $5,636 (reported on 9.0% of returns)
Here:
$5,636
State:
$12,598
(% of AGI for various income ranges: 3.4% for AGIs below $25k, 16.1% for AGIs $25k-50k, 57.8% for AGIs $50k-75k, 113.1% for AGIs $75k-100k, 314.4% for AGIs $100k-200k, 1326.9% for AGIs over 200k)
Taxes paid: $8,175 (reported on 11.4% of returns)
95843:
$8,175
State:
$8,807
(% of AGI for various income ranges: 8.8% for AGIs below $25k, 37.6% for AGIs $25k-50k, 144.4% for AGIs $50k-75k, 287.5% for AGIs $75k-100k, 497.2% for AGIs $100k-200k, 1493.8% for AGIs over 200k)
Earned income credit: $2,211 (reported on 15.8% of returns)
Here:
$2,211
State:
$2,074
(% of AGI for various income ranges: 94.7% for AGIs below $25k, 83.5% for AGIs $25k-50k, 1.7% for AGIs $50k-75k)
Percentage of individuals using paid preparers for their 2020 taxes: 93.4%
Here:
93%
State:
92%
(% for various income ranges: 93.0% for AGIs below $25k, 94.2% for AGIs $25k-50k, 93.8% for AGIs $50k-75k, 92.3% for AGIs $75k-100k, 93.4% for AGIs $100k-200k, 93.6% for AGIs over 200k)
Averages for the 2012 tax year for zip code 95843, filed in 2013:
Average Adjusted Gross Income (AGI) in 2012: $49,246 (Individual Income Tax Returns)
Here:
$49,246
State:
$72,726
Salary/wage: $46,452 (reported on 86.9% of returns)
Here:
$46,452
State:
$59,079
(% of AGI for various income ranges: 73.3% for AGIs below $25k, 80.0% for AGIs $25k-50k, 83.8% for AGIs $50k-75k, 83.3% for AGIs $75k-100k, 86.1% for AGIs $100k-200k, 64.1% for AGIs over 200k)
Taxable interest for individuals: $297 (reported on 36.3% of returns)
This zip code:
$297
California:
$2,146
(% of AGI for various income ranges: 0.4% for AGIs below $25k, 0.3% for AGIs $25k-50k, 0.2% for AGIs $50k-75k, 0.2% for AGIs $75k-100k, 0.1% for AGIs $100k-200k, 0.2% for AGIs over 200k)
Ordinary dividends: $1,055 (reported on 9.9% of returns)
Here:
$1,055
State:
$9,308
(% of AGI for various income ranges: 0.4% for AGIs below $25k, 0.1% for AGIs $25k-50k, 0.2% for AGIs $50k-75k, 0.2% for AGIs $75k-100k, 0.2% for AGIs $100k-200k, 0.4% for AGIs over 200k)
Net capital gain/loss in AGI: +$1,771 (reported on 7.4% of returns)
Here:
+$1,771
State:
+$30,460
(% of AGI for various income ranges: 0.1% for AGIs $50k-75k, 0.1% for AGIs $75k-100k, 0.3% for AGIs $100k-200k, 3.9% for AGIs over 200k)
Profit/loss from business: +$11,427 (reported on 19.0% of returns)
Here:
+$11,427
State:
+$17,064
(% of AGI for various income ranges: 14.2% for AGIs below $25k, 7.9% for AGIs $25k-50k, 3.0% for AGIs $50k-75k, 1.9% for AGIs $75k-100k, 2.0% for AGIs $100k-200k, 1.2% for AGIs over 200k)
Taxable individual retirement arrangement distribution: $11,928 (reported on 4.9% of returns)
95843:
$11,928
California:
$19,557
(% of AGI for various income ranges: 1.5% for AGIs below $25k, 1.1% for AGIs $25k-50k, 1.0% for AGIs $50k-75k, 1.5% for AGIs $75k-100k, 1.3% for AGIs $100k-200k)
Self-employment retirement plans: $11,400 (reported on 0.2% of returns)
95843:
$11,400
California:
$24,530
Total itemized deductions: $20,580 (26% of AGI, reported on 37.9% of returns)
Here:
$20,580
State:
$34,004
Here:
25.8% of AGI
State:
22.7% of AGI
(% of AGI for various income ranges: 9.0% for AGIs below $25k, 13.0% for AGIs $25k-50k, 15.9% for AGIs $50k-75k, 18.2% for AGIs $75k-100k, 18.1% for AGIs $100k-200k, 18.2% for AGIs over 200k)
Charity contributions: $2,639 (reported on 31.4% of returns)
Here:
$2,639
State:
$4,659
(% of AGI for various income ranges: 0.6% for AGIs below $25k, 1.2% for AGIs $25k-50k, 1.6% for AGIs $50k-75k, 2.0% for AGIs $75k-100k, 2.2% for AGIs $100k-200k, 1.5% for AGIs over 200k)
Taxes paid: $6,304 (reported on 37.8% of returns)
95843:
$6,304
State:
$14,448
(% of AGI for various income ranges: 1.7% for AGIs below $25k, 3.0% for AGIs $25k-50k, 4.5% for AGIs $50k-75k, 5.3% for AGIs $75k-100k, 6.7% for AGIs $100k-200k, 7.8% for AGIs over 200k)
Earned income credit: $2,396 (reported on 21.5% of returns)
Here:
$2,396
State:
$2,286
(% of AGI for various income ranges: 7.9% for AGIs below $25k, 1.7% for AGIs $25k-50k)
Percentage of individuals using paid preparers for their 2012 taxes: 53.2%
Here:
53%
State:
64%
(% for various income ranges: 52.1% for AGIs below $25k, 55.0% for AGIs $25k-50k, 53.3% for AGIs $50k-75k, 52.8% for AGIs $75k-100k, 52.2% for AGIs $100k-200k, 72.7% for AGIs over 200k)
Averages for the 2004 tax year for zip code 95843, filed in 2005:
Average Adjusted Gross Income (AGI) in 2004: $46,021 (Individual Income Tax Returns)
Here:
$46,021
State:
$58,600
Salary/wage: $44,260 (reported on 91.1% of returns)
Here:
$44,260
State:
$49,455
(% of AGI for various income ranges: 105.3% for AGIs below $10k, 81.5% for AGIs $10k-25k, 87.2% for AGIs $25k-50k, 90.3% for AGIs $50k-75k, 91.2% for AGIs $75k-100k, 82.5% for AGIs over 100k)
Taxable interest for individuals: $455 (reported on 47.3% of returns)
This zip code:
$455
California:
$2,365
(% of AGI for various income ranges: 1.6% for AGIs below $10k, 0.7% for AGIs $10k-25k, 0.4% for AGIs $25k-50k, 0.5% for AGIs $50k-75k, 0.3% for AGIs $75k-100k, 0.5% for AGIs over 100k)
Taxable dividends: $800 (reported on 14.0% of returns)
Here:
$800
State:
$4,746
(% of AGI for various income ranges: 0.8% for AGIs below $10k, 0.4% for AGIs $10k-25k, 0.3% for AGIs $25k-50k, 0.2% for AGIs $50k-75k, 0.2% for AGIs $75k-100k, 0.3% for AGIs over 100k)
Net capital gain/loss: +$5,860 (reported on 10.8% of returns)
Here:
+$5,860
State:
+$23,418
(% of AGI for various income ranges: -0.2% for AGIs below $10k, 0.1% for AGIs $10k-25k, 0.3% for AGIs $25k-50k, 0.3% for AGIs $50k-75k, 0.7% for AGIs $75k-100k, 4.7% for AGIs over 100k)
Profit/loss from business: +$8,438 (reported on 17.2% of returns)
Here:
+$8,438
State:
+$16,826
(% of AGI for various income ranges: 7.5% for AGIs below $10k, 8.8% for AGIs $10k-25k, 3.5% for AGIs $25k-50k, 2.1% for AGIs $50k-75k, 1.9% for AGIs $75k-100k, 3.0% for AGIs over 100k)
IRA payment deduction: $2,486 (reported on 2.0% of returns)
95843:
$2,486
California:
$3,192
(% of AGI for various income ranges: 0.2% for AGIs below $10k, 0.1% for AGIs $10k-25k, 0.2% for AGIs $25k-50k, 0.1% for AGIs $50k-75k, 0.1% for AGIs $75k-100k, 0.1% for AGIs over 100k)
Self-employed pension: $8,562 (reported on 0.4% of returns)
Here:
$8,562
California:
$17,688
(% of AGI for various income ranges: 0.1% for AGIs $25k-50k, 0.1% for AGIs $50k-75k, 0.0% for AGIs $75k-100k, 0.2% for AGIs over 100k)
Total itemized deductions: $20,886 (31% of AGI, reported on 49.9% of returns)
Here:
$20,886
State:
$28,113
Here:
30.6% of AGI
State:
25.3% of AGI
(% of AGI for various income ranges: 17.8% for AGIs below $10k, 15.8% for AGIs $10k-25k, 21.3% for AGIs $25k-50k, 25.9% for AGIs $50k-75k, 24.2% for AGIs $75k-100k, 21.5% for AGIs over 100k)
Charity contributions deductions: $2,363 (3% of AGI, reported on 44.3% of returns)
Here:
$2,363
State:
$3,923
Here:
3.3% of AGI
State:
3.3% of AGI
(% of AGI for various income ranges: 0.8% for AGIs below $10k, 1.1% for AGIs $10k-25k, 1.9% for AGIs $25k-50k, 2.5% for AGIs $50k-75k, 2.5% for AGIs $75k-100k, 2.6% for AGIs over 100k)
Total tax: $4,871 (reported on 78.3% of returns)
95843:
$4,871
State:
$10,761
(% of AGI for various income ranges: 3.7% for AGIs below $10k, 4.7% for AGIs $10k-25k, 5.9% for AGIs $25k-50k, 7.1% for AGIs $50k-75k, 8.5% for AGIs $75k-100k, 13.0% for AGIs over 100k)
Earned income credit: $1,831 (reported on 14.8% of returns)
Here:
$1,831
State:
$1,763
Percentage of individuals using paid preparers for their 2004 taxes: 56.9%
Here:
57%
State:
66%
(% for various income ranges: 48.4% for AGIs below $10k, 58.1% for AGIs $10k-25k, 59.2% for AGIs $25k-50k, 57.6% for AGIs $50k-75k, 56.7% for AGIs $75k-100k, 59.9% for AGIs over 100k)
Likely homosexual households (counted as self-reported same-sex unmarried-partner households)
Lesbian couples: 0.3% of all households
Gay men: 0.1% of all households
Household received Food Stamps/SNAP in the past 12 months: 2,299 Household did not receive Food Stamps/SNAP in the past 12 months: 13,014
Women who had a birth in the past 12 months: 501 (362 now married, 139 unmarried) Women who did not have a birth in the past 12 months: 11,041 (4,686 now married, 6,342 unmarried)
Housing units in zip code 95843 with a mortgage: 7,718 (684 second mortgage, 583 both second mortgage and home equity loan) Houses without a mortgage: 10
Median monthly owner costs for units with a mortgage: $2,085 Median monthly owner costs for units without a mortgage: $662
Residents with income below the poverty level in 2022:
This zip code:
10.3%
Whole state:
12.2%
Residents with income below 50% of the poverty level in 2022:
This zip code:
5.8%
Whole state:
6.2%
Median number of rooms in houses and condos:
Here:
6.2
State:
6.0
Median number of rooms in apartments:
Here:
5.2
State:
3.9
Notable locations in this zip code not listed on our city pages
Notable locations in zip code 95843: Antelope Greens Golf Course (A), Lawrence Links Golf Course (B), North Highlands - Antelope Library (C), Sacramento Metropolitan Fire District Station 26 (D). Display/hide their locations on the map
Churches in zip code 95843 include: Saint Andrews Episcopal Church (A), Antelope Road Christian Fellowship Church (B). Display/hide their locations on the map
Parks in zip code 95843 include: Midtown Park (1), Lone Oak Park (2), Northbrook Park (3), Pokelma Park (4), Antelope Community Park (5), Tetotom Park (6). Display/hide their locations on the map
8,024 married couples with children.
2,341 single-parent households (597 men, 1,744 women).
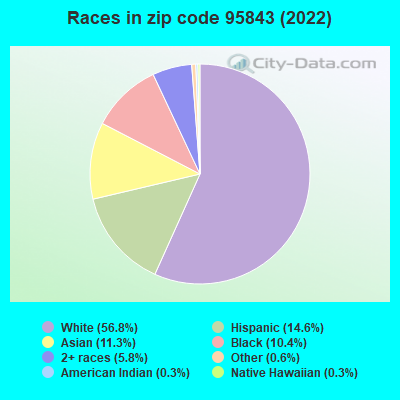
65.5% of residents of 95843 zip code speak English at home.
5.6% of residents speak Spanish at home (71% very well, 16% well, 10% not well, 3% not at all).
20.8% of residents speak other Indo-European language at home (54% very well, 26% well, 14% not well, 5% not at all).
7.2% of residents speak Asian or Pacific Island language at home (54% very well, 29% well, 11% not well, 5% not at all).
1.3% of residents speak other language at home (76% very well, 17% well, 7% not well).
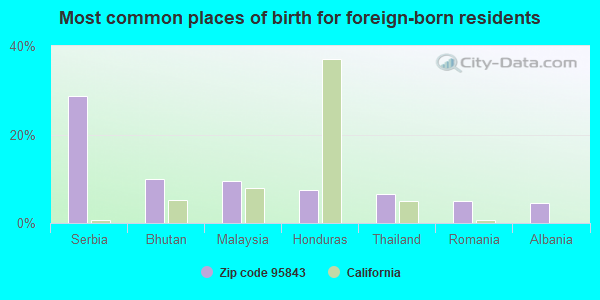
Foreign born population: 11,672 (24.9%) (60.9% of them are naturalized citizens)
This zip code:
24.9%
Whole state:
26.7%
29%Serbia
10%Bhutan
9%Malaysia
7%Honduras
6%Thailand
5%Romania
5%Albania
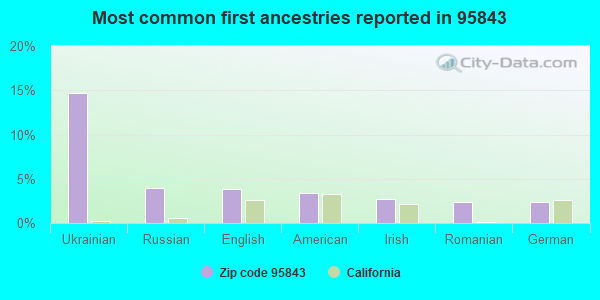
15%Ukrainian
4%Russian
4%English
3%American
3%Irish
2%Romanian
2%German
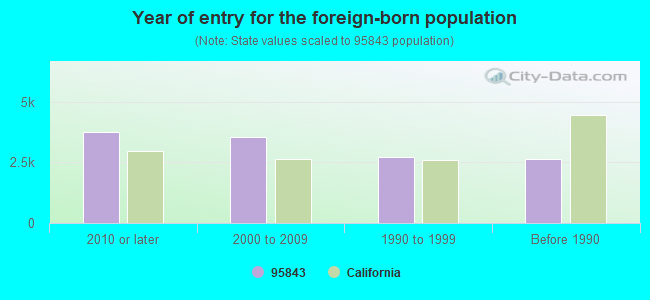
Year of entry for the foreign-born population
3,7322010 or later
3,5322000 to 2009
2,7291990 to 1999
2,645Before 1990
Facilities with environmental interests located in this zip code:
KR ENVIRONMENTAL (8114 CASTLE WYND DR in ANTELOPE, CA)
STATE MASTER (California - Hazardous Waste Tracking) - HAZARDOU WASTE PROGRAM TRANSPORTER (Resource Conservation and Recovery Act (tracking hazardous waste)) Organizations: RON SMITH (CONTACT/OWNER)
ANTELOPE CROSSING MIDDLE (9200 PALMERSON DR. in SACRAMENTO, CA)
(National Center for Education Statistics) - STATE ID-6112072 Organizations: DRY CREEK JOINT ELEMENTARY (SCHOOL DISTRICT)
ANTELOPE MEADOWS ELEMENTARY (8343 PALMERSON DR. in ANTELOPE, CA)
(National Center for Education Statistics) - STATE ID-6109862 Organizations: DRY CREEK JOINT ELEMENTARY (SCHOOL DISTRICT)
ANTELOPE VIEW HOME CHARTER (8725 WATT AVE. in ANTELOPE, CA)
(National Center for Education Statistics) - STATE ID-3430816 Organizations: CENTER JOINT UNIFIED (SCHOOL DISTRICT)
MCCLELLAN HIGH (CONT.) (8725 WATT AVE. in ANTELOPE, CA)
(National Center for Education Statistics) - STATE ID-3430451 Organizations: CENTER JOINT UNIFIED (SCHOOL DISTRICT)
CENTER HIGH (3111 CENTER COURT LANE in ANTELOPE, CA)
(National Center for Education Statistics) - STATE ID-3430378 Organizations: CENTER JOINT UNIFIED (SCHOOL DISTRICT)
CENTER JUNIOR HIGH (3243 CENTER COURT LANE in ANTELOPE, CA)
(National Center for Education Statistics) - STATE ID-6032916 Organizations: CENTER JOINT UNIFIED (SCHOOL DISTRICT)
NORTH COUNTRY ELEMENTARY (3901 LITTLE ROCK DR. in ANTELOPE, CA)
(National Center for Education Statistics) - STATE ID-6108948 Organizations: CENTER JOINT UNIFIED (SCHOOL DISTRICT)
99 CENTS PLUS STORE (8005 WATT AVENUE in ANTELOPE, CA)
COMPLIANCE ACTIVITY (Tracking inspections of insecticide, fungicide, and rodenticide, and toxic substances)
Housing units lacking complete plumbing facilities: 0.1% Housing units lacking complete kitchen facilities: 0.5%
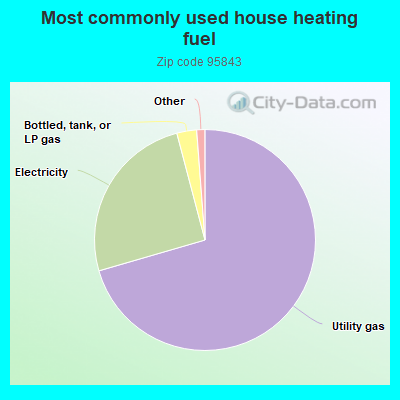
70.5%Utility gas
25.4%Electricity
2.9%Bottled, tank, or LP gas
Place of birth for U.S.-born residents:
This state: 27,879
Northeast: 851
Midwest: 1,815
South: 1,949
West: 1,855
46% of the 95843 zip code residents lived in the same house 5 years ago. Out of people who lived in different houses, 61% lived in this county. Out of people who lived in different counties, 50% lived in California.
91% of the 95843 zip code residents lived in the same house 1 year ago. Out of people who lived in different houses, 55% moved from this county. Out of people who lived in different houses, 29% moved from different county within same state. Out of people who lived in different houses, 9% moved from different state. Out of people who lived in different houses, 9% moved from abroad.
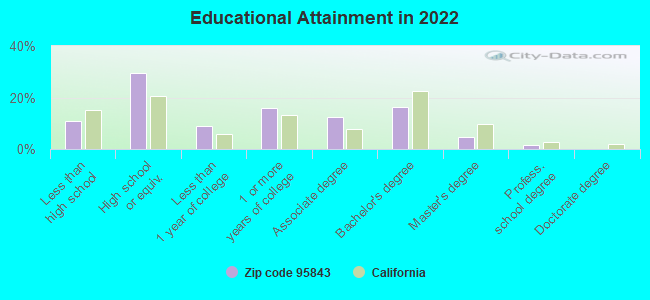
Private vs. public school enrollment:
Students in private schools in grades 1 to 8 (elementary and middle school): 465
Here:
8.7%
California:
10.5%
Students in private schools in grades 9 to 12 (high school): 305
Here:
11.1%
California:
8.5%
Students in private undergraduate colleges: 290
Here:
14.7%
California:
15.9%
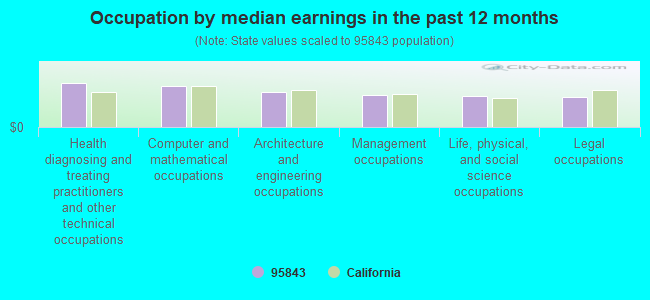
Occupation by median earnings in the past 12 months ($)
107,945Health diagnosing and treating practitioners and other technical occupations
99,402Computer and mathematical occupations
85,512Architecture and engineering occupations
79,397Management occupations
76,735Life, physical, and social science occupations
72,392Legal occupations
Companies with federal contracts located in this zip code:
EUGENE EXHIBITS & GRAPHICS (8337 BREWSTER MILL CIRC in ANTELOPE, CA; small business)
$10,608 with Army for Signs, Advertising Displays, and Identification Plates. Signed on 2003-09-25. Completion date: 2003-11-28.
Top industries in this zip code by the number of employees in 2005:
2005 - 2018 National Fire Incident Reporting System (NFIRS) incidents
Based on the data from the years 2005 - 2018 the average number of fire incidents per year is 36. The highest number of reported fire incidents - 73 took place in 2010, and the least - 10 in 2007. The data has an increasing trend.
When looking into fire subcategories, the most reports belonged to: Outside Fires (53.5%), and Structure Fires (26.4%).
Fire incident types reported to NFIRS in Zip Code 95843

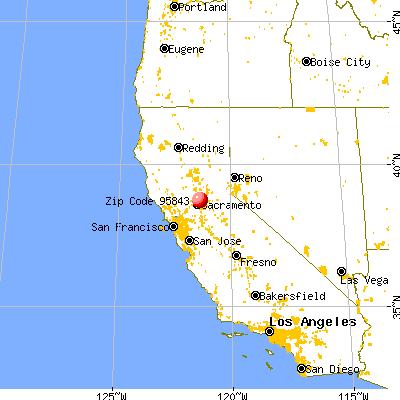


 Nearest zip codes: 95842, 95660, 95841, 95621, 95652, 95747.


 Based on the data from the years 2005 - 2018 the average number of fire incidents per year is 36. The highest number of reported fire incidents - 73 took place in 2010, and the least - 10 in 2007. The data has an increasing trend.
 When looking into fire subcategories, the most reports belonged to: Outside Fires (53.5%), and Structure Fires (26.4%).