Estimated zip code population in 2022: 1,036 Zip code population in 2010: 983 Zip code population in 2000: 732
Houses and condos: 571 Renter-occupied apartments: 26
% of renters here:
6%
State:
44%
March 2022 cost of living index in zip code 95701: 94.7 (less than average, U.S. average is 100)
Land area: 33.3 sq. mi. Water area: 0.1 sq. mi.
Population density: 31 people per square mile
(very low).
OSM Map
General Map
Google Map
MSN Map
OSM Map
General Map
Google Map
MSN Map
OSM Map
General Map
Google Map
MSN Map
OSM Map
General Map
Google Map
MSN Map
Please wait while loading the map...
Real estate property taxes paid for housing units in 2022:
This zip code:
0.5% ($2,939)
California:
0.7% ($4,831)
Median real estate property taxes paid for housing units with mortgages in 2022: $2,684 (0.6%) Median real estate property taxes paid for housing units with no mortgage in 2022: $3,715 (0.5%)
Business Search- 14 Million verified businesses
Males: 542
(52.3%)
Females: 494
(47.7%)
For population 25 years and over in 95701:
High school or higher: 98.0%
Bachelor's degree or higher: 37.4%
Graduate or professional degree: 15.1%
Unemployed: 4.1%
Mean travel time to work (commute): 39.5 minutes
For population 15 years and over in 95701:
Never married: 23.8%
Now married: 58.8%
Separated: 1.2%
Widowed: 5.8%
Divorced: 10.4%
Zip code 95701 compared to state average:
Black race population percentage significantly below state average.
Hispanic race population percentage significantly below state average.
Median age significantly above state average.
Foreign-born population percentage significantly below state average.
Renting percentage significantly below state average.
Length of stay since moving in above state average.
Averages for the 2004 tax year for zip code 95701, filed in 2005:
Average Adjusted Gross Income (AGI) in 2004: $49,522 (Individual Income Tax Returns)
Here:
$49,522
State:
$58,600
Salary/wage: $42,824 (reported on 80.4% of returns)
Here:
$42,824
State:
$49,455
(% of AGI for various income ranges: 143.8% for AGIs below $10k, 67.0% for AGIs $10k-25k, 76.2% for AGIs $25k-50k, 71.3% for AGIs $50k-75k, 68.9% for AGIs $75k-100k, 63.6% for AGIs over 100k)
Taxable interest for individuals: $402 (reported on 54.8% of returns)
This zip code:
$402
California:
$2,365
(% of AGI for various income ranges: 11.1% for AGIs below $10k, 1.0% for AGIs $10k-25k, 0.2% for AGIs $25k-50k, 0.4% for AGIs $50k-75k, 0.2% for AGIs $75k-100k, 0.3% for AGIs over 100k)
Taxable dividends: $1,621 (reported on 20.8% of returns)
Here:
$1,621
State:
$4,746
(% of AGI for various income ranges: 11.5% for AGIs below $10k, 0.9% for AGIs $10k-25k, 0.3% for AGIs $50k-75k, 0.4% for AGIs $75k-100k, 1.1% for AGIs over 100k)
Net capital gain/loss: +$9,310 (reported on 20.1% of returns)
Here:
+$9,310
State:
+$23,418
(% of AGI for various income ranges: -8.8% for AGIs below $10k, -0.7% for AGIs $10k-25k, 0.4% for AGIs $50k-75k, 1.9% for AGIs $75k-100k, 10.5% for AGIs over 100k)
Profit/loss from business: +$10,032 (reported on 22.2% of returns)
Here:
+$10,032
State:
+$16,826
(% of AGI for various income ranges: 13.7% for AGIs below $10k, 9.6% for AGIs $10k-25k, 8.7% for AGIs $25k-50k, 9.1% for AGIs $50k-75k, 1.6% for AGIs $75k-100k)
Total itemized deductions: $20,721 (28% of AGI, reported on 48.8% of returns)
Here:
$20,721
State:
$28,113
Here:
27.7% of AGI
State:
25.3% of AGI
(% of AGI for various income ranges: 26.5% for AGIs $10k-25k, 21.0% for AGIs $25k-50k, 21.0% for AGIs $50k-75k, 19.5% for AGIs $75k-100k, 19.8% for AGIs over 100k)
Charity contributions deductions: $2,577 (3% of AGI, reported on 41.9% of returns)
Here:
$2,577
State:
$3,923
Here:
3.3% of AGI
State:
3.3% of AGI
(% of AGI for various income ranges: 1.3% for AGIs $10k-25k, 2.0% for AGIs $25k-50k, 2.6% for AGIs $50k-75k, 2.9% for AGIs $75k-100k, 1.8% for AGIs over 100k)
Total tax: $6,236 (reported on 80.1% of returns)
95701:
$6,236
State:
$10,761
(% of AGI for various income ranges: 5.8% for AGIs below $10k, 4.7% for AGIs $10k-25k, 7.0% for AGIs $25k-50k, 7.3% for AGIs $50k-75k, 10.1% for AGIs $75k-100k, 14.8% for AGIs over 100k)
Earned income credit: $1,744 (reported on 9.3% of returns)
Here:
$1,744
State:
$1,763
Percentage of individuals using paid preparers for their 2004 taxes: 64.4%
Here:
64%
State:
66%
(% for various income ranges: 50.0% for AGIs below $10k, 63.9% for AGIs $10k-25k, 62.4% for AGIs $25k-50k, 70.7% for AGIs $50k-75k, 75.5% for AGIs $75k-100k, 69.6% for AGIs over 100k)
Household received Food Stamps/SNAP in the past 12 months: 16 Household did not receive Food Stamps/SNAP in the past 12 months: 381
Women who did not have a birth in the past 12 months: 195 (81 now married, 113 unmarried)
Housing units in zip code 95701 with a mortgage: 238 (3 second mortgage) Median monthly owner costs for units with a mortgage: $1,870 Median monthly owner costs for units without a mortgage: $937
Residents with income below the poverty level in 2022:
This zip code:
7.3%
Whole state:
12.2%
Residents with income below 50% of the poverty level in 2022:
This zip code:
4.6%
Whole state:
6.2%
Median number of rooms in houses and condos:
Here:
5.4
State:
6.0
Median number of rooms in apartments:
Here:
5.0
State:
3.9
Notable locations in this zip code not listed on our city pages
Notable locations in zip code 95701: Sugar Pine Point (A), Alta Powerhouse (B), Drum Powerhouse (C), Dutch Flat Powerhouse (D), Blue Canyon Guard Station (E), Blue Canyon Weather Station (F), Bonny Nook (G), Bear Valley Campground (H), Emigrant Gap Scenic Viewpoint (I), Alta Volunteer Fire Protection District (J). Display/hide their locations on the map
In group quarters: 12 (-1 institutionalized population)
Size of family households: 183 2-persons, 51 3-persons, 30 4-persons, 12 5-persons, 12 6-persons, 9 7-or-more-persons
Size of nonfamily households: 99 1-person, 4 2-persons, 3 3-persons
59 married couples with children.
3 single-parent households (3 women).
97.2% of residents of 95701 zip code speak English at home.
0.4% of residents speak Spanish at home (100% very well).
1.7% of residents speak Asian or Pacific Island language at home (100% very well).
Foreign born population: 45 (4.4%) (54.8% of them are naturalized citizens)
This zip code:
4.4%
Whole state:
26.7%
44%Malaysia
40%Thailand
7%Sweden
7%United Kingdom, excluding England and Scotland
7%Romania
15%Irish
14%German
12%American
8%European
7%English
5%Norwegian
2%British
Year of entry for the foreign-born population
242010 or later
02000 to 2009
31990 to 1999
19Before 1990
Facilities with environmental interests located in this zip code:
ALTA-DUTCH FLAT ELEMENTARY (34050 ALTA-BONNIE NOOK ROAD in ALTA, CA)
(National Center for Education Statistics) - STATE ID-6031017 Organizations: ALTA-DUTCH FLAT UNION ELEMENTARY (SCHOOL DISTRICT)
CALTRANS DIST 3 20 AND 80 JUNCTION (STATE HWY I 80 AT POST MI 45.7 in ALTA, CA)
Small Quantity Generators, between 100 kg and 1000 kg of hazardous waste/month (Resource Conservation and Recovery Act (tracking hazardous waste)) - notification Organizations: CALIFORNIA DEPT TRANSPORTATION (CONTACT/OWNER)
Housing units lacking complete plumbing facilities: 2.5% Housing units lacking complete kitchen facilities: 1.2%
60.6%Bottled, tank, or LP gas
23.7%Wood
11.6%Electricity
4.5%Utility gas
Population in 1990: 751.
Place of birth for U.S.-born residents:
This state: 641
Northeast: 59
Midwest: 151
South: 22
West: 105
53% of the 95701 zip code residents lived in the same house 5 years ago. Out of people who lived in different houses, 42% lived in this county. Out of people who lived in different counties, 50% lived in California.
92% of the 95701 zip code residents lived in the same house 1 year ago. Out of people who lived in different houses, 54% moved from this county. Out of people who lived in different houses, 30% moved from different county within same state. Out of people who lived in different houses, 16% moved from different state.
Private vs. public school enrollment:
Students in private schools in grades 1 to 8 (elementary and middle school): 3
Here:
9.3%
California:
10.5%
Students in private schools in grades 9 to 12 (high school): 7
Here:
52.9%
California:
8.5%
Students in private undergraduate colleges: 5
Here:
24.3%
California:
15.9%
Occupation by median earnings in the past 12 months ($)
68,973Management occupations
65,845Community and social service occupations
60,609Installation, maintenance, and repair occupations
48,807Food preparation and serving related occupations
47,343Construction and extraction occupations
33,928Business and financial operations occupations
Top industries in this zip code by the number of employees in 2005:
Accommodation and Food Services: Recreational and Vacation Camps (except Campgrounds) (10-19 employees: 1 establishment)
Construction: New Single-Family Housing Construction (except Operative Builders) (5-9: 1)
Other Services (except Public Administration): Religious Organizations (1-4: 1)
Accommodation and Food Services: RV (Recreational Vehicle) Parks and Campgrounds (1-4: 1)
Construction: Electrical Contractors (1-4: 1)
Professional, Scientific, and Technical Services: All Other Professional, Scientific, and Technical Services (1-4: 1)
Construction: Painting and Wall Covering Contractors (1-4: 1)
Construction: Poured Concrete Foundation and Structure Contractors (1-4: 1)
People in group quarters in 2010:
16 people in residential treatment centers for adults
People in group quarters in 2000:
9 people in homes or halfway houses for drug/alcohol abuse
Fatal accident statistics in 2013:
Fatal accident count: 1
Vehicles involved in fatal accidents: 1
Fatal accidents caused by drunken drivers: 0
Fatalities: 1
Persons involved in fatal accidents: 1
Pedestrians involved in fatal accidents: 0
Fatal accident statistics in 2011:
Fatal accident count: 2
Vehicles involved in fatal accidents: 2
Fatal accidents caused by drunken drivers: 0
Fatalities: 2
Persons involved in fatal accidents: 3
Pedestrians involved in fatal accidents: 1
Home Mortgage Disclosure Act Aggregated Statistics For Year 2009 (Based on 2 partial tracts)
A) FHA, FSA/RHS & VA Home Purchase Loans
B) Conventional Home Purchase Loans
C) Refinancings
D) Home Improvement Loans
F) Non-occupant Loans on < 5 Family Dwellings (A B C & D)
G) Loans On Manufactured Home Dwelling (A B C & D)
Number
Average Value
Number
Average Value
Number
Average Value
Number
Average Value
Number
Average Value
Number
Average Value
LOANS ORIGINATED
2
$166,655
10
$508,820
41
$361,450
1
$357,310
33
$429,906
1
$181,690
APPLICATIONS APPROVED, NOT ACCEPTED
0
$0
1
$728,210
3
$386,043
0
$0
3
$417,907
0
$0
APPLICATIONS DENIED
1
$172,320
1
$445,990
16
$386,978
1
$113,920
9
$413,076
0
$0
APPLICATIONS WITHDRAWN
1
$125,560
1
$276,970
7
$420,799
0
$0
4
$398,635
0
$0
FILES CLOSED FOR INCOMPLETENESS
0
$0
0
$0
2
$340,880
0
$0
1
$373,790
0
$0
Aggregated Statistics For Year 2008 (Based on 2 partial tracts)
A) FHA, FSA/RHS & VA Home Purchase Loans
B) Conventional Home Purchase Loans
C) Refinancings
D) Home Improvement Loans
F) Non-occupant Loans on < 5 Family Dwellings (A B C & D)
G) Loans On Manufactured Home Dwelling (A B C & D)
Number
Average Value
Number
Average Value
Number
Average Value
Number
Average Value
Number
Average Value
Number
Average Value
LOANS ORIGINATED
1
$236,280
13
$611,519
20
$399,403
2
$235,100
20
$539,926
0
$0
APPLICATIONS APPROVED, NOT ACCEPTED
0
$0
3
$544,597
4
$365,212
0
$0
3
$615,870
0
$0
APPLICATIONS DENIED
1
$175,410
4
$593,872
11
$433,424
1
$230,210
7
$502,699
1
$156,250
APPLICATIONS WITHDRAWN
0
$0
1
$708,230
6
$320,245
0
$0
2
$492,650
0
$0
FILES CLOSED FOR INCOMPLETENESS
0
$0
1
$410,560
1
$628,400
0
$0
1
$585,560
0
$0
Aggregated Statistics For Year 2007 (Based on 2 partial tracts)
B) Conventional Home Purchase Loans
C) Refinancings
D) Home Improvement Loans
F) Non-occupant Loans on < 5 Family Dwellings (A B C & D)
G) Loans On Manufactured Home Dwelling (A B C & D)
Number
Average Value
Number
Average Value
Number
Average Value
Number
Average Value
Number
Average Value
LOANS ORIGINATED
23
$589,760
32
$482,819
4
$317,730
33
$606,305
1
$184,890
APPLICATIONS APPROVED, NOT ACCEPTED
5
$463,604
7
$520,577
1
$293,760
6
$661,998
1
$156,250
APPLICATIONS DENIED
8
$507,751
14
$470,496
3
$233,843
10
$560,032
2
$168,560
APPLICATIONS WITHDRAWN
2
$619,650
4
$446,530
1
$386,560
3
$503,257
0
$0
FILES CLOSED FOR INCOMPLETENESS
0
$0
2
$582,415
0
$0
1
$770,230
0
$0
Aggregated Statistics For Year 2006 (Based on 2 partial tracts)
B) Conventional Home Purchase Loans
C) Refinancings
D) Home Improvement Loans
F) Non-occupant Loans on < 5 Family Dwellings (A B C & D)
G) Loans On Manufactured Home Dwelling (A B C & D)
Number
Average Value
Number
Average Value
Number
Average Value
Number
Average Value
Number
Average Value
LOANS ORIGINATED
29
$536,747
40
$431,462
6
$331,935
36
$567,155
1
$250,390
APPLICATIONS APPROVED, NOT ACCEPTED
4
$471,765
7
$311,090
1
$156,460
4
$468,780
0
$0
APPLICATIONS DENIED
8
$593,769
13
$360,857
2
$201,005
8
$581,280
2
$164,180
APPLICATIONS WITHDRAWN
4
$475,808
7
$449,094
1
$206,310
4
$721,000
0
$0
FILES CLOSED FOR INCOMPLETENESS
1
$675,270
2
$330,270
0
$0
1
$815,760
0
$0
Aggregated Statistics For Year 2005 (Based on 2 partial tracts)
B) Conventional Home Purchase Loans
C) Refinancings
D) Home Improvement Loans
F) Non-occupant Loans on < 5 Family Dwellings (A B C & D)
G) Loans On Manufactured Home Dwelling (A B C & D)
Number
Average Value
Number
Average Value
Number
Average Value
Number
Average Value
Number
Average Value
LOANS ORIGINATED
45
$500,234
49
$382,788
6
$257,140
52
$485,910
1
$267,900
APPLICATIONS APPROVED, NOT ACCEPTED
5
$440,902
6
$424,548
0
$0
6
$486,898
0
$0
APPLICATIONS DENIED
12
$500,872
13
$341,112
2
$84,255
11
$561,237
1
$219,490
APPLICATIONS WITHDRAWN
5
$598,800
11
$374,293
1
$218,880
5
$639,116
0
$0
FILES CLOSED FOR INCOMPLETENESS
1
$296,230
3
$373,960
0
$0
2
$378,115
0
$0
Aggregated Statistics For Year 2004 (Based on 2 partial tracts)
B) Conventional Home Purchase Loans
C) Refinancings
D) Home Improvement Loans
F) Non-occupant Loans on < 5 Family Dwellings (A B C & D)
G) Loans On Manufactured Home Dwelling (A B C & D)
Number
Average Value
Number
Average Value
Number
Average Value
Number
Average Value
Number
Average Value
LOANS ORIGINATED
32
$452,067
49
$330,786
4
$288,452
45
$407,264
1
$164,700
APPLICATIONS APPROVED, NOT ACCEPTED
6
$374,097
6
$304,245
1
$56,860
4
$358,750
1
$71,690
APPLICATIONS DENIED
8
$326,008
12
$325,352
1
$157,280
5
$438,822
1
$193,130
APPLICATIONS WITHDRAWN
4
$370,595
8
$294,206
1
$111,140
3
$506,143
1
$145,540
FILES CLOSED FOR INCOMPLETENESS
1
$520,150
3
$261,243
0
$0
1
$565,060
0
$0
Aggregated Statistics For Year 2003 (Based on 2 partial tracts)
B) Conventional Home Purchase Loans
C) Refinancings
D) Home Improvement Loans
F) Non-occupant Loans on < 5 Family Dwellings (A B C & D)
Number
Average Value
Number
Average Value
Number
Average Value
Number
Average Value
LOANS ORIGINATED
28
$346,080
116
$279,335
2
$61,695
74
$324,404
APPLICATIONS APPROVED, NOT ACCEPTED
4
$389,418
13
$255,361
0
$0
8
$342,244
APPLICATIONS DENIED
5
$442,096
23
$280,702
3
$48,650
10
$363,405
APPLICATIONS WITHDRAWN
5
$394,944
17
$258,142
1
$27,190
6
$389,495
FILES CLOSED FOR INCOMPLETENESS
1
$306,940
3
$224,267
0
$0
1
$478,130
Aggregated Statistics For Year 2002 (Based on 2 partial tracts)
B) Conventional Home Purchase Loans
C) Refinancings
D) Home Improvement Loans
F) Non-occupant Loans on < 5 Family Dwellings (A B C & D)
Number
Average Value
Number
Average Value
Number
Average Value
Number
Average Value
LOANS ORIGINATED
28
$305,859
83
$286,283
2
$61,030
54
$340,402
APPLICATIONS APPROVED, NOT ACCEPTED
2
$294,115
9
$287,313
0
$0
5
$253,174
APPLICATIONS DENIED
3
$287,610
10
$367,854
1
$22,970
4
$353,058
APPLICATIONS WITHDRAWN
3
$358,440
10
$251,093
1
$28,630
4
$332,330
FILES CLOSED FOR INCOMPLETENESS
1
$167,790
2
$211,045
0
$0
1
$255,030
Aggregated Statistics For Year 2001 (Based on 2 partial tracts)
A) FHA, FSA/RHS & VA Home Purchase Loans
B) Conventional Home Purchase Loans
C) Refinancings
D) Home Improvement Loans
F) Non-occupant Loans on < 5 Family Dwellings (A B C & D)
Number
Average Value
Number
Average Value
Number
Average Value
Number
Average Value
Number
Average Value
LOANS ORIGINATED
1
$125,970
19
$315,191
56
$255,032
2
$83,275
31
$310,007
APPLICATIONS APPROVED, NOT ACCEPTED
0
$0
2
$237,825
7
$289,694
0
$0
3
$271,063
APPLICATIONS DENIED
0
$0
2
$305,290
10
$249,404
2
$55,000
3
$366,407
APPLICATIONS WITHDRAWN
0
$0
3
$237,483
6
$212,455
1
$23,790
3
$271,990
FILES CLOSED FOR INCOMPLETENESS
0
$0
0
$0
3
$216,300
0
$0
1
$368,640
Aggregated Statistics For Year 2000 (Based on 2 partial tracts)
A) FHA, FSA/RHS & VA Home Purchase Loans
B) Conventional Home Purchase Loans
C) Refinancings
D) Home Improvement Loans
F) Non-occupant Loans on < 5 Family Dwellings (A B C & D)
Number
Average Value
Number
Average Value
Number
Average Value
Number
Average Value
Number
Average Value
LOANS ORIGINATED
1
$184,990
23
$289,515
16
$246,929
2
$78,590
14
$291,276
APPLICATIONS APPROVED, NOT ACCEPTED
0
$0
2
$253,225
4
$273,285
0
$0
2
$320,845
APPLICATIONS DENIED
0
$0
4
$273,465
4
$220,625
1
$74,160
3
$293,723
APPLICATIONS WITHDRAWN
0
$0
3
$227,460
3
$152,920
0
$0
1
$271,510
FILES CLOSED FOR INCOMPLETENESS
0
$0
0
$0
1
$346,800
0
$0
1
$252,870
Aggregated Statistics For Year 1999 (Based on 1 partial tract)
A) FHA, FSA/RHS & VA Home Purchase Loans
B) Conventional Home Purchase Loans
C) Refinancings
D) Home Improvement Loans
F) Non-occupant Loans on < 5 Family Dwellings (A B C & D)
Detailed PMIC statistics for the following Tracts:0220.01
2005 - 2018 National Fire Incident Reporting System (NFIRS) incidents
Based on the data from the years 2005 - 2018 the average number of fire incidents per year is 13. The highest number of fires - 20 took place in 2013, and the least - 4 in 2006. The data has a dropping trend.
When looking into fire subcategories, the most reports belonged to: Mobile Property/Vehicle Fires (45.4%), and Outside Fires (44.3%).
Fire incident types reported to NFIRS in Zip Code 95701

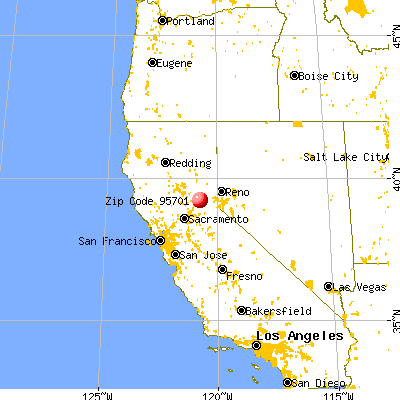


 Nearest zip codes: 95714, 95715, 95717, 95986, 95713, 95631.


 Based on the data from the years 2005 - 2018 the average number of fire incidents per year is 13. The highest number of fires - 20 took place in 2013, and the least - 4 in 2006. The data has a dropping trend.
 When looking into fire subcategories, the most reports belonged to: Mobile Property/Vehicle Fires (45.4%), and Outside Fires (44.3%).