Estimated zip code population in 2022: 407 Zip code population in 2010: 382 Zip code population in 2000: 333
Houses and condos: 308 Renter-occupied apartments: 37
% of renters here:
23%
State:
44%
March 2022 cost of living index in zip code 95714: 95.5 (near average, U.S. average is 100)
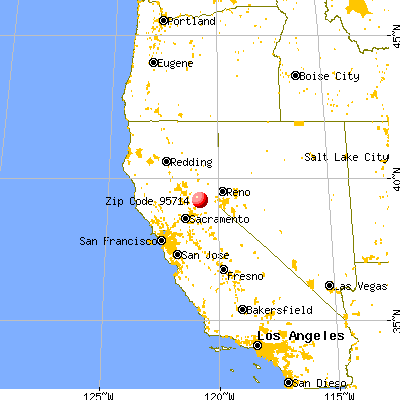
Land area: 3.4 sq. mi. Water area: 0.0 sq. mi.
Population density: 121 people per square mile
(very low).
OSM Map
General Map
Google Map
MSN Map
OSM Map
General Map
Google Map
MSN Map
OSM Map
General Map
Google Map
MSN Map
OSM Map
General Map
Google Map
MSN Map
Please wait while loading the map...
Real estate property taxes paid for housing units in 2022:
This zip code:
0.5% ($2,042)
California:
0.7% ($4,831)
Median real estate property taxes paid for housing units with mortgages in 2022: $1,975 (0.5%) Median real estate property taxes paid for housing units with no mortgage in 2022: $2,225 (0.5%)
Business Search- 14 Million verified businesses
Males: 198
(48.6%)
Females: 209
(51.4%)
For population 25 years and over in 95714:
High school or higher: 92.6%
Bachelor's degree or higher: 28.2%
Graduate or professional degree: 11.2%
Unemployed: 8.2%
Mean travel time to work (commute): 42.9 minutes
For population 15 years and over in 95714:
Never married: 21.1%
Now married: 52.7%
Separated: 1.9%
Widowed: 4.7%
Divorced: 19.6%
Zip code 95714 compared to state average:
Median house value below state average.
Black race population percentage significantly below state average.
Hispanic race population percentage significantly below state average.
Median age significantly above state average.
Foreign-born population percentage significantly below state average.
Renting percentage below state average.
Length of stay since moving in significantly above state average.
Estimated median house/condo value in 2022: $400,244
95714:
$400,244
California:
$715,900
Median resident age:
This zip code:
49.4 years
California median age:
37.9 years
Average household size:
This zip code:
2.5 people
California:
2.8 people
Averages for the 2004 tax year for zip code 95714, filed in 2005:
Average Adjusted Gross Income (AGI) in 2004: $50,000 (Individual Income Tax Returns)
Here:
$50,000
State:
$58,600
Salary/wage: $41,554 (reported on 69.9% of returns)
Here:
$41,554
State:
$49,455
(% of AGI for various income ranges: 79.8% for AGIs below $10k, 63.9% for AGIs $10k-25k, 70.5% for AGIs $25k-50k, 65.1% for AGIs $50k-75k, 63.6% for AGIs $75k-100k, 46.7% for AGIs over 100k)
Taxable interest for individuals: $528 (reported on 47.8% of returns)
This zip code:
$528
California:
$2,365
(% of AGI for various income ranges: 1.2% for AGIs below $10k, 0.5% for AGIs $10k-25k, 0.6% for AGIs $25k-50k, 0.3% for AGIs $50k-75k, 0.2% for AGIs $75k-100k, 0.6% for AGIs over 100k)
Taxable dividends: $5,226 (reported on 28.5% of returns)
Here:
$5,226
State:
$4,746
(% of AGI for various income ranges: 19.0% for AGIs below $10k, 6.0% for AGIs $50k-75k, 3.6% for AGIs over 100k)
Net capital gain/loss: +$13,361 (reported on 19.4% of returns)
Here:
+$13,361
State:
+$23,418
(% of AGI for various income ranges: -8.9% for AGIs below $10k, 2.4% for AGIs $50k-75k, 11.3% for AGIs over 100k)
Profit/loss from business: +$11,023 (reported on 23.7% of returns)
Here:
+$11,023
State:
+$16,826
Total itemized deductions: $20,342 (24% of AGI, reported on 39.2% of returns)
Here:
$20,342
State:
$28,113
Here:
24.0% of AGI
State:
25.3% of AGI
Charity contributions deductions: $2,833 (3% of AGI, reported on 32.3% of returns)
Here:
$2,833
State:
$3,923
Here:
3.2% of AGI
State:
3.3% of AGI
Total tax: $7,033 (reported on 80.6% of returns)
95714:
$7,033
State:
$10,761
(% of AGI for various income ranges: 8.9% for AGIs below $10k, 5.5% for AGIs $10k-25k, 8.7% for AGIs $25k-50k, 9.1% for AGIs $50k-75k, 11.4% for AGIs $75k-100k, 14.3% for AGIs over 100k)
Earned income credit: $1,538 (reported on 14.0% of returns)
Here:
$1,538
State:
$1,763
Percentage of individuals using paid preparers for their 2004 taxes: 62.4%
Here:
62%
State:
66%
(% for various income ranges: 58.7% for AGIs below $10k, 63.9% for AGIs $10k-25k, 56.1% for AGIs $25k-50k, 55.6% for AGIs $50k-75k, 78.6% for AGIs $75k-100k, 77.3% for AGIs over 100k)
Notable locations in zip code 95714: Dutch Flat Station (A), Placer County Fire Department Station 32 / Dutch Flat Volunteer Fire Department (B). Display/hide their locations on the map
Size of family households: 43 2-persons, 30 3-persons, 5 4-persons, 25 5-persons
Size of nonfamily households: 49 1-person, 7 2-persons
44 married couples with children.
0 single-parent households ().
97.5% of residents of 95714 zip code speak English at home.
2.0% of residents speak other Indo-European language at home (100% very well).
Foreign born population: 8 (2.0%) (100.0% of them are naturalized citizens)
This zip code:
2.0%
Whole state:
26.7%
100%Costa Rica
34%English
16%Portuguese
15%Italian
3%American
3%Hungarian
3%Welsh
2%European
Year of entry for the foreign-born population
02010 or later
02000 to 2009
71990 to 1999
7Before 1990
Facilities with environmental interests located in this zip code:
NICHOLS DIGGINS (2 MILES NORTH OF TOWN OF DUTCH FLAT in DUTCH FLAT, CA)
SUPERFUND (Superfund database)
52.2%Bottled, tank, or LP gas
32.4%Wood
8.3%Electricity
6.4%Utility gas
1.9%Fuel oil, kerosene, etc.
Population in 1990: 533.
Place of birth for U.S.-born residents:
This state: 315
Northeast: 6
Midwest: 15
South: 8
West: 42
61% of the 95714 zip code residents lived in the same house 5 years ago. Out of people who lived in different houses, 39% lived in this county. Out of people who lived in different counties, 50% lived in California.
94% of the 95714 zip code residents lived in the same house 1 year ago. Out of people who lived in different houses, 42% moved from this county. Out of people who lived in different houses, 63% moved from different state.
Private vs. public school enrollment:
Students in private schools in grades 1 to 8 (elementary and middle school):
Here:
0.0%
California:
10.5%
Students in private schools in grades 9 to 12 (high school):
Here:
0.0%
California:
8.5%
Students in private undergraduate colleges: 5
Here:
20.5%
California:
15.9%
Occupation by median earnings in the past 12 months ($)
129,252Architecture and engineering occupations
59,528Management occupations
46,160Education, training, and library occupations
40,824Office and administrative support occupations
24,609Building and grounds cleaning and maintenance occupations
Top industries in this zip code by the number of employees in 2005:
Accommodation and Food Services: Full-Service Restaurants (20-49 employees: 1 establishment)
Construction: New Single-Family Housing Construction (except Operative Builders) (1-4: 1)
Utilities: Water Supply and Irrigation Systems (1-4: 1)
Fatal accident statistics in 2013:
Fatal accident count: 1
Vehicles involved in fatal accidents: 1
Fatal accidents caused by drunken drivers: 1
Fatalities: 1
Persons involved in fatal accidents: 2
Pedestrians involved in fatal accidents: 0
Home Mortgage Disclosure Act Aggregated Statistics For Year 2009 (Based on 2 partial tracts)
B) Conventional Home Purchase Loans
C) Refinancings
F) Non-occupant Loans on < 5 Family Dwellings (A B C & D)
Number
Average Value
Number
Average Value
Number
Average Value
LOANS ORIGINATED
2
$573,040
9
$370,886
7
$456,500
APPLICATIONS APPROVED, NOT ACCEPTED
0
$0
1
$260,860
1
$282,390
APPLICATIONS DENIED
0
$0
4
$348,655
2
$418,690
APPLICATIONS WITHDRAWN
0
$0
2
$331,735
1
$359,160
FILES CLOSED FOR INCOMPLETENESS
0
$0
0
$0
0
$0
Aggregated Statistics For Year 2008 (Based on 2 partial tracts)
B) Conventional Home Purchase Loans
C) Refinancings
F) Non-occupant Loans on < 5 Family Dwellings (A B C & D)
Number
Average Value
Number
Average Value
Number
Average Value
LOANS ORIGINATED
3
$596,873
4
$449,812
5
$486,458
APPLICATIONS APPROVED, NOT ACCEPTED
1
$368,000
1
$329,050
1
$416,160
APPLICATIONS DENIED
1
$535,060
2
$536,940
1
$792,600
APPLICATIONS WITHDRAWN
0
$0
1
$432,800
1
$221,930
FILES CLOSED FOR INCOMPLETENESS
0
$0
0
$0
0
$0
Aggregated Statistics For Year 2007 (Based on 2 partial tracts)
B) Conventional Home Purchase Loans
C) Refinancings
D) Home Improvement Loans
F) Non-occupant Loans on < 5 Family Dwellings (A B C & D)
Number
Average Value
Number
Average Value
Number
Average Value
Number
Average Value
LOANS ORIGINATED
5
$611,060
7
$497,150
1
$286,260
8
$563,334
APPLICATIONS APPROVED, NOT ACCEPTED
1
$522,120
2
$410,395
0
$0
1
$894,660
APPLICATIONS DENIED
2
$457,470
3
$494,553
1
$158,020
2
$630,715
APPLICATIONS WITHDRAWN
0
$0
1
$402,310
0
$0
1
$340,070
FILES CLOSED FOR INCOMPLETENESS
0
$0
0
$0
0
$0
0
$0
Aggregated Statistics For Year 2006 (Based on 2 partial tracts)
B) Conventional Home Purchase Loans
C) Refinancings
D) Home Improvement Loans
F) Non-occupant Loans on < 5 Family Dwellings (A B C & D)
Number
Average Value
Number
Average Value
Number
Average Value
Number
Average Value
LOANS ORIGINATED
6
$584,342
9
$431,928
1
$448,600
8
$574,864
APPLICATIONS APPROVED, NOT ACCEPTED
1
$425,050
1
$490,490
0
$0
1
$422,360
APPLICATIONS DENIED
2
$534,970
3
$352,213
1
$90,550
2
$523,715
APPLICATIONS WITHDRAWN
1
$428,690
2
$354,045
0
$0
1
$649,600
FILES CLOSED FOR INCOMPLETENESS
0
$0
0
$0
0
$0
0
$0
Aggregated Statistics For Year 2005 (Based on 2 partial tracts)
B) Conventional Home Purchase Loans
C) Refinancings
D) Home Improvement Loans
F) Non-occupant Loans on < 5 Family Dwellings (A B C & D)
Number
Average Value
Number
Average Value
Number
Average Value
Number
Average Value
LOANS ORIGINATED
10
$507,034
11
$384,072
1
$347,510
12
$474,273
APPLICATIONS APPROVED, NOT ACCEPTED
1
$496,550
1
$573,760
0
$0
1
$658,020
APPLICATIONS DENIED
3
$451,270
3
$332,943
0
$0
3
$463,520
APPLICATIONS WITHDRAWN
1
$674,380
2
$463,685
0
$0
1
$719,780
FILES CLOSED FOR INCOMPLETENESS
0
$0
1
$252,690
0
$0
0
$0
Aggregated Statistics For Year 2004 (Based on 2 partial tracts)
B) Conventional Home Purchase Loans
C) Refinancings
D) Home Improvement Loans
F) Non-occupant Loans on < 5 Family Dwellings (A B C & D)
Number
Average Value
Number
Average Value
Number
Average Value
Number
Average Value
LOANS ORIGINATED
7
$465,484
11
$331,895
1
$259,890
10
$412,800
APPLICATIONS APPROVED, NOT ACCEPTED
1
$505,570
1
$411,170
0
$0
1
$323,220
APPLICATIONS DENIED
2
$293,725
3
$293,133
0
$0
1
$494,210
APPLICATIONS WITHDRAWN
1
$333,890
2
$265,070
0
$0
1
$342,010
FILES CLOSED FOR INCOMPLETENESS
0
$0
1
$176,530
0
$0
0
$0
Aggregated Statistics For Year 2003 (Based on 2 partial tracts)
B) Conventional Home Purchase Loans
C) Refinancings
D) Home Improvement Loans
F) Non-occupant Loans on < 5 Family Dwellings (A B C & D)
Number
Average Value
Number
Average Value
Number
Average Value
Number
Average Value
LOANS ORIGINATED
6
$363,777
26
$280,712
0
$0
17
$318,068
APPLICATIONS APPROVED, NOT ACCEPTED
1
$350,850
3
$249,247
0
$0
2
$308,350
APPLICATIONS DENIED
1
$497,900
5
$290,840
1
$32,870
2
$409,270
APPLICATIONS WITHDRAWN
1
$444,790
4
$247,115
0
$0
1
$526,380
FILES CLOSED FOR INCOMPLETENESS
0
$0
1
$151,540
0
$0
0
$0
Aggregated Statistics For Year 2002 (Based on 2 partial tracts)
B) Conventional Home Purchase Loans
C) Refinancings
F) Non-occupant Loans on < 5 Family Dwellings (A B C & D)
Number
Average Value
Number
Average Value
Number
Average Value
LOANS ORIGINATED
6
$321,498
19
$281,689
12
$345,028
APPLICATIONS APPROVED, NOT ACCEPTED
1
$132,500
2
$291,220
1
$285,130
APPLICATIONS DENIED
1
$194,350
2
$414,280
1
$318,100
APPLICATIONS WITHDRAWN
1
$242,210
2
$282,785
1
$299,420
FILES CLOSED FOR INCOMPLETENESS
0
$0
0
$0
0
$0
Aggregated Statistics For Year 2001 (Based on 2 partial tracts)
B) Conventional Home Purchase Loans
C) Refinancings
D) Home Improvement Loans
F) Non-occupant Loans on < 5 Family Dwellings (A B C & D)
Number
Average Value
Number
Average Value
Number
Average Value
Number
Average Value
LOANS ORIGINATED
4
$337,222
13
$247,452
1
$37,510
7
$309,233
APPLICATIONS APPROVED, NOT ACCEPTED
0
$0
2
$228,380
0
$0
1
$183,160
APPLICATIONS DENIED
1
$137,530
2
$280,880
0
$0
1
$247,590
APPLICATIONS WITHDRAWN
1
$160,470
1
$287,120
0
$0
1
$183,790
FILES CLOSED FOR INCOMPLETENESS
0
$0
1
$146,160
0
$0
0
$0
Aggregated Statistics For Year 2000 (Based on 2 partial tracts)
B) Conventional Home Purchase Loans
C) Refinancings
D) Home Improvement Loans
F) Non-occupant Loans on < 5 Family Dwellings (A B C & D)
Number
Average Value
Number
Average Value
Number
Average Value
Number
Average Value
LOANS ORIGINATED
5
$299,972
4
$222,478
1
$35,400
3
$306,170
APPLICATIONS APPROVED, NOT ACCEPTED
1
$114,070
1
$246,220
0
$0
0
$0
APPLICATIONS DENIED
1
$246,380
1
$198,780
0
$0
1
$198,480
APPLICATIONS WITHDRAWN
1
$153,700
1
$103,330
0
$0
0
$0
FILES CLOSED FOR INCOMPLETENESS
0
$0
0
$0
0
$0
0
$0
Aggregated Statistics For Year 1999 (Based on 1 partial tract)
B) Conventional Home Purchase Loans
C) Refinancings
F) Non-occupant Loans on < 5 Family Dwellings (A B C & D)
Detailed HMDA statistics for the following Tracts:0220.01
Private Mortgage Insurance Companies Aggregated Statistics For Year 2000 (Based on 2 partial tracts)
A) Conventional Home Purchase Loans
Number
Average Value
LOANS ORIGINATED
1
$112,590
APPLICATIONS APPROVED, NOT ACCEPTED
0
$0
APPLICATIONS DENIED
0
$0
APPLICATIONS WITHDRAWN
0
$0
FILES CLOSED FOR INCOMPLETENESS
0
$0
Detailed PMIC statistics for the following Tracts:0220.01
2005 - 2018 National Fire Incident Reporting System (NFIRS) incidents
According to the data from the years 2005 - 2018 the average number of fires per year is 12. The highest number of reported fires - 21 took place in 2007, and the least - 2 in 2005. The data has an increasing trend.
When looking into fire subcategories, the most reports belonged to: Outside Fires (47.1%), and Mobile Property/Vehicle Fires (33.5%).
Fire incident types reported to NFIRS in Zip Code 95714


 Nearest zip codes: 95717, 95701, 95713, 95945, 95631, 95986.


 According to the data from the years 2005 - 2018 the average number of fires per year is 12. The highest number of reported fires - 21 took place in 2007, and the least - 2 in 2005. The data has an increasing trend.
 When looking into fire subcategories, the most reports belonged to: Outside Fires (47.1%), and Mobile Property/Vehicle Fires (33.5%).