Estimated zip code population in 2022: 1,791 Zip code population in 2010: 2,339 Zip code population in 2000: 1,467
Houses and condos: 1,001 Renter-occupied apartments: 119
% of renters here:
13%
State:
44%
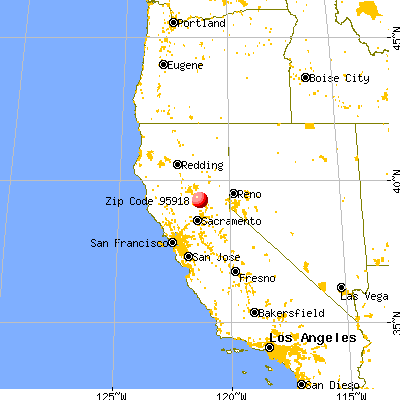
March 2022 cost of living index in zip code 95918: 96.9 (near average, U.S. average is 100)
Land area: 69.1 sq. mi. Water area: 2.0 sq. mi.
Population density: 26 people per square mile
(very low).
OSM Map
General Map
Google Map
MSN Map
OSM Map
General Map
Google Map
MSN Map
OSM Map
General Map
Google Map
MSN Map
OSM Map
General Map
Google Map
MSN Map
Please wait while loading the map...
Real estate property taxes paid for housing units in 2022:
This zip code:
0.7% ($4,401)
California:
0.7% ($4,831)
Median real estate property taxes paid for housing units with mortgages in 2022: $4,516 (0.7%) Median real estate property taxes paid for housing units with no mortgage in 2022: $3,876 (0.6%)
Averages for the 2020 tax year for zip code 95918, filed in 2021:
Average Adjusted Gross Income (AGI) in 2020: $89,941 (Individual Income Tax Returns)
Here:
$89,941
State:
$95,910
Salary/wage: $84,193 (reported on 68.0% of returns)
Here:
$84,193
State:
$77,331
(% of AGI for various income ranges: 1176.0% for AGIs below $25k, 3160.8% for AGIs $25k-50k, 5541.2% for AGIs $50k-75k, 8994.3% for AGIs $75k-100k, 18830.8% for AGIs $100k-200k, 90845.0% for AGIs over 200k)
Taxable interest for individuals: $991 (reported on 55.3% of returns)
This zip code:
$991
California:
$2,294
(% of AGI for various income ranges: 21.3% for AGIs below $25k, 9.2% for AGIs $25k-50k, 153.8% for AGIs $50k-75k, 51.4% for AGIs $75k-100k, 169.2% for AGIs $100k-200k, 715.0% for AGIs over 200k)
Ordinary dividends: $4,448 (reported on 22.3% of returns)
Here:
$4,448
State:
$10,949
(% of AGI for various income ranges: 46.7% for AGIs below $25k, 94.2% for AGIs $25k-50k, 96.2% for AGIs $50k-75k, 142.9% for AGIs $75k-100k, 390.8% for AGIs $100k-200k, 775.0% for AGIs over 200k)
Net capital gain/loss in AGI: +$13,730 (reported on 22.3% of returns)
Here:
+$13,730
State:
+$49,306
(% of AGI for various income ranges: 10.0% for AGIs below $25k, 35.0% for AGIs $25k-50k, 86.2% for AGIs $50k-75k, 161.4% for AGIs $75k-100k, 778.5% for AGIs $100k-200k, 9535.0% for AGIs over 200k)
Profit/loss from business: +$20,338 (reported on 20.4% of returns)
Here:
+$20,338
State:
+$15,671
(% of AGI for various income ranges: 192.0% for AGIs below $25k, 325.0% for AGIs $25k-50k, 613.8% for AGIs $50k-75k, 295.7% for AGIs $75k-100k, 724.6% for AGIs $100k-200k, 9765.0% for AGIs over 200k)
Taxable individual retirement arrangement distribution: $15,136 (reported on 10.7% of returns)
95918:
$15,136
California:
$23,505
(% of AGI for various income ranges: 162.0% for AGIs below $25k, 677.5% for AGIs $50k-75k, 676.9% for AGIs $100k-200k)
Total itemized deductions: $31,438 (reported on 20.4% of returns)
Here:
$31,438
State:
$39,517
(% of AGI for various income ranges: 428.7% for AGIs below $25k, 855.0% for AGIs $50k-75k, 1112.9% for AGIs $75k-100k, 2313.1% for AGIs $100k-200k, 7445.0% for AGIs over 200k)
Charity contributions: $5,487 (reported on 14.6% of returns)
Here:
$5,487
State:
$12,598
(% of AGI for various income ranges: 110.0% for AGIs $25k-50k, 95.7% for AGIs $75k-100k, 282.3% for AGIs $100k-200k, 1285.0% for AGIs over 200k)
Taxes paid: $8,810 (reported on 20.4% of returns)
95918:
$8,810
State:
$8,807
(% of AGI for various income ranges: 92.7% for AGIs below $25k, 165.0% for AGIs $50k-75k, 342.9% for AGIs $75k-100k, 698.5% for AGIs $100k-200k, 2155.0% for AGIs over 200k)
Earned income credit: $1,950 (reported on 9.7% of returns)
Here:
$1,950
State:
$2,074
(% of AGI for various income ranges: 74.0% for AGIs below $25k, 70.0% for AGIs $25k-50k)
Percentage of individuals using paid preparers for their 2020 taxes: 93.2%
Here:
93%
State:
92%
(% for various income ranges: 92.0% for AGIs below $25k, 94.1% for AGIs $25k-50k, 85.7% for AGIs $50k-75k, 91.7% for AGIs $75k-100k, 96.2% for AGIs $100k-200k, 100.0% for AGIs over 200k)
Averages for the 2012 tax year for zip code 95918, filed in 2013:
Average Adjusted Gross Income (AGI) in 2012: $70,677 (Individual Income Tax Returns)
Here:
$70,677
State:
$72,726
Salary/wage: $63,305 (reported on 68.9% of returns)
Here:
$63,305
State:
$59,079
(% of AGI for various income ranges: 53.4% for AGIs below $25k, 54.6% for AGIs $25k-50k, 51.1% for AGIs $50k-75k, 64.0% for AGIs $75k-100k, 65.4% for AGIs $100k-200k, 66.1% for AGIs over 200k)
Taxable interest for individuals: $1,163 (reported on 57.8% of returns)
This zip code:
$1,163
California:
$2,146
(% of AGI for various income ranges: 2.8% for AGIs below $25k, 1.9% for AGIs $25k-50k, 1.5% for AGIs $50k-75k, 0.4% for AGIs $75k-100k, 0.9% for AGIs $100k-200k, 0.2% for AGIs over 200k)
Ordinary dividends: $2,650 (reported on 24.4% of returns)
Here:
$2,650
State:
$9,308
(% of AGI for various income ranges: 1.2% for AGIs below $25k, 0.9% for AGIs $25k-50k, 1.4% for AGIs $50k-75k, 1.2% for AGIs $75k-100k, 1.0% for AGIs $100k-200k)
Net capital gain/loss in AGI: +$9,021 (reported on 21.1% of returns)
Here:
+$9,021
State:
+$30,460
(% of AGI for various income ranges: 0.8% for AGIs $50k-75k, 7.1% for AGIs $100k-200k)
Profit/loss from business: +$11,905 (reported on 23.3% of returns)
Here:
+$11,905
State:
+$17,064
(% of AGI for various income ranges: 12.7% for AGIs below $25k, 5.5% for AGIs $25k-50k, 3.9% for AGIs $50k-75k, 0.5% for AGIs $75k-100k, 5.7% for AGIs $100k-200k)
Taxable individual retirement arrangement distribution: $15,027 (reported on 16.7% of returns)
95918:
$15,027
California:
$19,557
(% of AGI for various income ranges: 5.5% for AGIs below $25k, 7.0% for AGIs $25k-50k, 6.9% for AGIs $50k-75k, 5.3% for AGIs $75k-100k, 2.2% for AGIs $100k-200k)
Total itemized deductions: $25,731 (25% of AGI, reported on 53.3% of returns)
Here:
$25,731
State:
$34,004
Here:
25.2% of AGI
State:
22.7% of AGI
(% of AGI for various income ranges: 22.3% for AGIs below $25k, 20.1% for AGIs $25k-50k, 22.1% for AGIs $50k-75k, 18.8% for AGIs $75k-100k, 19.9% for AGIs $100k-200k, 15.9% for AGIs over 200k)
Charity contributions: $2,932 (reported on 44.4% of returns)
Here:
$2,932
State:
$4,659
(% of AGI for various income ranges: 2.3% for AGIs below $25k, 1.9% for AGIs $25k-50k, 1.6% for AGIs $50k-75k, 1.7% for AGIs $75k-100k, 2.1% for AGIs $100k-200k, 1.6% for AGIs over 200k)
Taxes paid: $9,396 (reported on 53.3% of returns)
95918:
$9,396
State:
$14,448
(% of AGI for various income ranges: 5.4% for AGIs below $25k, 5.6% for AGIs $25k-50k, 5.6% for AGIs $50k-75k, 6.2% for AGIs $75k-100k, 7.7% for AGIs $100k-200k, 8.9% for AGIs over 200k)
Earned income credit: $1,689 (reported on 10.0% of returns)
Here:
$1,689
State:
$2,286
(% of AGI for various income ranges: 3.6% for AGIs below $25k, 0.6% for AGIs $25k-50k)
Percentage of individuals using paid preparers for their 2012 taxes: 65.6%
Here:
66%
State:
64%
(% for various income ranges: 53.8% for AGIs below $25k, 64.7% for AGIs $25k-50k, 71.4% for AGIs $50k-75k, 72.7% for AGIs $75k-100k, 66.7% for AGIs $100k-200k, 100.0% for AGIs over 200k)
Averages for the 2004 tax year for zip code 95918, filed in 2005:
Average Adjusted Gross Income (AGI) in 2004: $53,991 (Individual Income Tax Returns)
Here:
$53,991
State:
$58,600
Salary/wage: $50,063 (reported on 74.9% of returns)
Here:
$50,063
State:
$49,455
(% of AGI for various income ranges: 48.3% for AGIs $10k-25k, 56.9% for AGIs $25k-50k, 78.1% for AGIs $50k-75k, 80.5% for AGIs $75k-100k, 62.0% for AGIs over 100k)
Taxable interest for individuals: $1,475 (reported on 62.4% of returns)
This zip code:
$1,475
California:
$2,365
(% of AGI for various income ranges: 5.6% for AGIs $10k-25k, 3.5% for AGIs $25k-50k, 0.3% for AGIs $50k-75k, 0.8% for AGIs $75k-100k, 0.9% for AGIs over 100k)
Taxable dividends: $1,570 (reported on 26.2% of returns)
Here:
$1,570
State:
$4,746
(% of AGI for various income ranges: 2.9% for AGIs $10k-25k, 1.2% for AGIs $25k-50k, 0.7% for AGIs $50k-75k, 0.6% for AGIs $75k-100k, 0.3% for AGIs over 100k)
Net capital gain/loss: +$12,443 (reported on 23.0% of returns)
Here:
+$12,443
State:
+$23,418
(% of AGI for various income ranges: -0.6% for AGIs $10k-25k, 2.6% for AGIs $25k-50k, 0.7% for AGIs $50k-75k, 1.6% for AGIs $75k-100k, 10.8% for AGIs over 100k)
Profit/loss from business: +$16,144 (reported on 23.1% of returns)
Here:
+$16,144
State:
+$16,826
(% of AGI for various income ranges: 12.3% for AGIs $10k-25k, 9.2% for AGIs $25k-50k, 0.7% for AGIs $50k-75k, 0.4% for AGIs $75k-100k, 11.1% for AGIs over 100k)
IRA payment deduction: $3,913 (reported on 2.7% of returns)
95918:
$3,913
California:
$3,192
Self-employed pension: $15,000 (reported on 1.5% of returns)
Here:
$15,000
California:
$17,688
Total itemized deductions: $21,017 (26% of AGI, reported on 54.4% of returns)
Here:
$21,017
State:
$28,113
Here:
25.8% of AGI
State:
25.3% of AGI
(% of AGI for various income ranges: 25.7% for AGIs $10k-25k, 19.3% for AGIs $25k-50k, 24.5% for AGIs $50k-75k, 21.1% for AGIs $75k-100k, 17.8% for AGIs over 100k)
Charity contributions deductions: $2,441 (3% of AGI, reported on 45.4% of returns)
Here:
$2,441
State:
$3,923
Here:
2.9% of AGI
State:
3.3% of AGI
(% of AGI for various income ranges: 1.6% for AGIs $10k-25k, 2.2% for AGIs $25k-50k, 2.8% for AGIs $50k-75k, 1.7% for AGIs $75k-100k, 1.8% for AGIs over 100k)
Total tax: $7,834 (reported on 80.9% of returns)
95918:
$7,834
State:
$10,761
(% of AGI for various income ranges: 5.1% for AGIs $10k-25k, 6.9% for AGIs $25k-50k, 8.0% for AGIs $50k-75k, 9.2% for AGIs $75k-100k, 16.6% for AGIs over 100k)
Earned income credit: $1,610 (reported on 9.7% of returns)
Here:
$1,610
State:
$1,763
Percentage of individuals using paid preparers for their 2004 taxes: 65.7%
Here:
66%
State:
66%
(% for various income ranges: 55.6% for AGIs below $10k, 62.5% for AGIs $10k-25k, 62.3% for AGIs $25k-50k, 70.9% for AGIs $50k-75k, 62.7% for AGIs $75k-100k, 82.8% for AGIs over 100k)
Household received Food Stamps/SNAP in the past 12 months: 74 Household did not receive Food Stamps/SNAP in the past 12 months: 843
Women who had a birth in the past 12 months: 23 (14 now married, 9 unmarried) Women who did not have a birth in the past 12 months: 204 (89 now married, 114 unmarried)
Housing units in zip code 95918 with a mortgage: 549 (32 second mortgage, 34 both second mortgage and home equity loan) Houses without a mortgage: 17
Median monthly owner costs for units with a mortgage: $1,926 Median monthly owner costs for units without a mortgage: $826
Residents with income below the poverty level in 2022:
This zip code:
8.3%
Whole state:
12.2%
Median number of rooms in houses and condos:
Here:
6.1
State:
6.0
Median number of rooms in apartments:
Here:
5.2
State:
3.9
Notable locations in this zip code not listed on our city pages
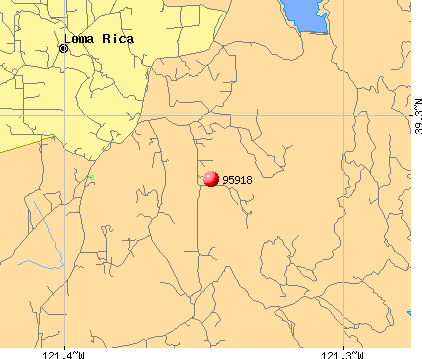
Notable locations in zip code 95918: Carmichael Ranch (A), Sid Smith Ranch (B), Pal O Mine Ranch (C), Forbes Ranch (D), Finley Ranch (E). Display/hide their locations on the map
Size of family households: 407 2-persons, 71 3-persons, 72 4-persons, 10 5-persons, 16 6-persons
Size of nonfamily households: 220 1-person, 136 2-persons
206 married couples with children.
0 single-parent households ().
97.9% of residents of 95918 zip code speak English at home.
0.7% of residents speak Spanish at home (100% well).
1.9% of residents speak other Indo-European language at home (100% very well).
0.8% of residents speak Asian or Pacific Island language at home (100% very well).
Foreign born population: 185 (10.4%) (76.5% of them are naturalized citizens)
This zip code:
10.4%
Whole state:
26.7%
18%Sweden
17%France
17%Romania
15%Uganda
9%Brazil
7%Hong Kong
5%Netherlands
15%English
13%American
12%Irish
10%German
9%European
5%Scottish
4%Norwegian
Year of entry for the foreign-born population
02010 or later
132000 to 2009
601990 to 1999
101Before 1990
59.3%Bottled, tank, or LP gas
19.9%Wood
10.0%Electricity
6.6%Utility gas
4.4%Other fuel
Population in 1990: 1,297. Population change in the 1990s: +170 (+13.1%).
Place of birth for U.S.-born residents:
This state: 1,179
Northeast: 47
Midwest: 112
South: 137
West: 121
74% of the 95918 zip code residents lived in the same house 5 years ago. Out of people who lived in different houses, 22% lived in this county. Out of people who lived in different counties, 50% lived in California.
84% of the 95918 zip code residents lived in the same house 1 year ago. Out of people who lived in different houses, 82% moved from this county. Out of people who lived in different houses, 12% moved from different county within same state.
Private vs. public school enrollment:
Students in private schools in grades 1 to 8 (elementary and middle school):
Here:
0.0%
California:
10.5%
Students in private schools in grades 9 to 12 (high school):
Here:
0.0%
California:
8.5%
Occupation by median earnings in the past 12 months ($)
45,989Office and administrative support occupations
45,815Business and financial operations occupations
21,521Management occupations
9,845Production occupations
Companies with federal contracts located in this zip code:
CHRISTINE A YORK (7226 WANDERING WAY in BROWNS VALLEY, CA; small business) : $136,422 in 4 contractsfrom 2000 to 2001
$45,474 with U.S. Army Corps of Engineers - civil program financing only for Custodial Janitorial Services. Signed on 2001-11-05. Completion date: 2002-09-30.
$45,474, same as above.Signed on 2000-11-16. Completion date: 2002-09-30.
$45,474, same as above.Signed on 2000-11-15. Completion date: 2002-09-30.
$0, same as above.Signed on 2000-11-15. Completion date: 2002-09-30.
MCGOURTY, JERRY (6671 TURKEY HOLLOW TRAIL in BROWNS VALLEY, CA; small business)
$6,350 with Navy for ADPE System Configuration. Signed on 2005-01-27. Completion date: 2005-02-11.
Top industries in this zip code by the number of employees in 2005:
Accommodation and Food Services: Limited-Service Restaurants (10-19 employees: 1 establishment)
Other Services (except Public Administration): General Automotive Repair (10-19: 1)
Construction: Drywall and Insulation Contractors (10-19: 1)
Administrative and Support and Waste Management and Remediation Services: Janitorial Services (5-9: 1)
Construction: Painting and Wall Covering Contractors (1-4: 2)
Fatal accident statistics in 2014:
Fatal accident count: 1
Vehicles involved in fatal accidents: 1
Fatal accidents caused by drunken drivers: 0
Fatalities: 1
Persons involved in fatal accidents: 2
Pedestrians involved in fatal accidents: 0
Fatal accident statistics in 2010:
Fatal accident count: 1
Vehicles involved in fatal accidents: 2
Fatal accidents caused by drunken drivers: 1
Fatalities: 1
Persons involved in fatal accidents: 2
Pedestrians involved in fatal accidents: 0
Home Mortgage Disclosure Act Aggregated Statistics For Year 2009 (Based on 2 partial tracts)
A) FHA, FSA/RHS & VA Home Purchase Loans
B) Conventional Home Purchase Loans
C) Refinancings
D) Home Improvement Loans
F) Non-occupant Loans on < 5 Family Dwellings (A B C & D)
G) Loans On Manufactured Home Dwelling (A B C & D)
Number
Average Value
Number
Average Value
Number
Average Value
Number
Average Value
Number
Average Value
Number
Average Value
LOANS ORIGINATED
25
$226,964
11
$228,696
85
$239,969
3
$156,610
6
$212,287
10
$160,724
APPLICATIONS APPROVED, NOT ACCEPTED
1
$244,080
2
$260,780
7
$234,070
2
$154,905
1
$68,970
2
$153,290
APPLICATIONS DENIED
5
$236,640
4
$208,380
53
$253,683
3
$111,890
1
$134,700
5
$189,334
APPLICATIONS WITHDRAWN
2
$164,065
5
$242,244
24
$251,260
2
$154,365
2
$204,475
2
$54,150
FILES CLOSED FOR INCOMPLETENESS
1
$235,460
1
$194,510
4
$230,608
1
$26,940
0
$0
1
$101,290
Aggregated Statistics For Year 2008 (Based on 2 partial tracts)
A) FHA, FSA/RHS & VA Home Purchase Loans
B) Conventional Home Purchase Loans
C) Refinancings
D) Home Improvement Loans
F) Non-occupant Loans on < 5 Family Dwellings (A B C & D)
G) Loans On Manufactured Home Dwelling (A B C & D)
Number
Average Value
Number
Average Value
Number
Average Value
Number
Average Value
Number
Average Value
Number
Average Value
LOANS ORIGINATED
10
$244,615
18
$245,244
53
$253,134
6
$124,103
5
$272,418
11
$239,325
APPLICATIONS APPROVED, NOT ACCEPTED
4
$231,818
6
$223,512
16
$228,855
1
$19,940
1
$76,510
5
$59,376
APPLICATIONS DENIED
3
$216,060
5
$267,460
60
$247,282
13
$124,587
4
$177,130
16
$195,416
APPLICATIONS WITHDRAWN
2
$182,925
2
$445,320
25
$248,064
4
$197,605
0
$0
4
$155,712
FILES CLOSED FOR INCOMPLETENESS
1
$184,270
0
$0
4
$216,192
2
$102,370
0
$0
1
$188,580
Aggregated Statistics For Year 2007 (Based on 2 partial tracts)
A) FHA, FSA/RHS & VA Home Purchase Loans
B) Conventional Home Purchase Loans
C) Refinancings
D) Home Improvement Loans
E) Loans on Dwellings For 5+ Families
F) Non-occupant Loans on < 5 Family Dwellings (A B C & D)
G) Loans On Manufactured Home Dwelling (A B C & D)
Number
Average Value
Number
Average Value
Number
Average Value
Number
Average Value
Number
Average Value
Number
Average Value
Number
Average Value
LOANS ORIGINATED
1
$275,330
36
$249,794
94
$271,441
20
$136,990
0
$0
9
$269,640
18
$174,841
APPLICATIONS APPROVED, NOT ACCEPTED
1
$136,860
11
$267,441
29
$268,081
4
$141,570
0
$0
2
$388,205
5
$184,700
APPLICATIONS DENIED
0
$0
11
$255,440
94
$312,315
18
$143,620
0
$0
6
$372,850
20
$201,107
APPLICATIONS WITHDRAWN
1
$279,640
13
$256,552
36
$330,524
4
$205,688
1
$59,270
5
$238,580
3
$286,463
FILES CLOSED FOR INCOMPLETENESS
0
$0
1
$213,900
15
$289,587
2
$255,120
0
$0
1
$191,270
1
$133,080
Aggregated Statistics For Year 2006 (Based on 2 partial tracts)
A) FHA, FSA/RHS & VA Home Purchase Loans
B) Conventional Home Purchase Loans
C) Refinancings
D) Home Improvement Loans
E) Loans on Dwellings For 5+ Families
F) Non-occupant Loans on < 5 Family Dwellings (A B C & D)
G) Loans On Manufactured Home Dwelling (A B C & D)
Number
Average Value
Number
Average Value
Number
Average Value
Number
Average Value
Number
Average Value
Number
Average Value
Number
Average Value
LOANS ORIGINATED
6
$276,315
96
$249,885
155
$281,372
29
$124,147
1
$385,240
17
$271,428
23
$231,848
APPLICATIONS APPROVED, NOT ACCEPTED
1
$154,640
21
$251,773
33
$284,095
10
$151,133
0
$0
2
$191,275
4
$185,482
APPLICATIONS DENIED
1
$128,770
31
$278,855
93
$288,762
29
$157,924
0
$0
6
$283,408
16
$180,363
APPLICATIONS WITHDRAWN
1
$330,820
22
$266,143
74
$309,067
6
$163,615
1
$150,860
3
$160,563
4
$167,835
FILES CLOSED FOR INCOMPLETENESS
0
$0
1
$169,720
13
$274,912
2
$91,325
0
$0
1
$70,040
2
$145,745
Aggregated Statistics For Year 2005 (Based on 2 partial tracts)
A) FHA, FSA/RHS & VA Home Purchase Loans
B) Conventional Home Purchase Loans
C) Refinancings
D) Home Improvement Loans
E) Loans on Dwellings For 5+ Families
F) Non-occupant Loans on < 5 Family Dwellings (A B C & D)
G) Loans On Manufactured Home Dwelling (A B C & D)
Number
Average Value
Number
Average Value
Number
Average Value
Number
Average Value
Number
Average Value
Number
Average Value
Number
Average Value
LOANS ORIGINATED
1
$193,970
146
$248,948
176
$251,601
37
$137,146
1
$161,640
25
$242,417
32
$185,162
APPLICATIONS APPROVED, NOT ACCEPTED
0
$0
39
$237,915
37
$238,499
6
$169,363
0
$0
5
$260,886
10
$181,629
APPLICATIONS DENIED
0
$0
64
$258,725
101
$242,663
29
$137,152
0
$0
11
$192,205
20
$185,832
APPLICATIONS WITHDRAWN
1
$109,380
45
$222,321
91
$221,684
9
$187,562
0
$0
4
$197,065
11
$186,425
FILES CLOSED FOR INCOMPLETENESS
0
$0
5
$326,298
19
$242,346
2
$97,790
0
$0
2
$301,995
3
$267,067
Aggregated Statistics For Year 2004 (Based on 2 partial tracts)
A) FHA, FSA/RHS & VA Home Purchase Loans
B) Conventional Home Purchase Loans
C) Refinancings
D) Home Improvement Loans
F) Non-occupant Loans on < 5 Family Dwellings (A B C & D)
G) Loans On Manufactured Home Dwelling (A B C & D)
Number
Average Value
Number
Average Value
Number
Average Value
Number
Average Value
Number
Average Value
Number
Average Value
LOANS ORIGINATED
4
$164,738
134
$203,309
162
$211,123
29
$115,322
19
$212,287
30
$163,113
APPLICATIONS APPROVED, NOT ACCEPTED
1
$64,660
32
$181,071
25
$201,037
6
$110,095
4
$197,200
7
$146,554
APPLICATIONS DENIED
5
$184,916
37
$190,255
107
$203,551
23
$117,224
6
$213,275
21
$163,616
APPLICATIONS WITHDRAWN
1
$123,920
18
$202,199
60
$200,515
6
$150,415
3
$205,463
5
$144,722
FILES CLOSED FOR INCOMPLETENESS
0
$0
6
$214,173
23
$219,807
2
$61,155
1
$95,910
1
$80,820
Aggregated Statistics For Year 2003 (Based on 2 partial tracts)
A) FHA, FSA/RHS & VA Home Purchase Loans
B) Conventional Home Purchase Loans
C) Refinancings
D) Home Improvement Loans
F) Non-occupant Loans on < 5 Family Dwellings (A B C & D)
Number
Average Value
Number
Average Value
Number
Average Value
Number
Average Value
Number
Average Value
LOANS ORIGINATED
4
$175,245
80
$199,221
281
$163,857
15
$47,522
25
$166,424
APPLICATIONS APPROVED, NOT ACCEPTED
0
$0
15
$158,192
50
$163,644
6
$38,075
5
$155,820
APPLICATIONS DENIED
1
$95,370
27
$155,993
102
$178,301
10
$28,772
4
$166,490
APPLICATIONS WITHDRAWN
1
$58,190
11
$204,450
67
$166,722
2
$29,635
3
$171,160
FILES CLOSED FOR INCOMPLETENESS
0
$0
4
$189,252
9
$203,787
1
$21,550
1
$323,820
Aggregated Statistics For Year 2002 (Based on 2 partial tracts)
A) FHA, FSA/RHS & VA Home Purchase Loans
B) Conventional Home Purchase Loans
C) Refinancings
D) Home Improvement Loans
F) Non-occupant Loans on < 5 Family Dwellings (A B C & D)
Number
Average Value
Number
Average Value
Number
Average Value
Number
Average Value
Number
Average Value
LOANS ORIGINATED
3
$140,447
67
$147,856
173
$147,709
8
$33,675
12
$137,978
APPLICATIONS APPROVED, NOT ACCEPTED
1
$66,810
9
$161,101
24
$155,511
2
$21,550
2
$85,130
APPLICATIONS DENIED
2
$130,390
18
$128,324
63
$147,187
5
$41,164
4
$158,542
APPLICATIONS WITHDRAWN
1
$122,310
9
$147,930
57
$155,420
2
$41,490
1
$46,340
FILES CLOSED FOR INCOMPLETENESS
0
$0
2
$212,285
9
$114,764
0
$0
0
$0
Aggregated Statistics For Year 2001 (Based on 2 partial tracts)
A) FHA, FSA/RHS & VA Home Purchase Loans
B) Conventional Home Purchase Loans
C) Refinancings
D) Home Improvement Loans
F) Non-occupant Loans on < 5 Family Dwellings (A B C & D)
Number
Average Value
Number
Average Value
Number
Average Value
Number
Average Value
Number
Average Value
LOANS ORIGINATED
3
$125,900
37
$153,136
129
$128,071
10
$29,311
9
$146,673
APPLICATIONS APPROVED, NOT ACCEPTED
0
$0
2
$105,065
23
$100,404
2
$34,485
1
$80,280
APPLICATIONS DENIED
0
$0
15
$108,586
50
$109,915
8
$38,390
2
$58,730
APPLICATIONS WITHDRAWN
0
$0
5
$128,126
44
$138,215
2
$56,575
2
$141,705
FILES CLOSED FOR INCOMPLETENESS
1
$100,760
1
$214,440
16
$119,411
0
$0
0
$0
Aggregated Statistics For Year 2000 (Based on 2 partial tracts)
A) FHA, FSA/RHS & VA Home Purchase Loans
B) Conventional Home Purchase Loans
C) Refinancings
D) Home Improvement Loans
F) Non-occupant Loans on < 5 Family Dwellings (A B C & D)
Number
Average Value
Number
Average Value
Number
Average Value
Number
Average Value
Number
Average Value
LOANS ORIGINATED
6
$117,188
47
$121,746
40
$95,475
9
$29,036
6
$82,257
APPLICATIONS APPROVED, NOT ACCEPTED
1
$36,100
8
$87,690
8
$99,678
5
$37,716
1
$88,900
APPLICATIONS DENIED
2
$98,600
20
$87,043
32
$93,869
7
$38,254
3
$94,290
APPLICATIONS WITHDRAWN
0
$0
3
$115,123
20
$125,406
2
$75,165
1
$198,280
FILES CLOSED FOR INCOMPLETENESS
0
$0
2
$102,370
8
$101,160
0
$0
2
$118,535
Aggregated Statistics For Year 1999 (Based on 1 partial tract)
A) FHA, FSA/RHS & VA Home Purchase Loans
B) Conventional Home Purchase Loans
C) Refinancings
D) Home Improvement Loans
F) Non-occupant Loans on < 5 Family Dwellings (A B C & D)
Detailed PMIC statistics for the following Tracts:0410.00
2007 - 2018 National Fire Incident Reporting System (NFIRS) incidents
According to the data from the years 2007 - 2018 the average number of fires per year is 10. The highest number of reported fires - 19 took place in 2013, and the least - 3 in 2007. The data has an increasing trend.
When looking into fire subcategories, the most reports belonged to: Outside Fires (74.8%), and Structure Fires (15.7%).
Fire incident types reported to NFIRS in Zip Code 95918


 Nearest zip codes: 95962, 95977, 95914, 95919, 95946, 95935.


 : $136,422 in 4 contracts from 2000 to 2001


 According to the data from the years 2007 - 2018 the average number of fires per year is 10. The highest number of reported fires - 19 took place in 2013, and the least - 3 in 2007. The data has an increasing trend.
 When looking into fire subcategories, the most reports belonged to: Outside Fires (74.8%), and Structure Fires (15.7%).