Estimated zip code population in 2022: 1,806 Zip code population in 2010: 1,678 Zip code population in 2000: 945
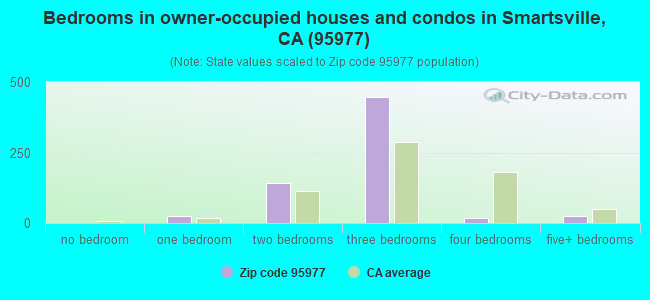
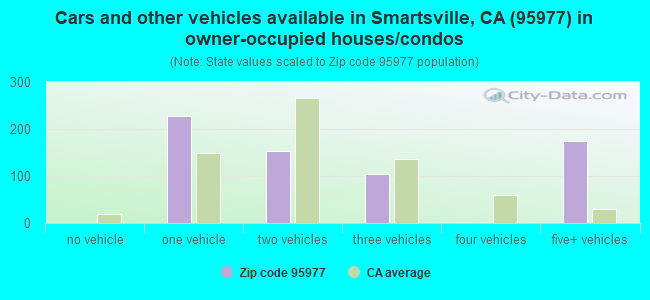
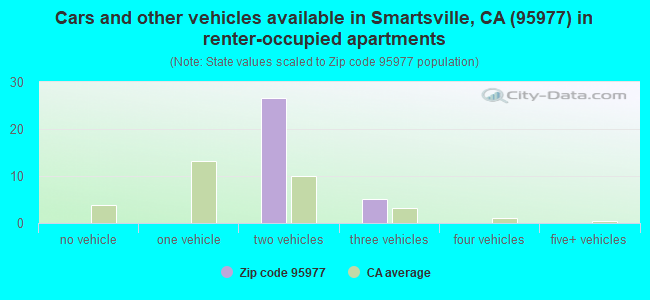
Houses and condos: 822 Renter-occupied apartments: 32
% of renters here:
5%
State:
44%
March 2022 cost of living index in zip code 95977: 93.5 (less than average, U.S. average is 100)
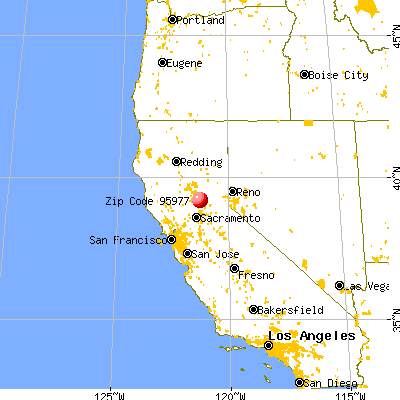
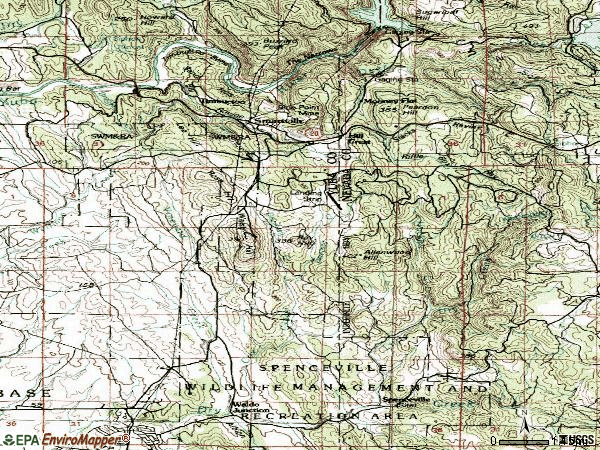
Land area: 39.1 sq. mi. Water area: 0.2 sq. mi.
Population density: 46 people per square mile
(very low).
OSM Map
General Map
Google Map
MSN Map
OSM Map
General Map
Google Map
MSN Map
OSM Map
General Map
Google Map
MSN Map
OSM Map
General Map
Google Map
MSN Map
Please wait while loading the map...
Real estate property taxes paid for housing units in 2022:
This zip code:
0.4% ($2,024)
California:
0.7% ($4,831)
Median real estate property taxes paid for housing units with mortgages in 2022: $2,369 (0.5%) Median real estate property taxes paid for housing units with no mortgage in 2022: $1,835 (0.4%)
Business Search- 14 Million verified businesses
Males: 886
(49.0%)
Females: 920
(51.0%)
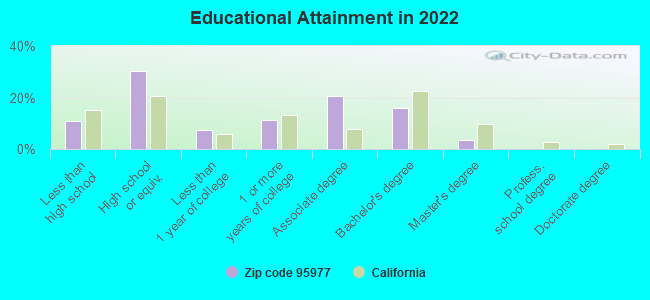
For population 25 years and over in 95977:
High school or higher: 88.5%
Bachelor's degree or higher: 19.7%
Graduate or professional degree: 3.7%
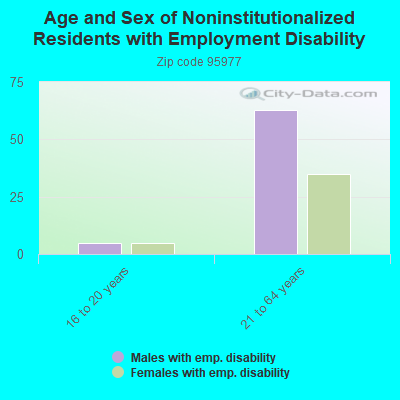
Unemployed: 5.9%
Mean travel time to work (commute): 26.1 minutes
For population 15 years and over in 95977:
Never married: 29.1%
Now married: 55.8%
Separated: 0.0%
Widowed: 8.5%
Divorced: 6.6%
Zip code 95977 compared to state average:
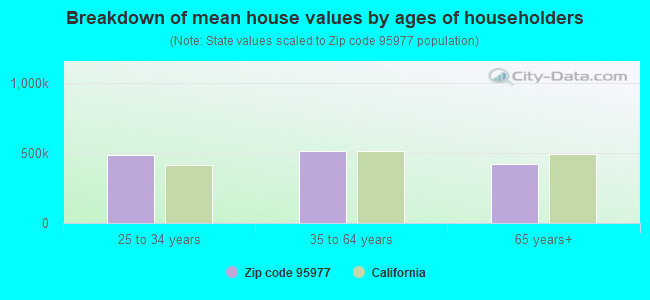
Median house value below state average.
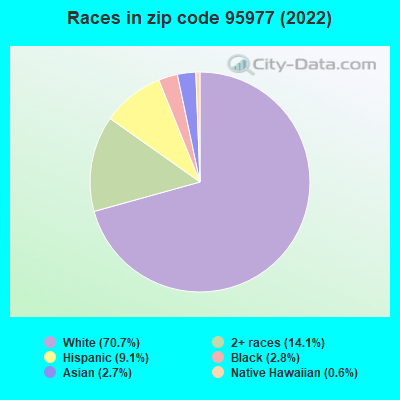
Black race population percentage below state average.
Hispanic race population percentage significantly below state average.
Foreign-born population percentage significantly below state average.
Renting percentage significantly below state average.
Length of stay since moving in significantly below state average.
House age below state average.
Number of college students below state average.
Percentage of population with a bachelor's degree or higher below state average.
Averages for the 2020 tax year for zip code 95977, filed in 2021:
Average Adjusted Gross Income (AGI) in 2020: $61,051 (Individual Income Tax Returns)
Here:
$61,051
State:
$95,910
Salary/wage: $56,720 (reported on 69.4% of returns)
Here:
$56,720
State:
$77,331
(% of AGI for various income ranges: 1035.0% for AGIs below $25k, 3546.2% for AGIs $25k-50k, 6104.3% for AGIs $50k-75k, 9946.0% for AGIs $75k-100k, 17502.0% for AGIs $100k-200k)
Taxable interest for individuals: $167 (reported on 37.5% of returns)
This zip code:
$167
California:
$2,294
(% of AGI for various income ranges: 5.7% for AGIs below $25k, 9.2% for AGIs $25k-50k, 5.7% for AGIs $50k-75k, 16.0% for AGIs $75k-100k, 18.0% for AGIs $100k-200k)
Ordinary dividends: $3,309 (reported on 15.3% of returns)
Here:
$3,309
State:
$10,949
(% of AGI for various income ranges: 32.9% for AGIs below $25k, 51.5% for AGIs $25k-50k, 58.6% for AGIs $50k-75k, 420.0% for AGIs $100k-200k)
Net capital gain/loss in AGI: +$8,150 (reported on 16.7% of returns)
Here:
+$8,150
State:
+$49,306
(% of AGI for various income ranges: 34.6% for AGIs $25k-50k, 198.0% for AGIs $75k-100k, 1682.0% for AGIs $100k-200k)
Profit/loss from business: +$8,894 (reported on 22.2% of returns)
Here:
+$8,894
State:
+$15,671
(% of AGI for various income ranges: 213.6% for AGIs below $25k, 439.2% for AGIs $25k-50k, 312.9% for AGIs $50k-75k, 668.0% for AGIs $100k-200k)
Taxable individual retirement arrangement distribution: $23,560 (reported on 6.9% of returns)
95977:
$23,560
California:
$23,505
(% of AGI for various income ranges: 232.1% for AGIs below $25k, 1218.6% for AGIs $50k-75k)
Total itemized deductions: $28,012 (reported on 11.1% of returns)
Here:
$28,012
State:
$39,517
(% of AGI for various income ranges: 1378.6% for AGIs $50k-75k, 2552.0% for AGIs $100k-200k)
Charity contributions: $6,325 (reported on 5.6% of returns)
Here:
$6,325
State:
$12,598
(% of AGI for various income ranges: 30.8% for AGIs $25k-50k, 426.0% for AGIs $100k-200k)
Taxes paid: $7,588 (reported on 11.1% of returns)
95977:
$7,588
State:
$8,807
(% of AGI for various income ranges: 391.4% for AGIs $50k-75k, 666.0% for AGIs $100k-200k)
Earned income credit: $2,475 (reported on 16.7% of returns)
Here:
$2,475
State:
$2,074
(% of AGI for various income ranges: 129.3% for AGIs below $25k, 89.2% for AGIs $25k-50k)
Percentage of individuals using paid preparers for their 2020 taxes: 91.7%
Here:
92%
State:
92%
(% for various income ranges: 91.3% for AGIs below $25k, 89.5% for AGIs $25k-50k, 100.0% for AGIs $50k-75k, 100.0% for AGIs $75k-100k, 88.9% for AGIs $100k-200k, 66.7% for AGIs over 200k)
Averages for the 2012 tax year for zip code 95977, filed in 2013:
Average Adjusted Gross Income (AGI) in 2012: $50,058 (Individual Income Tax Returns)
Here:
$50,058
State:
$72,726
Salary/wage: $43,433 (reported on 74.2% of returns)
Here:
$43,433
State:
$59,079
(% of AGI for various income ranges: 61.2% for AGIs below $25k, 62.1% for AGIs $25k-50k, 67.4% for AGIs $50k-75k, 75.4% for AGIs $75k-100k, 59.1% for AGIs $100k-200k)
Taxable interest for individuals: $320 (reported on 40.3% of returns)
This zip code:
$320
California:
$2,146
(% of AGI for various income ranges: 0.5% for AGIs below $25k, 0.4% for AGIs $25k-50k, 0.3% for AGIs $50k-75k, 0.1% for AGIs $75k-100k, 0.2% for AGIs $100k-200k)
Ordinary dividends: $2,040 (reported on 16.1% of returns)
Here:
$2,040
State:
$9,308
(% of AGI for various income ranges: 0.4% for AGIs below $25k, 0.6% for AGIs $25k-50k, 1.0% for AGIs $50k-75k, 0.9% for AGIs $100k-200k)
Net capital gain/loss in AGI: +$2,150 (reported on 9.7% of returns)
Here:
+$2,150
State:
+$30,460
Profit/loss from business: +$7,671 (reported on 22.6% of returns)
Here:
+$7,671
State:
+$17,064
(% of AGI for various income ranges: 13.6% for AGIs below $25k, 9.0% for AGIs $25k-50k, 3.3% for AGIs $50k-75k)
Taxable individual retirement arrangement distribution: $13,750 (reported on 9.7% of returns)
95977:
$13,750
California:
$19,557
Total itemized deductions: $21,344 (28% of AGI, reported on 43.5% of returns)
Here:
$21,344
State:
$34,004
Here:
28.2% of AGI
State:
22.7% of AGI
(% of AGI for various income ranges: 23.8% for AGIs below $25k, 17.3% for AGIs $25k-50k, 19.8% for AGIs $50k-75k, 20.2% for AGIs $75k-100k, 16.3% for AGIs $100k-200k)
Charity contributions: $2,695 (reported on 30.6% of returns)
Here:
$2,695
State:
$4,659
(% of AGI for various income ranges: 1.8% for AGIs $25k-50k, 1.9% for AGIs $50k-75k, 1.7% for AGIs $75k-100k, 1.9% for AGIs $100k-200k)
Taxes paid: $5,944 (reported on 43.5% of returns)
95977:
$5,944
State:
$14,448
(% of AGI for various income ranges: 3.3% for AGIs below $25k, 3.9% for AGIs $25k-50k, 5.0% for AGIs $50k-75k, 5.2% for AGIs $75k-100k, 6.3% for AGIs $100k-200k)
Earned income credit: $1,917 (reported on 19.4% of returns)
Here:
$1,917
State:
$2,286
(% of AGI for various income ranges: 5.7% for AGIs below $25k, 1.1% for AGIs $25k-50k)
Percentage of individuals using paid preparers for their 2012 taxes: 53.2%
Here:
53%
State:
64%
(% for various income ranges: 40.0% for AGIs below $25k, 57.1% for AGIs $25k-50k, 70.0% for AGIs $50k-75k, 50.0% for AGIs $75k-100k, 71.4% for AGIs $100k-200k)
Averages for the 2004 tax year for zip code 95977, filed in 2005:
Average Adjusted Gross Income (AGI) in 2004: $42,767 (Individual Income Tax Returns)
Here:
$42,767
State:
$58,600
Salary/wage: $40,093 (reported on 78.9% of returns)
Here:
$40,093
State:
$49,455
(% of AGI for various income ranges: 216.5% for AGIs below $10k, 68.0% for AGIs $10k-25k, 76.2% for AGIs $25k-50k, 78.9% for AGIs $50k-75k, 80.1% for AGIs $75k-100k, 61.0% for AGIs over 100k)
Taxable interest for individuals: $757 (reported on 52.0% of returns)
This zip code:
$757
California:
$2,365
(% of AGI for various income ranges: 4.3% for AGIs below $10k, 0.9% for AGIs $10k-25k, 1.3% for AGIs $25k-50k, 0.8% for AGIs $50k-75k, 0.4% for AGIs $75k-100k, 1.0% for AGIs over 100k)
Taxable dividends: $555 (reported on 19.8% of returns)
Here:
$555
State:
$4,746
(% of AGI for various income ranges: 4.9% for AGIs below $10k, 0.7% for AGIs $10k-25k, 0.2% for AGIs $25k-50k, 0.1% for AGIs $50k-75k, 0.1% for AGIs $75k-100k, 0.2% for AGIs over 100k)
Net capital gain/loss: +$5,423 (reported on 16.1% of returns)
Here:
+$5,423
State:
+$23,418
(% of AGI for various income ranges: -4.9% for AGIs below $10k, -0.7% for AGIs $10k-25k, 0.3% for AGIs $25k-50k, -0.2% for AGIs $50k-75k, -0.0% for AGIs $75k-100k, 8.7% for AGIs over 100k)
Profit/loss from business: +$9,418 (reported on 22.3% of returns)
Here:
+$9,418
State:
+$16,826
(% of AGI for various income ranges: 67.1% for AGIs below $10k, 12.5% for AGIs $10k-25k, 2.3% for AGIs $25k-50k, 5.4% for AGIs $50k-75k, 5.7% for AGIs over 100k)
IRA payment deduction: $2,636 (reported on 1.8% of returns)
95977:
$2,636
California:
$3,192
Total itemized deductions: $19,074 (31% of AGI, reported on 51.5% of returns)
Here:
$19,074
State:
$28,113
Here:
31.3% of AGI
State:
25.3% of AGI
(% of AGI for various income ranges: 34.4% for AGIs $10k-25k, 23.1% for AGIs $25k-50k, 22.9% for AGIs $50k-75k, 21.9% for AGIs $75k-100k, 19.9% for AGIs over 100k)
Charity contributions deductions: $1,845 (3% of AGI, reported on 42.9% of returns)
Here:
$1,845
State:
$3,923
Here:
2.9% of AGI
State:
3.3% of AGI
(% of AGI for various income ranges: 1.6% for AGIs $10k-25k, 1.7% for AGIs $25k-50k, 1.7% for AGIs $50k-75k, 1.5% for AGIs $75k-100k, 2.4% for AGIs over 100k)
Total tax: $5,028 (reported on 77.6% of returns)
95977:
$5,028
State:
$10,761
(% of AGI for various income ranges: 17.1% for AGIs below $10k, 5.3% for AGIs $10k-25k, 5.8% for AGIs $25k-50k, 7.8% for AGIs $50k-75k, 9.5% for AGIs $75k-100k, 14.9% for AGIs over 100k)
Earned income credit: $1,343 (reported on 16.4% of returns)
Here:
$1,343
State:
$1,763
Percentage of individuals using paid preparers for their 2004 taxes: 67.6%
Here:
68%
State:
66%
(% for various income ranges: 59.4% for AGIs below $10k, 67.9% for AGIs $10k-25k, 69.6% for AGIs $25k-50k, 69.7% for AGIs $50k-75k, 65.2% for AGIs $75k-100k, 75.0% for AGIs over 100k)
Household received Food Stamps/SNAP in the past 12 months: 17 Household did not receive Food Stamps/SNAP in the past 12 months: 657
Women who did not have a birth in the past 12 months: 404 (247 now married, 153 unmarried)
Housing units in zip code 95977 with a mortgage: 364 (37 second mortgage, 9 both second mortgage and home equity loan) Median monthly owner costs for units with a mortgage: $2,595 Median monthly owner costs for units without a mortgage: $719
Residents with income below the poverty level in 2022:
This zip code:
6.1%
Whole state:
12.2%
Residents with income below 50% of the poverty level in 2022:
This zip code:
4.6%
Whole state:
6.2%
Median number of rooms in houses and condos:
Here:
5.9
State:
6.0
Median number of rooms in apartments:
Here:
4.3
State:
3.9
Notable locations in this zip code not listed on our city pages
Notable locations in zip code 95977: Rose Bar (A), Hill Crest (B), Empire Ranch (C), Smartville Fire Protection District (D). Display/hide their locations on the map
Creeks: Brooks Creek (A), Cox Creek (B), Daugherty Creek (C), Deer Creek (D), Dempsey Creek (E), Hackett Creek (F), Little Dry Creek (G), Vineyard Creek (H), Sanford Creek (I). Display/hide their locations on the map
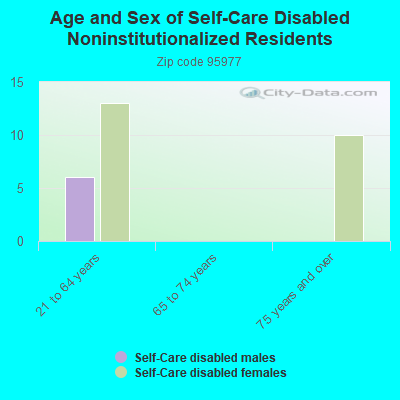
In group quarters: 11 (-1 institutionalized population)
Size of family households: 165 2-persons, 125 3-persons, 64 4-persons, 24 5-persons, 84 6-persons, 14 7-or-more-persons
Size of nonfamily households: 166 1-person, 45 2-persons
275 married couples with children.
6 single-parent households (6 women).
87.4% of residents of 95977 zip code speak English at home.
3.4% of residents speak Spanish at home (85% very well, 15% not at all).
4.9% of residents speak other Indo-European language at home (56% very well, 44% well).
2.6% of residents speak Asian or Pacific Island language at home (49% very well, 51% well).
1.5% of residents speak other language at home (100% very well).
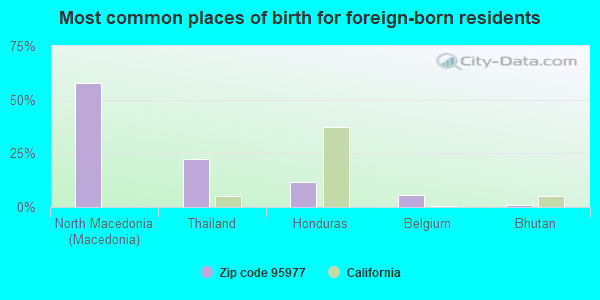
Foreign born population: 112 (6.2%) (92.1% of them are naturalized citizens)
This zip code:
6.2%
Whole state:
26.7%
58%North Macedonia (Macedonia)
23%Thailand
12%Honduras
5%Belgium
1%Bhutan
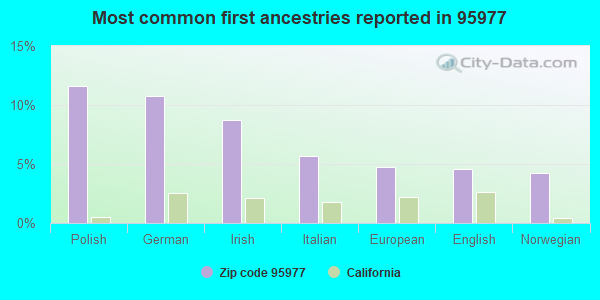
12%Polish
11%German
9%Irish
6%Italian
5%European
5%English
4%Norwegian
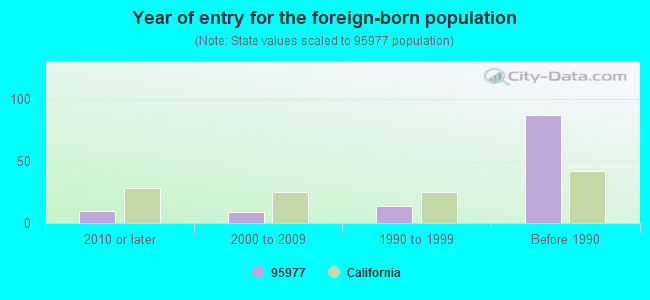
Year of entry for the foreign-born population
102010 or later
92000 to 2009
141990 to 1999
87Before 1990
Facilities with environmental interests located in this zip code:
GOOD SPRINGS RECYCLING & REFINERY INC (8480 BLUE GRAVEL RD in SMARTVILLE, CA)
(Resource Conservation and Recovery Act (tracking hazardous waste))
HAMMONTON GOLD VILLAGE WWTP (HAMMONTON SMARTVILLE RD in SMARTVILLE, CA)
National Pollutant Discharge Elimination System NON-MAJOR (Tracking pollutant discharge elimination systems) - permit Business SIC classification: SEWERAGE SYSTEMS Organizations: RIVER HIGHLANDS CSD (CONTACT/OWNER)
Alternative names: RIVER HIGHLANDS CSD
AGG MATERIAL PROC INC (PARKS BAR BRIDGE AT HWY 20 in SMARTVILLE, CA)
CRITERIA AND HAZARDOUS AIR POLLUTANT INVENTORY (Inventory of air pollution sources) Business SIC classification: CONSTRUCTION SAND AND GRAVEL
NORDIC IND (PARKS BAR QUARRY in SMARTVILLE, CA)
CRITERIA AND HAZARDOUS AIR POLLUTANT INVENTORY (Inventory of air pollution sources) Business SIC classification: CONSTRUCTION SAND AND GRAVEL
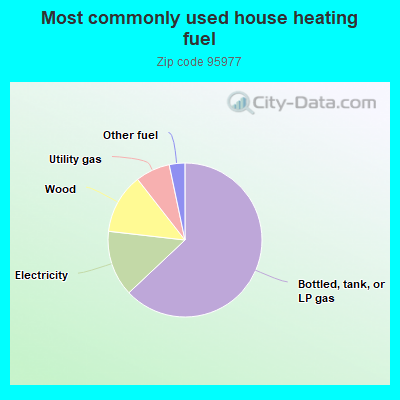
63.3%Bottled, tank, or LP gas
13.9%Electricity
12.7%Wood
7.3%Utility gas
3.3%Other fuel
Population in 1990: 807. Population change in the 1990s: +138 (+17.1%).
Place of birth for U.S.-born residents:
This state: 1,143
Northeast: 71
Midwest: 118
South: 196
West: 137
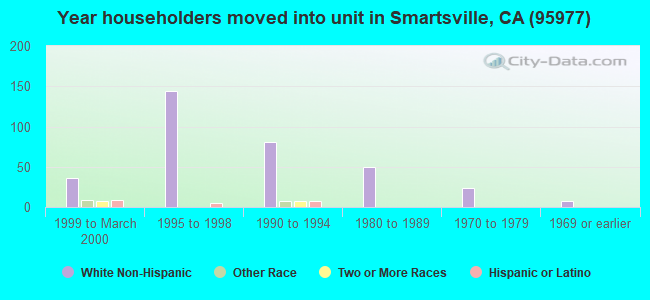
47% of the 95977 zip code residents lived in the same house 5 years ago. Out of people who lived in different houses, 35% lived in this county. Out of people who lived in different counties, 50% lived in California.
87% of the 95977 zip code residents lived in the same house 1 year ago. Out of people who lived in different houses, 9% moved from this county. Out of people who lived in different houses, 34% moved from different county within same state. Out of people who lived in different houses, 61% moved from different state.
Private vs. public school enrollment:
Students in private schools in grades 1 to 8 (elementary and middle school):
Here:
0.0%
California:
10.5%
Students in private schools in grades 9 to 12 (high school): 15
Here:
14.8%
California:
8.5%
Students in private undergraduate colleges: 13
Here:
45.7%
California:
15.9%
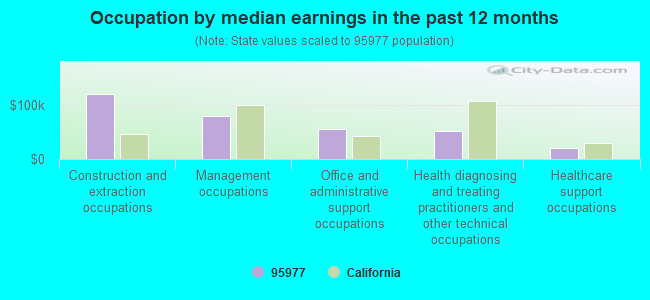
Occupation by median earnings in the past 12 months ($)
121,577Construction and extraction occupations
80,469Management occupations
55,076Office and administrative support occupations
51,950Health diagnosing and treating practitioners and other technical occupations
21,249Healthcare support occupations
Companies with federal contracts located in this zip code:
EAST WEST INCORPORATED (8348 SMARTVILLE RD in SMARTVILLE, CA; small business) : $229,076 in 24 contractsfrom 2004 to 2006
Contracts for Custodial Janitorial Services, Landscaping/Groundskeeping Services by Army, U.S. Army Corps of Engineers - civil program financing only Signed by year:2000: $0; 2001: $0; 2002: $0; 2003: $0; 2004: $92,720; 2005: $120,648; 2006: $15,708.
Biggest contracts:
$42,324 with Army for Custodial Janitorial Services. Signed on 2005-03-10. Completion date: 2004-09-30.
$42,324 with U.S. Army Corps of Engineers - civil program financing only for Custodial Janitorial Services. Signed on 2005-03-10. Completion date: 2004-09-30.
$42,324, same as above.Signed on 2004-01-08. Completion date: 2004-09-30.
$42,324 with Army for Custodial Janitorial Services. Signed on 2004-01-08. Completion date: 2004-09-30.
WIEHN, GINA A (8465 BLUE GRAVEL RD in SMARTVILLE, CA; small business) : $39,891 in 6 contractsfrom 2005 to 2006
Contracts for Custodial Janitorial Services by Army Signed by year:2000: $0; 2001: $0; 2002: $0; 2003: $0; 2004: $0; 2005: $2,185; 2006: $37,706.
Biggest contracts:
$17,300 with Army for Custodial Janitorial Services. Signed on 2006-04-06. Completion date: 2006-09-30.
$17,293, same as above.Signed on 2006-06-16. Completion date: 2006-09-30.
$3,113, same as above.Signed on 2006-01-13. Completion date: 2006-09-30.
$1,476, same as above.Signed on 2005-11-16. Completion date: 2006-09-30.
Top industries in this zip code by the number of employees in 2005:
Mining: Construction Sand and Gravel Mining (20-49 employees: 1 establishment)
Administrative and Support and Waste Management and Remediation Services: Investigation Services (5-9: 1)
Arts, Entertainment, and Recreation: Marinas (5-9: 1)
Construction: All Other Specialty Trade Contractors (1-4: 2)
Construction: New Single-Family Housing Construction (except Operative Builders) (1-4: 2)
Professional, Scientific, and Technical Services: Engineering Services (1-4: 1)
Construction: Painting and Wall Covering Contractors (1-4: 1)
Other Services (except Public Administration): Automotive Transmission Repair (1-4: 1)
People in group quarters in 2010:
4 people in residential treatment centers for adults
People in group quarters in 2000:
5 people in other noninstitutional group quarters
Fatal accident statistics in 2013:
Fatal accident count: 1
Vehicles involved in fatal accidents: 1
Fatal accidents caused by drunken drivers: 0
Fatalities: 1
Persons involved in fatal accidents: 1
Pedestrians involved in fatal accidents: 0
Fatal accident statistics in 2012:
Fatal accident count: 4
Vehicles involved in fatal accidents: 5
Fatal accidents caused by drunken drivers: 1
Fatalities: 4
Persons involved in fatal accidents: 12
Pedestrians involved in fatal accidents: 0
Home Mortgage Disclosure Act Aggregated Statistics For Year 2009 (Based on 2 partial tracts)
A) FHA, FSA/RHS & VA Home Purchase Loans
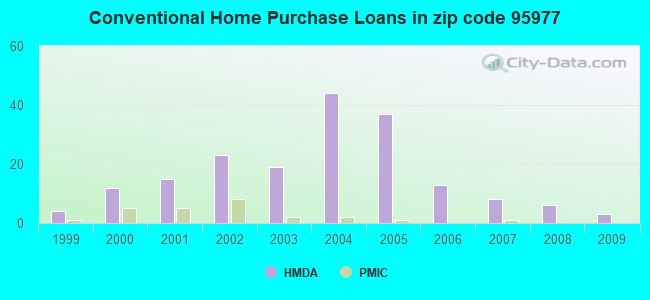
B) Conventional Home Purchase Loans
C) Refinancings
D) Home Improvement Loans
F) Non-occupant Loans on < 5 Family Dwellings (A B C & D)
G) Loans On Manufactured Home Dwelling (A B C & D)
Number
Average Value
Number
Average Value
Number
Average Value
Number
Average Value
Number
Average Value
Number
Average Value
LOANS ORIGINATED
6
$152,448
3
$103,087
12
$209,947
1
$123,070
2
$124,660
2
$264,600
APPLICATIONS APPROVED, NOT ACCEPTED
2
$150,065
1
$125,450
1
$314,420
0
$0
0
$0
0
$0
APPLICATIONS DENIED
3
$179,840
0
$0
11
$239,355
1
$171,500
1
$307,280
3
$155,093
APPLICATIONS WITHDRAWN
1
$185,400
1
$117,510
6
$227,018
0
$0
1
$129,820
0
$0
FILES CLOSED FOR INCOMPLETENESS
0
$0
0
$0
1
$336,660
0
$0
0
$0
0
$0
Aggregated Statistics For Year 2008 (Based on 2 partial tracts)
A) FHA, FSA/RHS & VA Home Purchase Loans
B) Conventional Home Purchase Loans
C) Refinancings
D) Home Improvement Loans
F) Non-occupant Loans on < 5 Family Dwellings (A B C & D)
G) Loans On Manufactured Home Dwelling (A B C & D)
Number
Average Value
Number
Average Value
Number
Average Value
Number
Average Value
Number
Average Value
Number
Average Value
LOANS ORIGINATED
3
$195,987
6
$215,703
6
$270,423
2
$86,350
2
$92,700
2
$151,455
APPLICATIONS APPROVED, NOT ACCEPTED
0
$0
0
$0
2
$264,400
0
$0
0
$0
1
$301,320
APPLICATIONS DENIED
1
$228,670
2
$393,425
16
$244,676
4
$104,410
1
$50,820
4
$89,522
APPLICATIONS WITHDRAWN
1
$231,450
0
$0
5
$216,366
1
$159,990
0
$0
0
$0
FILES CLOSED FOR INCOMPLETENESS
0
$0
1
$430,750
2
$169,520
0
$0
0
$0
0
$0
Aggregated Statistics For Year 2007 (Based on 2 partial tracts)
B) Conventional Home Purchase Loans
C) Refinancings
D) Home Improvement Loans
F) Non-occupant Loans on < 5 Family Dwellings (A B C & D)
G) Loans On Manufactured Home Dwelling (A B C & D)
Number
Average Value
Number
Average Value
Number
Average Value
Number
Average Value
Number
Average Value
LOANS ORIGINATED
8
$252,641
20
$241,574
4
$147,982
1
$470,840
6
$194,067
APPLICATIONS APPROVED, NOT ACCEPTED
2
$315,615
7
$215,457
0
$0
2
$147,485
2
$202,075
APPLICATIONS DENIED
8
$198,351
25
$270,198
6
$115,990
2
$302,515
9
$192,237
APPLICATIONS WITHDRAWN
1
$306,090
9
$225,937
1
$29,380
0
$0
1
$256,460
FILES CLOSED FOR INCOMPLETENESS
2
$65,110
5
$357,380
0
$0
1
$185,800
0
$0
Aggregated Statistics For Year 2006 (Based on 2 partial tracts)
B) Conventional Home Purchase Loans
C) Refinancings
D) Home Improvement Loans
F) Non-occupant Loans on < 5 Family Dwellings (A B C & D)
G) Loans On Manufactured Home Dwelling (A B C & D)
Number
Average Value
Number
Average Value
Number
Average Value
Number
Average Value
Number
Average Value
LOANS ORIGINATED
13
$203,386
38
$244,322
3
$91,973
4
$163,662
5
$148,636
APPLICATIONS APPROVED, NOT ACCEPTED
6
$209,218
10
$288,579
1
$318,000
2
$179,645
1
$274,330
APPLICATIONS DENIED
8
$183,761
27
$291,030
7
$231,451
3
$184,340
6
$150,728
APPLICATIONS WITHDRAWN
8
$179,245
13
$307,065
1
$175,470
1
$245,740
0
$0
FILES CLOSED FOR INCOMPLETENESS
1
$218,750
3
$285,047
0
$0
0
$0
0
$0
Aggregated Statistics For Year 2005 (Based on 2 partial tracts)
B) Conventional Home Purchase Loans
C) Refinancings
D) Home Improvement Loans
F) Non-occupant Loans on < 5 Family Dwellings (A B C & D)
G) Loans On Manufactured Home Dwelling (A B C & D)
Number
Average Value
Number
Average Value
Number
Average Value
Number
Average Value
Number
Average Value
LOANS ORIGINATED
37
$217,985
46
$230,795
7
$127,834
6
$181,495
5
$203,026
APPLICATIONS APPROVED, NOT ACCEPTED
5
$164,200
6
$266,387
1
$115,130
0
$0
1
$48,040
APPLICATIONS DENIED
17
$291,048
30
$255,271
12
$130,845
1
$331,500
6
$169,387
APPLICATIONS WITHDRAWN
10
$188,734
23
$245,640
4
$183,810
1
$172,700
2
$218,550
FILES CLOSED FOR INCOMPLETENESS
1
$134,580
6
$233,303
0
$0
0
$0
0
$0
Aggregated Statistics For Year 2004 (Based on 2 partial tracts)
A) FHA, FSA/RHS & VA Home Purchase Loans
B) Conventional Home Purchase Loans
C) Refinancings
D) Home Improvement Loans
F) Non-occupant Loans on < 5 Family Dwellings (A B C & D)
G) Loans On Manufactured Home Dwelling (A B C & D)
Number
Average Value
Number
Average Value
Number
Average Value
Number
Average Value
Number
Average Value
Number
Average Value
LOANS ORIGINATED
6
$194,597
44
$167,092
37
$183,135
6
$106,065
7
$155,284
5
$197,388
APPLICATIONS APPROVED, NOT ACCEPTED
0
$0
7
$157,723
9
$164,756
0
$0
1
$123,860
3
$165,153
APPLICATIONS DENIED
0
$0
15
$168,037
26
$189,812
8
$111,110
2
$128,035
5
$109,176
APPLICATIONS WITHDRAWN
2
$176,665
10
$175,633
19
$192,336
3
$196,913
2
$154,630
5
$201,438
FILES CLOSED FOR INCOMPLETENESS
0
$0
1
$300,130
7
$224,021
1
$29,780
0
$0
0
$0
Aggregated Statistics For Year 2003 (Based on 2 partial tracts)
B) Conventional Home Purchase Loans
C) Refinancings
D) Home Improvement Loans
F) Non-occupant Loans on < 5 Family Dwellings (A B C & D)
Number
Average Value
Number
Average Value
Number
Average Value
Number
Average Value
LOANS ORIGINATED
19
$161,704
75
$152,475
3
$27,790
4
$123,268
APPLICATIONS APPROVED, NOT ACCEPTED
5
$125,928
11
$147,540
1
$42,880
0
$0
APPLICATIONS DENIED
13
$117,878
26
$167,015
4
$22,332
2
$204,850
APPLICATIONS WITHDRAWN
3
$206,970
21
$134,659
0
$0
1
$120,290
FILES CLOSED FOR INCOMPLETENESS
0
$0
5
$189,686
0
$0
0
$0
Aggregated Statistics For Year 2002 (Based on 2 partial tracts)
A) FHA, FSA/RHS & VA Home Purchase Loans
B) Conventional Home Purchase Loans
C) Refinancings
D) Home Improvement Loans
F) Non-occupant Loans on < 5 Family Dwellings (A B C & D)
Number
Average Value
Number
Average Value
Number
Average Value
Number
Average Value
Number
Average Value
LOANS ORIGINATED
2
$160,190
23
$141,884
35
$143,714
3
$31,760
2
$86,150
APPLICATIONS APPROVED, NOT ACCEPTED
0
$0
3
$91,840
5
$139,586
1
$6,350
1
$56,370
APPLICATIONS DENIED
1
$165,550
5
$90,358
19
$105,331
1
$25,810
0
$0
APPLICATIONS WITHDRAWN
0
$0
4
$141,232
16
$135,824
1
$24,220
0
$0
FILES CLOSED FOR INCOMPLETENESS
0
$0
0
$0
3
$167,403
0
$0
0
$0
Aggregated Statistics For Year 2001 (Based on 2 partial tracts)
A) FHA, FSA/RHS & VA Home Purchase Loans
B) Conventional Home Purchase Loans
C) Refinancings
D) Home Improvement Loans
F) Non-occupant Loans on < 5 Family Dwellings (A B C & D)
Number
Average Value
Number
Average Value
Number
Average Value
Number
Average Value
Number
Average Value
LOANS ORIGINATED
4
$123,368
15
$105,258
32
$125,551
3
$40,363
2
$83,570
APPLICATIONS APPROVED, NOT ACCEPTED
0
$0
2
$134,185
4
$64,710
0
$0
0
$0
APPLICATIONS DENIED
0
$0
4
$90,418
17
$119,894
3
$14,557
2
$68,285
APPLICATIONS WITHDRAWN
0
$0
2
$137,960
9
$113,410
0
$0
0
$0
FILES CLOSED FOR INCOMPLETENESS
0
$0
0
$0
6
$100,705
0
$0
0
$0
Aggregated Statistics For Year 2000 (Based on 2 partial tracts)
A) FHA, FSA/RHS & VA Home Purchase Loans
B) Conventional Home Purchase Loans
C) Refinancings
D) Home Improvement Loans
F) Non-occupant Loans on < 5 Family Dwellings (A B C & D)
Number
Average Value
Number
Average Value
Number
Average Value
Number
Average Value
Number
Average Value
LOANS ORIGINATED
7
$107,530
12
$113,012
10
$101,037
2
$21,635
1
$90,520
APPLICATIONS APPROVED, NOT ACCEPTED
1
$123,070
4
$94,882
2
$83,765
1
$35,730
0
$0
APPLICATIONS DENIED
0
$0
16
$93,221
9
$68,549
4
$27,295
0
$0
APPLICATIONS WITHDRAWN
0
$0
3
$105,733
6
$93,957
1
$15,880
0
$0
FILES CLOSED FOR INCOMPLETENESS
0
$0
2
$214,180
2
$114,335
0
$0
0
$0
Aggregated Statistics For Year 1999 (Based on 1 partial tract)
A) FHA, FSA/RHS & VA Home Purchase Loans
B) Conventional Home Purchase Loans
C) Refinancings
D) Home Improvement Loans
F) Non-occupant Loans on < 5 Family Dwellings (A B C & D)
Detailed PMIC statistics for the following Tracts:0409.01
2003 - 2018 National Fire Incident Reporting System (NFIRS) incidents
Based on the data from the years 2003 - 2018 the average number of fires per year is 14. The highest number of reported fires - 26 took place in 2007, and the least - 0 in 2004. The data has a growing trend.
When looking into fire subcategories, the most incidents belonged to: Outside Fires (88.4%), and Structure Fires (6.0%).
Fire incident types reported to NFIRS in Zip Code 95977


 Nearest zip codes: 95946, 95903, 95918, 95975, 95962, 95692.
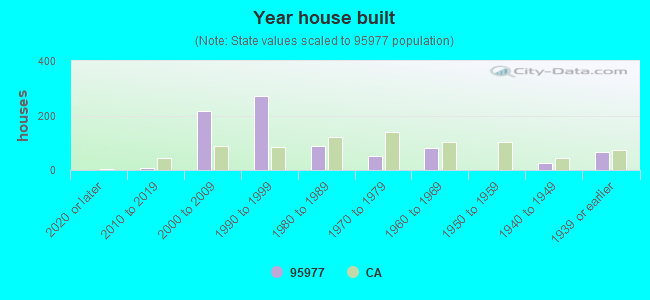


 Based on the data from the years 2003 - 2018 the average number of fires per year is 14. The highest number of reported fires - 26 took place in 2007, and the least - 0 in 2004. The data has a growing trend.
 When looking into fire subcategories, the most incidents belonged to: Outside Fires (88.4%), and Structure Fires (6.0%).