Estimated zip code population in 2022: 4,651 Zip code population in 2010: 4,574 Zip code population in 2000: 4,582
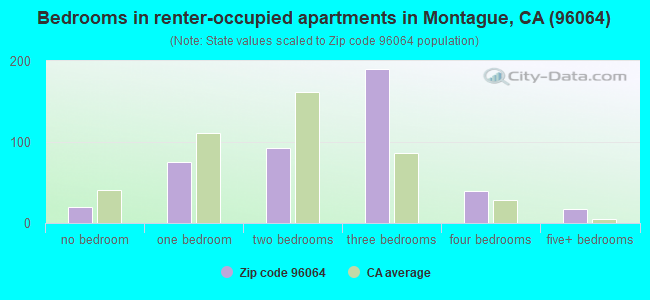
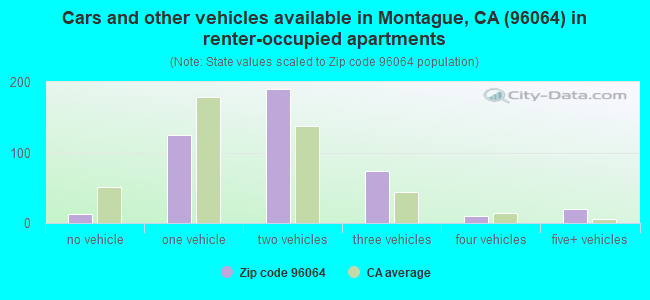
Houses and condos: 2,097 Renter-occupied apartments: 433
% of renters here:
24%
State:
44%
March 2022 cost of living index in zip code 96064: 94.0 (less than average, U.S. average is 100)
Land area: 479.1 sq. mi. Water area: 3.5 sq. mi.
Population density: 10 people per square mile
(very low).
OSM Map
General Map
Google Map
MSN Map
OSM Map
General Map
Google Map
MSN Map
OSM Map
General Map
Google Map
MSN Map
OSM Map
General Map
Google Map
MSN Map
Please wait while loading the map...
Real estate property taxes paid for housing units in 2022:
This zip code:
0.7% ($1,831)
California:
0.7% ($4,831)
Median real estate property taxes paid for housing units with mortgages in 2022: $2,147 (0.8%) Median real estate property taxes paid for housing units with no mortgage in 2022: $1,549 (0.7%)
Business Search- 14 Million verified businesses
Males: 2,315
(49.8%)
Females: 2,335
(50.2%)
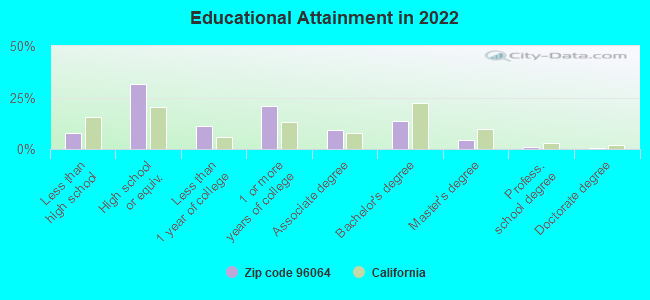
For population 25 years and over in 96064:
High school or higher: 91.5%
Bachelor's degree or higher: 19.2%
Graduate or professional degree: 5.9%
Unemployed: 4.9%
Mean travel time to work (commute): 24.7 minutes
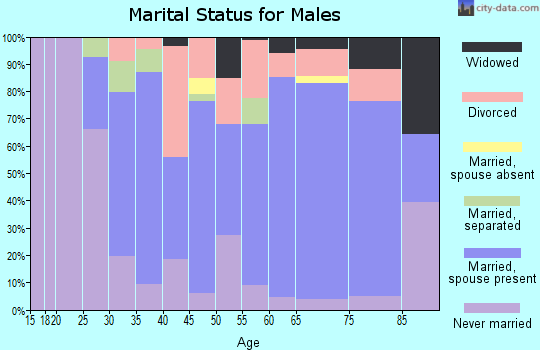
For population 15 years and over in 96064:
Never married: 23.1%
Now married: 54.6%
Separated: 1.7%
Widowed: 7.3%
Divorced: 13.3%
Zip code 96064 compared to state average:
Median household income below state average.
Median house value significantly below state average.
Black race population percentage significantly below state average.
Hispanic race population percentage significantly below state average.
Median age significantly above state average.
Foreign-born population percentage significantly below state average.
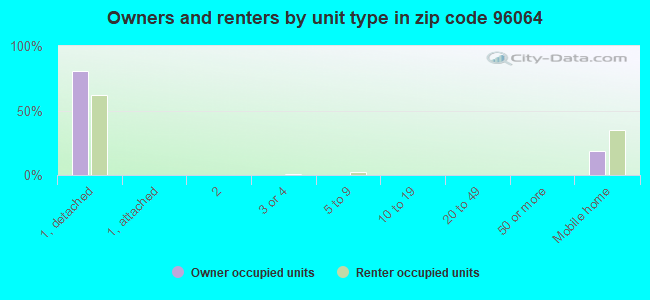
Renting percentage below state average.
Length of stay since moving in significantly above state average.
Number of college students below state average.
Percentage of population with a bachelor's degree or higher below state average.
Averages for the 2020 tax year for zip code 96064, filed in 2021:
Average Adjusted Gross Income (AGI) in 2020: $52,912 (Individual Income Tax Returns)
Here:
$52,912
State:
$95,910
Salary/wage: $45,746 (reported on 73.1% of returns)
Here:
$45,746
State:
$77,331
(% of AGI for various income ranges: 1126.2% for AGIs below $25k, 3512.0% for AGIs $25k-50k, 6500.7% for AGIs $50k-75k, 8785.0% for AGIs $75k-100k, 16098.0% for AGIs $100k-200k)
Taxable interest for individuals: $1,337 (reported on 33.3% of returns)
This zip code:
$1,337
California:
$2,294
(% of AGI for various income ranges: 18.6% for AGIs below $25k, 21.1% for AGIs $25k-50k, 40.7% for AGIs $50k-75k, 85.0% for AGIs $75k-100k, 400.0% for AGIs $100k-200k)
Ordinary dividends: $4,253 (reported on 17.5% of returns)
Here:
$4,253
State:
$10,949
(% of AGI for various income ranges: 46.2% for AGIs below $25k, 71.4% for AGIs $25k-50k, 80.0% for AGIs $50k-75k, 85.8% for AGIs $75k-100k, 640.0% for AGIs $100k-200k)
Net capital gain/loss in AGI: +$12,600 (reported on 17.0% of returns)
Here:
+$12,600
State:
+$49,306
(% of AGI for various income ranges: 20.5% for AGIs below $25k, 51.1% for AGIs $25k-50k, 136.4% for AGIs $50k-75k, 379.2% for AGIs $75k-100k, 1110.0% for AGIs $100k-200k)
Profit/loss from business: +$14,633 (reported on 15.8% of returns)
Here:
+$14,633
State:
+$15,671
(% of AGI for various income ranges: 150.5% for AGIs below $25k, 136.6% for AGIs $25k-50k, 646.4% for AGIs $50k-75k, 406.7% for AGIs $75k-100k, 1523.0% for AGIs $100k-200k)
Taxable individual retirement arrangement distribution: $11,233 (reported on 8.8% of returns)
96064:
$11,233
California:
$23,505
(% of AGI for various income ranges: 60.8% for AGIs below $25k, 71.4% for AGIs $25k-50k, 370.0% for AGIs $50k-75k, 692.0% for AGIs $100k-200k)
Total itemized deductions: $27,075 (reported on 4.7% of returns)
Here:
$27,075
State:
$39,517
(% of AGI for various income ranges: 846.4% for AGIs $50k-75k, 981.0% for AGIs $100k-200k)
Charity contributions: $5,967 (reported on 3.5% of returns)
Here:
$5,967
State:
$12,598
(% of AGI for various income ranges: 102.1% for AGIs $50k-75k, 215.0% for AGIs $100k-200k)
Taxes paid: $7,229 (reported on 4.1% of returns)
96064:
$7,229
State:
$8,807
(% of AGI for various income ranges: 155.7% for AGIs $50k-75k, 288.0% for AGIs $100k-200k)
Earned income credit: $2,073 (reported on 17.5% of returns)
Here:
$2,073
State:
$2,074
(% of AGI for various income ranges: 95.1% for AGIs below $25k, 77.1% for AGIs $25k-50k)
Percentage of individuals using paid preparers for their 2020 taxes: 94.2%
Here:
94%
State:
92%
(% for various income ranges: 89.8% for AGIs below $25k, 93.9% for AGIs $25k-50k, 95.8% for AGIs $50k-75k, 100.0% for AGIs $75k-100k, 100.0% for AGIs $100k-200k, 100.0% for AGIs over 200k)
Averages for the 2012 tax year for zip code 96064, filed in 2013:
Average Adjusted Gross Income (AGI) in 2012: $41,822 (Individual Income Tax Returns)
Here:
$41,822
State:
$72,726
Salary/wage: $34,782 (reported on 75.3% of returns)
Here:
$34,782
State:
$59,079
(% of AGI for various income ranges: 62.2% for AGIs below $25k, 66.3% for AGIs $25k-50k, 68.4% for AGIs $50k-75k, 65.8% for AGIs $75k-100k, 51.8% for AGIs $100k-200k)
Taxable interest for individuals: $1,610 (reported on 38.6% of returns)
This zip code:
$1,610
California:
$2,146
(% of AGI for various income ranges: 1.9% for AGIs below $25k, 1.1% for AGIs $25k-50k, 2.8% for AGIs $50k-75k, 0.4% for AGIs $75k-100k, 1.2% for AGIs $100k-200k)
Ordinary dividends: $4,464 (reported on 17.7% of returns)
Here:
$4,464
State:
$9,308
(% of AGI for various income ranges: 2.1% for AGIs below $25k, 1.8% for AGIs $25k-50k, 1.3% for AGIs $50k-75k, 1.1% for AGIs $75k-100k, 2.9% for AGIs $100k-200k)
Net capital gain/loss in AGI: +$8,623 (reported on 16.5% of returns)
Here:
+$8,623
State:
+$30,460
(% of AGI for various income ranges: 1.3% for AGIs $25k-50k, 2.0% for AGIs $50k-75k, 1.7% for AGIs $75k-100k, 9.8% for AGIs $100k-200k)
Profit/loss from business: +$8,675 (reported on 17.7% of returns)
Here:
+$8,675
State:
+$17,064
(% of AGI for various income ranges: 8.3% for AGIs below $25k, 5.7% for AGIs $25k-50k, 1.8% for AGIs $50k-75k, 5.0% for AGIs $75k-100k)
Taxable individual retirement arrangement distribution: $12,088 (reported on 10.1% of returns)
96064:
$12,088
California:
$19,557
(% of AGI for various income ranges: 5.0% for AGIs below $25k, 2.6% for AGIs $25k-50k, 2.5% for AGIs $50k-75k, 6.4% for AGIs $75k-100k)
Total itemized deductions: $19,293 (26% of AGI, reported on 25.9% of returns)
Here:
$19,293
State:
$34,004
Here:
25.9% of AGI
State:
22.7% of AGI
(% of AGI for various income ranges: 13.2% for AGIs below $25k, 9.4% for AGIs $25k-50k, 12.0% for AGIs $50k-75k, 12.6% for AGIs $75k-100k, 13.4% for AGIs $100k-200k)
Charity contributions: $2,660 (reported on 19.0% of returns)
Here:
$2,660
State:
$4,659
(% of AGI for various income ranges: 0.4% for AGIs below $25k, 0.9% for AGIs $25k-50k, 1.2% for AGIs $50k-75k, 1.5% for AGIs $75k-100k, 1.8% for AGIs $100k-200k)
Taxes paid: $5,671 (reported on 25.9% of returns)
96064:
$5,671
State:
$14,448
(% of AGI for various income ranges: 1.8% for AGIs below $25k, 1.8% for AGIs $25k-50k, 3.0% for AGIs $50k-75k, 3.9% for AGIs $75k-100k, 6.2% for AGIs $100k-200k)
Earned income credit: $2,165 (reported on 21.5% of returns)
Here:
$2,165
State:
$2,286
(% of AGI for various income ranges: 6.9% for AGIs below $25k, 1.1% for AGIs $25k-50k)
Percentage of individuals using paid preparers for their 2012 taxes: 53.2%
Here:
53%
State:
64%
(% for various income ranges: 48.5% for AGIs below $25k, 54.5% for AGIs $25k-50k, 58.3% for AGIs $50k-75k, 50.0% for AGIs $75k-100k, 70.0% for AGIs $100k-200k)
Averages for the 2004 tax year for zip code 96064, filed in 2005:
Average Adjusted Gross Income (AGI) in 2004: $33,319 (Individual Income Tax Returns)
Here:
$33,319
State:
$58,600
Salary/wage: $30,976 (reported on 75.6% of returns)
Here:
$30,976
State:
$49,455
(% of AGI for various income ranges: 65.3% for AGIs $10k-25k, 75.3% for AGIs $25k-50k, 75.7% for AGIs $50k-75k, 67.1% for AGIs $75k-100k, 39.6% for AGIs over 100k)
Taxable interest for individuals: $1,982 (reported on 49.0% of returns)
This zip code:
$1,982
California:
$2,365
(% of AGI for various income ranges: 4.7% for AGIs $10k-25k, 1.9% for AGIs $25k-50k, 1.7% for AGIs $50k-75k, 1.3% for AGIs $75k-100k, 5.0% for AGIs over 100k)
Taxable dividends: $1,729 (reported on 22.2% of returns)
Here:
$1,729
State:
$4,746
(% of AGI for various income ranges: 1.9% for AGIs $10k-25k, 0.6% for AGIs $25k-50k, 0.8% for AGIs $50k-75k, 0.5% for AGIs $75k-100k, 1.8% for AGIs over 100k)
Net capital gain/loss: +$9,444 (reported on 21.7% of returns)
Here:
+$9,444
State:
+$23,418
(% of AGI for various income ranges: 1.8% for AGIs $10k-25k, 1.5% for AGIs $25k-50k, 2.4% for AGIs $50k-75k, 4.7% for AGIs $75k-100k, 22.8% for AGIs over 100k)
Profit/loss from business: +$10,655 (reported on 19.5% of returns)
Here:
+$10,655
State:
+$16,826
(% of AGI for various income ranges: 6.8% for AGIs $10k-25k, 4.3% for AGIs $25k-50k, 3.2% for AGIs $50k-75k, 6.9% for AGIs $75k-100k, 11.3% for AGIs over 100k)
IRA payment deduction: $3,140 (reported on 3.5% of returns)
96064:
$3,140
California:
$3,192
Total itemized deductions: $16,085 (26% of AGI, reported on 25.1% of returns)
Here:
$16,085
State:
$28,113
Here:
26.4% of AGI
State:
25.3% of AGI
(% of AGI for various income ranges: 12.2% for AGIs $10k-25k, 11.6% for AGIs $25k-50k, 11.7% for AGIs $50k-75k, 14.0% for AGIs $75k-100k, 11.0% for AGIs over 100k)
Charity contributions deductions: $2,187 (3% of AGI, reported on 19.7% of returns)
Here:
$2,187
State:
$3,923
Here:
3.4% of AGI
State:
3.3% of AGI
(% of AGI for various income ranges: 1.0% for AGIs $10k-25k, 1.3% for AGIs $25k-50k, 1.1% for AGIs $50k-75k, 1.7% for AGIs $75k-100k, 1.4% for AGIs over 100k)
Total tax: $4,222 (reported on 72.9% of returns)
96064:
$4,222
State:
$10,761
(% of AGI for various income ranges: 4.1% for AGIs $10k-25k, 6.0% for AGIs $25k-50k, 8.6% for AGIs $50k-75k, 11.1% for AGIs $75k-100k, 17.3% for AGIs over 100k)
Earned income credit: $1,537 (reported on 17.6% of returns)
Here:
$1,537
State:
$1,763
Percentage of individuals using paid preparers for their 2004 taxes: 62.4%
Here:
62%
State:
66%
(% for various income ranges: 59.5% for AGIs below $10k, 60.0% for AGIs $10k-25k, 62.7% for AGIs $25k-50k, 65.1% for AGIs $50k-75k, 67.4% for AGIs $75k-100k, 78.9% for AGIs over 100k)
Likely homosexual households (counted as self-reported same-sex unmarried-partner households)
Lesbian couples: 0.4% of all households
Gay men: 0.7% of all households
Household received Food Stamps/SNAP in the past 12 months: 244 Household did not receive Food Stamps/SNAP in the past 12 months: 1,583
Women who had a birth in the past 12 months: 40 (16 now married, 24 unmarried) Women who did not have a birth in the past 12 months: 781 (393 now married, 384 unmarried)
Housing units in zip code 96064 with a mortgage: 692 (40 second mortgage, 1 home equity loan, 15 both second mortgage and home equity loan) Houses without a mortgage: 12
Median monthly owner costs for units with a mortgage: $1,381 Median monthly owner costs for units without a mortgage: $458
Residents with income below the poverty level in 2022:
This zip code:
15.2%
Whole state:
12.2%
Residents with income below 50% of the poverty level in 2022:
This zip code:
7.6%
Whole state:
6.2%
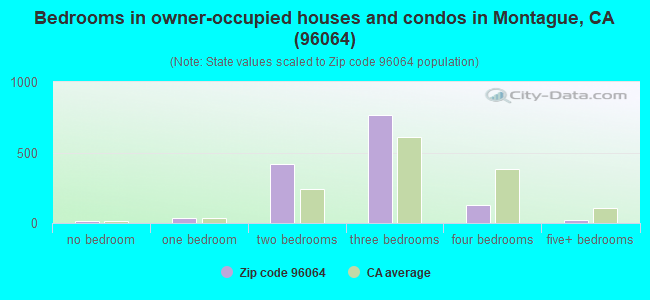
Median number of rooms in houses and condos:
Here:
5.6
State:
6.0
Median number of rooms in apartments:
Here:
4.7
State:
3.9
Notable locations in this zip code not listed on our city pages
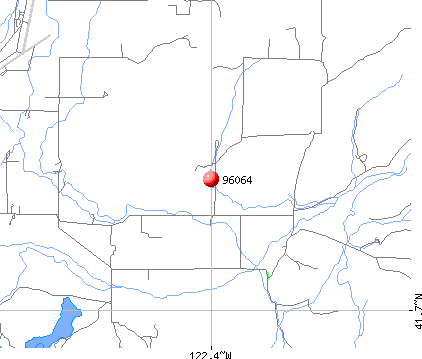
Notable locations in zip code 96064: Spannaus Ranch (A), Buckley (B), York (C), Copco Substation (D), Shake Camp (E), Oak Grove School (F), Lema (G), Terwilliger Walters (H), Williams (I), Davis (J), Old Schmidt Sawmill (K), Kegg (L), Hart (M), Martin (N), Sylva (O), Sylva Brothers (P), Old White Mill (Q), Barba (R), Iron Gate Fish Hatchery (S), Lakeview Lookout (T). Display/hide their locations on the map
Lakes, reservoirs, and swamps: Cedar Lake (A), Cloak Lake (B), Salt Lake (C), Copco Lake (D), Trout Lake (E), Steamboat Lake (F), Big Springs Lake (G), Bass Lake (H). Display/hide their locations on the map
Streams, rivers, and creeks: Deer Creek (A), Edge Creek (B), Indian Creek (C), Iron Creek (D), Milk Creek (E), Little Springs Creek (F), Hole in the Ground Creek (G), Big Springs Creek (H), Steep Trail Creek (I). Display/hide their locations on the map
In group quarters: 38 (-1 institutionalized population)
Size of family households: 642 2-persons, 219 3-persons, 130 4-persons, 124 5-persons, 47 6-persons, 34 7-or-more-persons
Size of nonfamily households: 496 1-person, 132 2-persons, 9 3-persons
760 married couples with children.
181 single-parent households (78 men, 103 women).
90.8% of residents of 96064 zip code speak English at home.
5.6% of residents speak Spanish at home (63% very well, 24% well, 7% not well, 6% not at all).
1.9% of residents speak other Indo-European language at home (69% very well, 13% well, 18% not well).
0.7% of residents speak Asian or Pacific Island language at home (30% very well, 10% well, 60% not well).
0.8% of residents speak other language at home (100% very well).
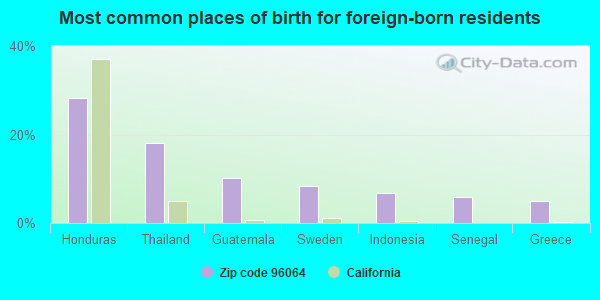
Foreign born population: 205 (4.4%) (49.5% of them are naturalized citizens)
This zip code:
4.4%
Whole state:
26.7%
28%Honduras
18%Thailand
10%Guatemala
8%Sweden
7%Indonesia
6%Senegal
5%Greece
26%English
11%American
5%German
4%Irish
4%Portuguese
3%European
3%Italian
Year of entry for the foreign-born population
592010 or later
142000 to 2009
241990 to 1999
135Before 1990
Facilities with environmental interests located in this zip code:
LITTLE SHASTA ELEMENTARY (8409 LOWER LITTLE SHASTA ROAD in MONTAGUE, CA)
(National Center for Education Statistics) - STATE ID-6050835
MONTAGUE COMMUNITY DAY (430 E. PRATHER ROAD in MONTAGUE, CA)
(National Center for Education Statistics) - STATE ID-6115075 Organizations: MONTAGUE ELEMENTARY (SCHOOL DISTRICT)
MONTAGUE ELEMENTARY (430 E PRATHER ST in MONTAGUE, CA)
(National Center for Education Statistics) - STATE ID-6050876
ELK METAL PRODUCTS (217 SOUTH 17TH in MONTAGUE, CA)
Small Quantity Generators, between 100 kg and 1000 kg of hazardous waste/month (Resource Conservation and Recovery Act (tracking hazardous waste))
Housing units lacking complete plumbing facilities: 2.7% Housing units lacking complete kitchen facilities: 1.7%
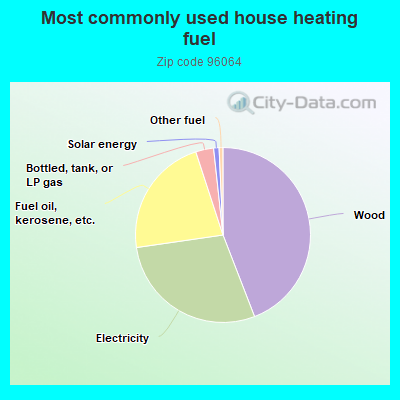
44.0%Wood
28.5%Electricity
22.2%Fuel oil, kerosene, etc.
3.3%Bottled, tank, or LP gas
1.0%Solar energy
0.7%Other fuel
Population in 1990: 4,246. Population change in the 1990s: +336 (+7.9%).
Place of birth for U.S.-born residents:
This state: 2,996
Northeast: 183
Midwest: 167
South: 292
West: 740
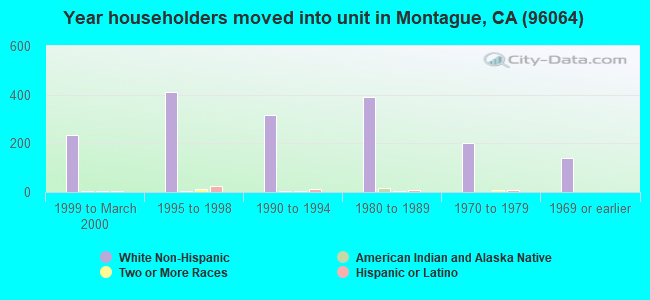
60% of the 96064 zip code residents lived in the same house 5 years ago. Out of people who lived in different houses, 64% lived in this county. Out of people who lived in different counties, 50% lived in California.
90% of the 96064 zip code residents lived in the same house 1 year ago. Out of people who lived in different houses, 28% moved from this county. Out of people who lived in different houses, 37% moved from different county within same state. Out of people who lived in different houses, 38% moved from different state.
Private vs. public school enrollment:
Students in private schools in grades 1 to 8 (elementary and middle school): 49
Here:
9.3%
California:
10.5%
Students in private schools in grades 9 to 12 (high school): 25
Here:
13.9%
California:
8.5%
Students in private undergraduate colleges: 17
Here:
17.3%
California:
15.9%
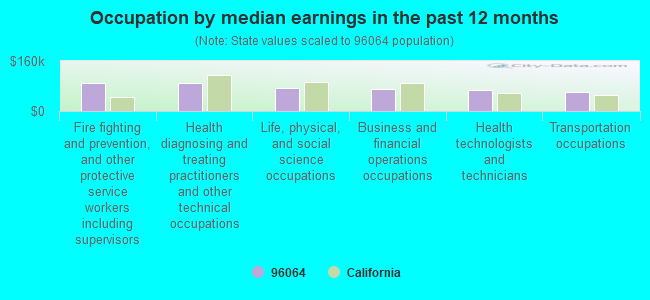
Occupation by median earnings in the past 12 months ($)
90,797Fire fighting and prevention, and other protective service workers including supervisors
88,280Health diagnosing and treating practitioners and other technical occupations
73,379Life, physical, and social science occupations
70,444Business and financial operations occupations
67,503Health technologists and technicians
60,086Transportation occupations
Top industries in this zip code by the number of employees in 2005:
Other Services (except Public Administration): Commercial and Industrial Machinery and Equipment (except Automotive and Electronic) Repair and Maintenance (10-19 employees: 1 establishment)
Administrative and Support and Waste Management and Remediation Services: Janitorial Services (5-9: 2)
Construction: New Single-Family Housing Construction (except Operative Builders) (5-9: 1, 1-4: 3)
Accommodation and Food Services: Full-Service Restaurants (5-9: 1, 1-4: 1)
Construction: Plumbing, Heating, and Air-Conditioning Contractors (5-9: 1)
People in group quarters in 2010:
18 people in workers' group living quarters and job corps centers
People in group quarters in 2000:
74 people in other noninstitutional group quarters
14 people in homes for the mentally ill
13 people in religious group quarters
9 people in other group homes
5 people in homes or halfway houses for drug/alcohol abuse
3 people in nursing homes
3 people in homes for the mentally retarded
Fatal accident statistics in 2014:
Fatal accident count: 1
Vehicles involved in fatal accidents: 1
Fatal accidents caused by drunken drivers: 1
Fatalities: 1
Persons involved in fatal accidents: 2
Pedestrians involved in fatal accidents: 0
Fatal accident statistics in 2011:
Fatal accident count: 1
Vehicles involved in fatal accidents: 1
Fatal accidents caused by drunken drivers: 1
Fatalities: 1
Persons involved in fatal accidents: 1
Pedestrians involved in fatal accidents: 0
2004 - 2018 National Fire Incident Reporting System (NFIRS) incidents
Based on the data from the years 2004 - 2018 the average number of fires per year is 32. The highest number of fire incidents - 53 took place in 2015, and the least - 7 in 2004. The data has a rising trend.
When looking into fire subcategories, the most incidents belonged to: Outside Fires (68.9%), and Structure Fires (21.6%).
Fire incident types reported to NFIRS in Zip Code 96064

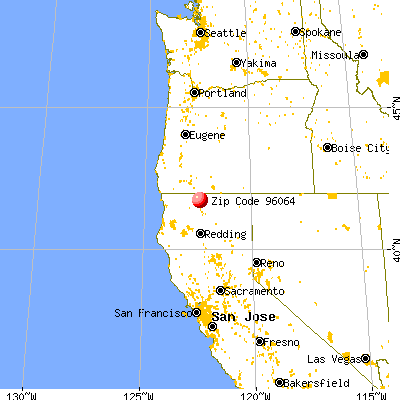


 Nearest zip codes: 96044, 96038, 96097, 96094, 96034, 96067.


 Based on the data from the years 2004 - 2018 the average number of fires per year is 32. The highest number of fire incidents - 53 took place in 2015, and the least - 7 in 2004. The data has a rising trend.
 When looking into fire subcategories, the most incidents belonged to: Outside Fires (68.9%), and Structure Fires (21.6%).