Estimated zip code population in 2022: 7,301 Zip code population in 2010: 6,691 Zip code population in 2000: 6,706
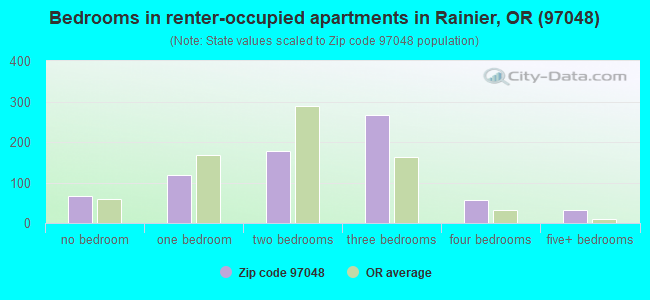
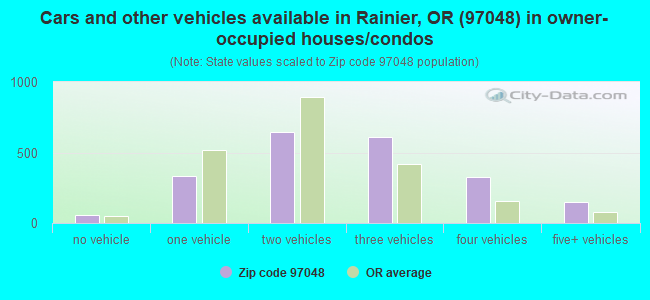
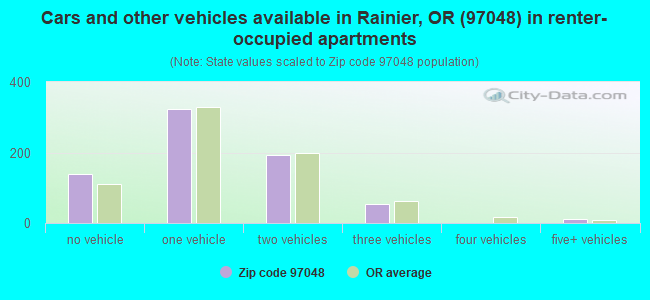
Houses and condos: 3,162 Renter-occupied apartments: 722
% of renters here:
25%
State:
37%
March 2022 cost of living index in zip code 97048: 92.9 (less than average, U.S. average is 100)
Land area: 83.5 sq. mi. Water area: 7.6 sq. mi.
Population density: 87 people per square mile
(very low).
OSM Map
General Map
Google Map
MSN Map
OSM Map
General Map
Google Map
MSN Map
OSM Map
General Map
Google Map
MSN Map
OSM Map
General Map
Google Map
MSN Map
Please wait while loading the map...
Real estate property taxes paid for housing units in 2022:
This zip code:
0.6% ($2,405)
Oregon:
0.8% ($3,646)
Median real estate property taxes paid for housing units with mortgages in 2022: $2,438 (0.6%) Median real estate property taxes paid for housing units with no mortgage in 2022: $2,345 (0.7%)
Business Search- 14 Million verified businesses
Males: 3,716
(50.9%)
Females: 3,585
(49.1%)
For population 25 years and over in 97048:
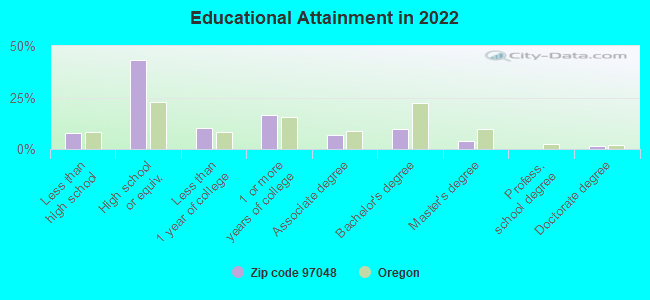
High school or higher: 91.6%
Bachelor's degree or higher: 15.1%
Graduate or professional degree: 5.2%
Unemployed: 4.9%
Mean travel time to work (commute): 34.8 minutes
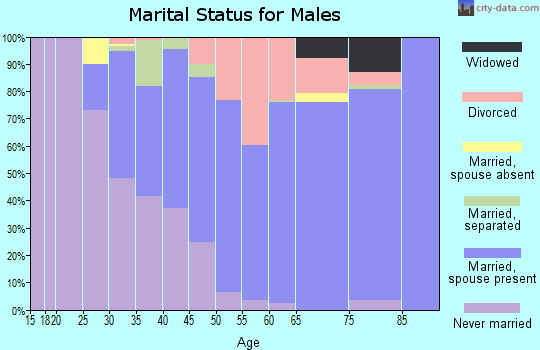
For population 15 years and over in 97048:
Never married: 23.6%
Now married: 55.8%
Separated: 1.8%
Widowed: 5.3%
Divorced: 13.5%
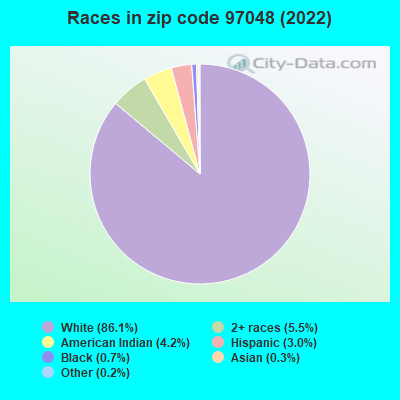
Zip code 97048 compared to state average:
Black race population percentage below state average.
Hispanic race population percentage significantly below state average.
Median age above state average.
Foreign-born population percentage significantly below state average.
Length of stay since moving in significantly above state average.
Number of college students below state average.
Percentage of population with a bachelor's degree or higher significantly below state average.
Averages for the 2020 tax year for zip code 97048, filed in 2021:
Average Adjusted Gross Income (AGI) in 2020: $60,032 (Individual Income Tax Returns)
Here:
$60,032
State:
$76,001
Salary/wage: $53,061 (reported on 74.8% of returns)
Here:
$53,061
State:
$61,959
(% of AGI for various income ranges: 1078.2% for AGIs below $25k, 3254.8% for AGIs $25k-50k, 6077.4% for AGIs $50k-75k, 8925.8% for AGIs $75k-100k, 17665.2% for AGIs $100k-200k)
Taxable interest for individuals: $864 (reported on 37.2% of returns)
This zip code:
$864
Oregon:
$1,628
(% of AGI for various income ranges: 14.8% for AGIs below $25k, 37.3% for AGIs $25k-50k, 28.8% for AGIs $50k-75k, 73.8% for AGIs $75k-100k, 97.2% for AGIs $100k-200k)
Ordinary dividends: $4,465 (reported on 13.3% of returns)
Here:
$4,465
State:
$7,165
(% of AGI for various income ranges: 24.7% for AGIs below $25k, 19.1% for AGIs $25k-50k, 39.4% for AGIs $50k-75k, 92.9% for AGIs $75k-100k, 254.8% for AGIs $100k-200k)
Net capital gain/loss in AGI: +$13,526 (reported on 14.0% of returns)
Here:
+$13,526
State:
+$23,403
(% of AGI for various income ranges: 7.7% for AGIs below $25k, 10.4% for AGIs $25k-50k, 103.2% for AGIs $50k-75k, 93.3% for AGIs $75k-100k, 808.0% for AGIs $100k-200k)
Profit/loss from business: +$9,758 (reported on 11.0% of returns)
Here:
+$9,758
State:
+$16,511
(% of AGI for various income ranges: 79.5% for AGIs below $25k, 97.7% for AGIs $25k-50k, 200.6% for AGIs $50k-75k, 223.7% for AGIs $75k-100k, 371.6% for AGIs $100k-200k)
Taxable individual retirement arrangement distribution: $18,029 (reported on 12.6% of returns)
97048:
$18,029
Oregon:
$20,730
(% of AGI for various income ranges: 75.3% for AGIs below $25k, 173.6% for AGIs $25k-50k, 285.6% for AGIs $50k-75k, 550.4% for AGIs $75k-100k, 1236.0% for AGIs $100k-200k)
Total itemized deductions: $26,232 (reported on 9.3% of returns)
Here:
$26,232
State:
$31,050
(% of AGI for various income ranges: 218.4% for AGIs $25k-50k, 347.1% for AGIs $50k-75k, 521.7% for AGIs $75k-100k, 1172.4% for AGIs $100k-200k)
Charity contributions: $5,659 (reported on 5.6% of returns)
Here:
$5,659
State:
$8,791
(% of AGI for various income ranges: 13.2% for AGIs below $25k, 38.8% for AGIs $50k-75k, 40.0% for AGIs $75k-100k, 258.8% for AGIs $100k-200k)
Taxes paid: $7,896 (reported on 9.0% of returns)
97048:
$7,896
State:
$8,487
(% of AGI for various income ranges: 47.9% for AGIs $25k-50k, 102.1% for AGIs $50k-75k, 159.6% for AGIs $75k-100k, 372.0% for AGIs $100k-200k)
Earned income credit: $2,079 (reported on 12.6% of returns)
Here:
$2,079
State:
$1,977
(% of AGI for various income ranges: 67.1% for AGIs below $25k, 62.0% for AGIs $25k-50k)
Percentage of individuals using paid preparers for their 2020 taxes: 92.4%
Here:
92%
State:
93%
(% for various income ranges: 92.5% for AGIs below $25k, 91.8% for AGIs $25k-50k, 91.7% for AGIs $50k-75k, 94.3% for AGIs $75k-100k, 91.3% for AGIs $100k-200k, 100.0% for AGIs over 200k)
Averages for the 2012 tax year for zip code 97048, filed in 2013:
Average Adjusted Gross Income (AGI) in 2012: $50,230 (Individual Income Tax Returns)
Here:
$50,230
State:
$57,845
Salary/wage: $45,440 (reported on 77.3% of returns)
Here:
$45,440
State:
$47,723
(% of AGI for various income ranges: 62.4% for AGIs below $25k, 69.5% for AGIs $25k-50k, 71.7% for AGIs $50k-75k, 75.0% for AGIs $75k-100k, 84.1% for AGIs $100k-200k)
Taxable interest for individuals: $1,097 (reported on 37.9% of returns)
This zip code:
$1,097
Oregon:
$1,848
(% of AGI for various income ranges: 1.8% for AGIs below $25k, 0.9% for AGIs $25k-50k, 0.9% for AGIs $50k-75k, 0.6% for AGIs $75k-100k, 0.6% for AGIs $100k-200k, 0.6% for AGIs over 200k)
Ordinary dividends: $2,426 (reported on 14.1% of returns)
Here:
$2,426
State:
$5,987
(% of AGI for various income ranges: 1.4% for AGIs below $25k, 0.7% for AGIs $25k-50k, 0.6% for AGIs $50k-75k, 0.5% for AGIs $75k-100k, 0.8% for AGIs $100k-200k)
Net capital gain/loss in AGI: +$5,141 (reported on 13.8% of returns)
Here:
+$5,141
State:
+$13,095
(% of AGI for various income ranges: 0.5% for AGIs below $25k, 0.2% for AGIs $25k-50k, 0.4% for AGIs $50k-75k, 4.8% for AGIs $100k-200k)
Profit/loss from business: +$6,980 (reported on 13.0% of returns)
Here:
+$6,980
State:
+$13,871
(% of AGI for various income ranges: 3.9% for AGIs below $25k, 2.5% for AGIs $25k-50k, 2.3% for AGIs $50k-75k, 0.8% for AGIs $75k-100k, 1.5% for AGIs $100k-200k)
Taxable individual retirement arrangement distribution: $15,243 (reported on 13.8% of returns)
97048:
$15,243
Oregon:
$16,036
(% of AGI for various income ranges: 4.7% for AGIs below $25k, 5.4% for AGIs $25k-50k, 4.3% for AGIs $50k-75k, 4.2% for AGIs $75k-100k, 4.0% for AGIs $100k-200k)
Total itemized deductions: $19,833 (25% of AGI, reported on 38.3% of returns)
Here:
$19,833
State:
$24,430
Here:
24.6% of AGI
State:
23.2% of AGI
(% of AGI for various income ranges: 15.3% for AGIs below $25k, 12.4% for AGIs $25k-50k, 13.2% for AGIs $50k-75k, 16.5% for AGIs $75k-100k, 17.7% for AGIs $100k-200k, 13.4% for AGIs over 200k)
Charity contributions: $2,473 (reported on 27.9% of returns)
Here:
$2,473
State:
$3,648
(% of AGI for various income ranges: 0.8% for AGIs below $25k, 1.1% for AGIs $25k-50k, 1.5% for AGIs $50k-75k, 1.3% for AGIs $75k-100k, 1.8% for AGIs $100k-200k, 1.1% for AGIs over 200k)
Taxes paid: $7,394 (reported on 37.5% of returns)
97048:
$7,394
State:
$10,269
(% of AGI for various income ranges: 2.4% for AGIs below $25k, 3.5% for AGIs $25k-50k, 4.5% for AGIs $50k-75k, 6.3% for AGIs $75k-100k, 7.6% for AGIs $100k-200k, 7.3% for AGIs over 200k)
Earned income credit: $1,952 (reported on 16.4% of returns)
Here:
$1,952
State:
$2,021
(% of AGI for various income ranges: 5.4% for AGIs below $25k, 0.9% for AGIs $25k-50k)
Percentage of individuals using paid preparers for their 2012 taxes: 48.3%
Here:
48%
State:
47%
(% for various income ranges: 40.6% for AGIs below $25k, 49.2% for AGIs $25k-50k, 55.6% for AGIs $50k-75k, 53.1% for AGIs $75k-100k, 53.6% for AGIs $100k-200k, 66.7% for AGIs over 200k)
Averages for the 2004 tax year for zip code 97048, filed in 2005:
Average Adjusted Gross Income (AGI) in 2004: $39,767 (Individual Income Tax Returns)
Here:
$39,767
State:
$46,788
Salary/wage: $38,521 (reported on 81.2% of returns)
Here:
$38,521
State:
$39,788
(% of AGI for various income ranges: 150.6% for AGIs below $10k, 64.0% for AGIs $10k-25k, 77.1% for AGIs $25k-50k, 83.2% for AGIs $50k-75k, 87.6% for AGIs $75k-100k, 66.1% for AGIs over 100k)
Taxable interest for individuals: $1,301 (reported on 47.8% of returns)
This zip code:
$1,301
Oregon:
$2,126
(% of AGI for various income ranges: 8.6% for AGIs below $10k, 3.2% for AGIs $10k-25k, 1.2% for AGIs $25k-50k, 1.2% for AGIs $50k-75k, 0.6% for AGIs $75k-100k, 2.4% for AGIs over 100k)
Taxable dividends: $1,225 (reported on 15.8% of returns)
Here:
$1,225
State:
$3,427
(% of AGI for various income ranges: 4.1% for AGIs below $10k, 1.1% for AGIs $10k-25k, 0.6% for AGIs $25k-50k, 0.4% for AGIs $50k-75k, 0.2% for AGIs $75k-100k, 0.3% for AGIs over 100k)
Net capital gain/loss: +$7,534 (reported on 14.7% of returns)
Here:
+$7,534
State:
+$12,447
(% of AGI for various income ranges: -0.4% for AGIs below $10k, 0.4% for AGIs $10k-25k, 0.5% for AGIs $25k-50k, 0.9% for AGIs $50k-75k, 2.1% for AGIs $75k-100k, 11.5% for AGIs over 100k)
Profit/loss from business: +$4,019 (reported on 13.4% of returns)
Here:
+$4,019
State:
+$11,682
(% of AGI for various income ranges: 1.0% for AGIs below $10k, 5.1% for AGIs $10k-25k, 0.9% for AGIs $25k-50k, 1.2% for AGIs $50k-75k, 0.1% for AGIs $75k-100k, 1.4% for AGIs over 100k)
IRA payment deduction: $2,800 (reported on 2.4% of returns)
97048:
$2,800
Oregon:
$3,035
(% of AGI for various income ranges: 0.3% for AGIs $10k-25k, 0.2% for AGIs $25k-50k, 0.2% for AGIs $50k-75k, 0.2% for AGIs $75k-100k)
Self-employed pension: $13,200 (reported on 0.4% of returns)
Here:
$13,200
Oregon:
$14,224
Total itemized deductions: $16,513 (26% of AGI, reported on 41.1% of returns)
Here:
$16,513
State:
$20,209
Here:
26.3% of AGI
State:
24.7% of AGI
(% of AGI for various income ranges: 24.0% for AGIs below $10k, 13.6% for AGIs $10k-25k, 14.9% for AGIs $25k-50k, 18.4% for AGIs $50k-75k, 19.1% for AGIs $75k-100k, 16.9% for AGIs over 100k)
Charity contributions deductions: $1,947 (3% of AGI, reported on 32.1% of returns)
Here:
$1,947
State:
$3,145
Here:
3.0% of AGI
State:
3.6% of AGI
(% of AGI for various income ranges: 1.6% for AGIs below $10k, 1.2% for AGIs $10k-25k, 1.2% for AGIs $25k-50k, 1.4% for AGIs $50k-75k, 2.1% for AGIs $75k-100k, 2.0% for AGIs over 100k)
Total tax: $4,486 (reported on 74.1% of returns)
97048:
$4,486
State:
$7,148
(% of AGI for various income ranges: 3.1% for AGIs below $10k, 3.9% for AGIs $10k-25k, 6.2% for AGIs $25k-50k, 8.1% for AGIs $50k-75k, 9.0% for AGIs $75k-100k, 13.9% for AGIs over 100k)
Earned income credit: $1,513 (reported on 14.2% of returns)
Here:
$1,513
State:
$1,605
Percentage of individuals using paid preparers for their 2004 taxes: 49.4%
Here:
49%
State:
53%
(% for various income ranges: 37.4% for AGIs below $10k, 48.1% for AGIs $10k-25k, 50.8% for AGIs $25k-50k, 52.6% for AGIs $50k-75k, 58.6% for AGIs $75k-100k, 64.5% for AGIs over 100k)
Household received Food Stamps/SNAP in the past 12 months: 519 Household did not receive Food Stamps/SNAP in the past 12 months: 2,346
Women who had a birth in the past 12 months: 51 (32 now married, 19 unmarried) Women who did not have a birth in the past 12 months: 1,252 (683 now married, 557 unmarried)
Housing units in zip code 97048 with a mortgage: 1,252 (44 second mortgage, 41 both second mortgage and home equity loan) Median monthly owner costs for units with a mortgage: $1,577 Median monthly owner costs for units without a mortgage: $512
Residents with income below the poverty level in 2022:
This zip code:
16.1%
Whole state:
12.1%
Residents with income below 50% of the poverty level in 2022:
This zip code:
10.8%
Whole state:
6.2%
Median number of rooms in houses and condos:
Here:
6.4
State:
6.2
Median number of rooms in apartments:
Here:
4.8
State:
4.0
Notable locations in this zip code not listed on our city pages
Notable locations in zip code 97048: Fern Hill (A), Rainier Sewage Treatment Plant (B), Fernhill School (C), Trojan (D), West Rainier (E), Rainier City Boat Launch (F), Portland General Electric Trojan Park (G), Scipio's Goble Landing Boat Launch (H), Rainier Transit Center Park and Ride (I), Rainier Transit Center (J), Avon (K), Columbia River Fire and Rescue Rainier Station (L), Columbia River Fire and Rescue Fernhill Station (M), Columbia River Fire and Rescue Goble (N), Clatskanie Rural Fire Delena Station (O), Prescott City Hall (P), Rainier City Hall (Q), Rainier Public Works (R), Rainier Municipal Court (S), Rainier City Library (T). Display/hide their locations on the map
Streams, rivers, and creeks: Piedmont Creek (A), Falls Creek (B), Buck Creek (C), Carr Slough (D), Elk Creek (E), Endicott Creek (F), Fox Creek (G), Goble Creek (H), Jack Falls (I). Display/hide their locations on the map
Parks in zip code 97048 include: Hudson Country Park (1), Laurel Beach County Park (2), Prescott Beach County Park (3). Display/hide their locations on the map
758 married couples with children.
299 single-parent households (104 men, 195 women).
96.7% of residents of 97048 zip code speak English at home.
1.2% of residents speak Spanish at home (48% very well, 22% not well, 30% not at all).
1.7% of residents speak other Indo-European language at home (100% very well).
0.6% of residents speak Asian or Pacific Island language at home (85% very well, 15% not well).
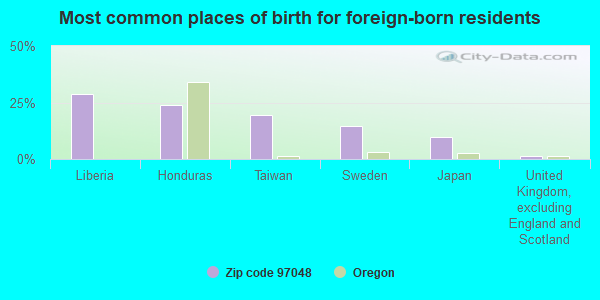
Foreign born population: 83 (1.1%) (40.5% of them are naturalized citizens)
This zip code:
1.1%
Whole state:
9.9%
29%Liberia
24%Honduras
19%Taiwan
14%Sweden
10%Japan
1%United Kingdom, excluding England and Scotland
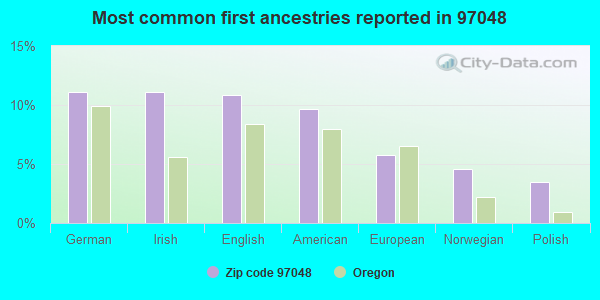
11%German
11%Irish
11%English
10%American
6%European
5%Norwegian
3%Polish
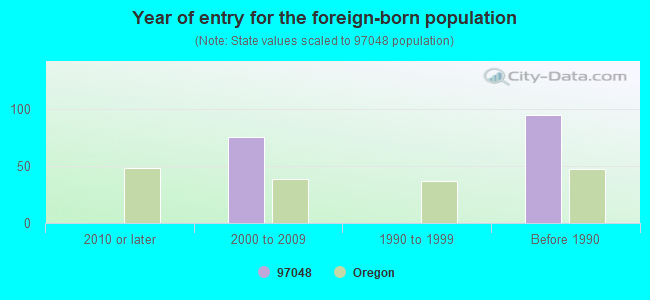
Year of entry for the foreign-born population
02010 or later
762000 to 2009
01990 to 1999
95Before 1990
Facilities with environmental interests located in this zip code:
CONRAD WOOD PRESERVING CO (29175 DIKE RD. in RAINIER, OR)
ENFORCEMENT/COMPLIANCE ACTIVITY (Integrated Compliance Information System) CRITERIA AND HAZARDOUS AIR POLLUTANT INVENTORY (Inventory of air pollution sources) STATE MASTER (Oregon inspections and permits database) - OR-SIS-110480-16333, NPDES STORMWATER PERMIT, OR-SIS-110480-101910, NPDES NON-MAJOR, ACSIS-50007-, AIR PROGRAM STATE MASTER (Oregon inspections and permits database) - OR-UST-BFKBF, LEAKING STORAGE TANK National Pollutant Discharge Elimination System NON-MAJOR (Tracking pollutant discharge elimination systems) - permit Small Quantity Generators, between 100 kg and 1000 kg of hazardous waste/month (Resource Conservation and Recovery Act (tracking hazardous waste)) - notification TRI REPORTER (Tracking of toxic chemicals releasing facilities) Business SIC classification: WOOD PRESERVING Business NAICS classification: WOOD PRESERVATION.; WOOD PRESERVATION. Organizations: CONRAD WOOD PRESERVING CO. (CONTACT/OPERATOR)
, CONRAD WOOD PRESERVING COMPANY (CONTACT/OWNER)
, CONRAD WOOD PRESERVING CO. (CONTACT/OWNER)
COLUMBIA AUTO RECYCLING AND SALES (28710 DIKE ROAD in RAINIER, OR)
STATE MASTER (Oregon inspections and permits database) - OR-HWMS-4840, CESQG Conditionally Exempt Small Quantity Generators, less than 100 kg/month of hazardous waste (Resource Conservation and Recovery Act (tracking hazardous waste)) - notification Business SIC classification: AUTOMOBILES AND OTHER MOTOR VEHICLES Organizations: BERYL JACKSON EQUIPMENT CO INC (CONTACT/ HAZARDOUS WASTE)
, COLUMBIA AUTO RECYCLING & SALES (CONTACT/ HAZARDOUS WASTE)
, JEFF HINKLE (CONTACT/OWNER)
, RIBELIN & HINKLE (HAZARDOUS WASTE LAND OWNER)
, BERYL JACKSON EQUIPMENT CO INC (HAZARDOUS WASTE LEGAL OWNER)
, COLUMBIA AUTO RECYCLING & SALES (HAZARDOUS WASTE OPERATOR)
Alternative names: BERYL JACKSON EQUIP CO, BERYL JACKSON EQUIPMENT CO INC, NORTHWEST TRUCK PARTS
CONRAD WOOD PRESERVING COMPANY (29175 DIKE ROAD in RAINIER, OR)
STATE MASTER (Oregon inspections and permits database) - OR-LUST-05-95-0265, LEAKING STORAGE TANK, OR-HWMS-5650, CESQG HAZARDOUS WASTE BIENNIAL REPORTER (Resource Conservation and Recovery Act (tracking hazardous waste)) (Resource Conservation and Recovery Act (tracking hazardous waste)) Business SIC classification: SAWMILLS AND PLANING MILLS, GENERAL Business NAICS classification: SAWMILLS.; SAWMILLS.; CUT STOCK, RESAWING LUMBER, AND PLANING.; OTHER MILLWORK (INCLUDING FLOORING ).; ALL OTHER MISCELLANEOUS WOOD PRODUCT MANUFACTURING. Organizations: FORT JAMES CORPORATION (CONTACT/ HAZARDOUS WASTE)
, JAMES RIVER CORPORATION (CONTACT/GENERAL)
Alternative names: FORT JAMES CORP RAINIER SAWMILL, FORT JAMES CORP RAINIER SAWMILL
FOSS MARITIME CO (611 A ST E in RAINIER, OR)
STATE MASTER (Oregon inspections and permits database) - OR-HWMS-2279, SQG Conditionally Exempt Small Quantity Generators, less than 100 kg/month of hazardous waste (Resource Conservation and Recovery Act (tracking hazardous waste)) Business SIC classification: TOWING AND TUGBOAT SERVICES Organizations: FOSS RAINIER CO (CONTACT/ HAZARDOUS WASTE)
, BRIX MARITIME CO DBA FOSS MARITIME CO (CONTACT/OPERATOR)
, FOSS MARITIME COMPANY (HAZARDOUS WASTE LAND OWNER)
, BRIX MARITIME CO DBA FOSS MARITIME CO (HAZARDOUS WASTE OPERATOR)
, FOSS RAINIER CO (HAZARDOUS WASTE SITE CONTACT)
Alternative names: BRIX MARITIME CO DBA FOSS MARITIME CO
COMMUNITY ACTION TEAM COL PAC HEAD START (108 W B ST in RAINIER, OR)
STATE MASTER (Oregon inspections and permits database) - HWMS-2918-, CESQG (Resource Conservation and Recovery Act (tracking hazardous waste)) Business SIC classification: ADMINISTRATION OF SOCIAL, HUMAN RESOURCE AND INCOME MAINTENANCE PROGRAMS Organizations: COMMUNITY ACTION TEAM INC (CONTACT/ HAZARDOUS WASTE)
COOPER OIL (75719 ROCK CREST ST in RAINIER, OR)
ENFORCEMENT/COMPLIANCE ACTIVITY (Integrated Compliance Information System) STATE MASTER (Oregon inspections and permits database) - OR-UST-BKDGG, LEAKING STORAGE TANK, OR-UST-BKDGH, OR-UST-BKDGJ, Organizations: TRUAX CORPORATION (CONTACT/GENERAL)
, HARRIS ENTERPRISES, INC. (CONTACT/GENERAL)
, PRIDE OF OREGON STATIONS INC (CONTACT/GENERAL)
, COOPER OIL INC (CONTACT/OWNER)
HUDSON PARK ELEM. SCHOOL (28176 OLD RAINIER RD in RAINIER, OR)
(National Center for Education Statistics) - STATE ID-171 Organizations: COLUMBIA CO SCH DIST 13 (SCHOOL DISTRICT)
COLLISION SERVICE INC (73962 COLUMBIA RIVER HWY in RAINIER, OR)
(Resource Conservation and Recovery Act (tracking hazardous waste)) Alternative names: CARS COLLISION INC
COLUMBIA COUNTY TRANSMISSION (74232 LOWER COLUMBIA RIVER HWY in RAINIER, OR)
(Resource Conservation and Recovery Act (tracking hazardous waste))
Housing units lacking complete plumbing facilities: 3.0% Housing units lacking complete kitchen facilities: 3.0%
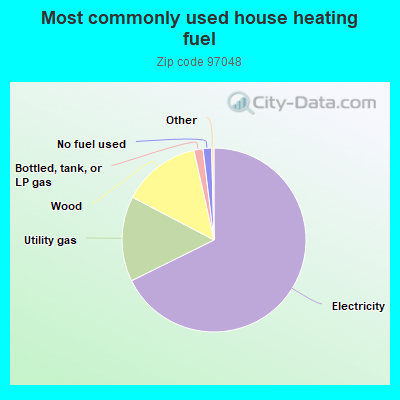
67.7%Electricity
15.0%Utility gas
13.8%Wood
1.6%Bottled, tank, or LP gas
1.5%No fuel used
Population in 1990: 6,357. Population change in the 1990s: +349 (+5.5%).
Place of birth for U.S.-born residents:
This state: 2,598
Northeast: 226
Midwest: 509
South: 337
West: 3,475
61% of the 97048 zip code residents lived in the same house 5 years ago. Out of people who lived in different houses, 52% lived in this county. Out of people who lived in different counties, 50% lived in Oregon.
89% of the 97048 zip code residents lived in the same house 1 year ago. Out of people who lived in different houses, 25% moved from this county. Out of people who lived in different houses, 18% moved from different county within same state. Out of people who lived in different houses, 52% moved from different state. Out of people who lived in different houses, 6% moved from abroad.
Private vs. public school enrollment:
Students in private schools in grades 1 to 8 (elementary and middle school): 51
Here:
8.4%
Oregon:
13.7%
Students in private schools in grades 9 to 12 (high school): 33
Here:
11.0%
Oregon:
8.8%
Students in private undergraduate colleges: 7
Here:
5.9%
Oregon:
17.7%
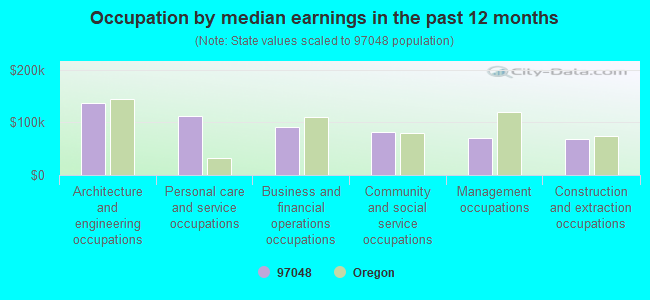
Occupation by median earnings in the past 12 months ($)
136,347Architecture and engineering occupations
111,855Personal care and service occupations
92,005Business and financial operations occupations
81,290Community and social service occupations
70,789Management occupations
68,583Construction and extraction occupations
Companies with federal contracts located in this zip code:
MORE POWER COMPUTERS INC (107 FIRST ST in RAINIER, OR; small business) : $9,620 in 2 contractsfrom 2004 to 2005
$7,030 with Navy for ADP Support Equipment. Signed on 2004-04-09. Completion date: 2004-09-30.
$2,590 with Navy for ADP Central Processing Unit (CPU, Computer), Digital. Signed on 2005-05-24. Completion date: 2005-06-03.
Top industries in this zip code by the number of employees in 2005:
Health Care and Social Assistance: Offices of Dentists (10-19 employees: 1 establishment, 5-9 employees: 1 establishment, 1-4 employees: 3 establishments)
Health Care and Social Assistance: Other Individual and Family Services (10-19: 1, 5-9: 1, 1-4: 1)
Accommodation and Food Services: Limited-Service Restaurants (10-19: 1, 5-9: 1)
Fatal accident statistics in 2014:
Fatal accident count: 2
Vehicles involved in fatal accidents: 2
Fatal accidents caused by drunken drivers: 1
Fatalities: 2
Persons involved in fatal accidents: 3
Pedestrians involved in fatal accidents: 1
Fatal accident statistics in 2011:
Fatal accident count: 1
Vehicles involved in fatal accidents: 1
Fatal accidents caused by drunken drivers: 0
Fatalities: 1
Persons involved in fatal accidents: 1
Pedestrians involved in fatal accidents: 0
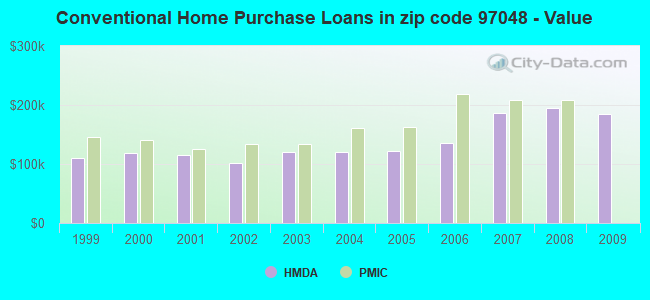
Home Mortgage Disclosure Act Aggregated Statistics For Year 2009 (Based on 16 partial tracts)
A) FHA, FSA/RHS & VA Home Purchase Loans
B) Conventional Home Purchase Loans
C) Refinancings
D) Home Improvement Loans
F) Non-occupant Loans on < 5 Family Dwellings (A B C & D)
G) Loans On Manufactured Home Dwelling (A B C & D)
Number
Average Value
Number
Average Value
Number
Average Value
Number
Average Value
Number
Average Value
Number
Average Value
LOANS ORIGINATED
40
$185,914
24
$184,072
302
$176,585
18
$102,018
14
$192,864
61
$158,543
APPLICATIONS APPROVED, NOT ACCEPTED
5
$150,740
5
$183,590
44
$209,556
0
$0
3
$75,197
4
$194,662
APPLICATIONS DENIED
10
$154,572
5
$228,416
123
$204,861
19
$120,445
4
$166,552
31
$147,692
APPLICATIONS WITHDRAWN
4
$120,885
11
$187,625
94
$191,083
2
$106,875
10
$129,229
14
$189,675
FILES CLOSED FOR INCOMPLETENESS
1
$114,650
3
$124,527
18
$234,518
3
$84,377
2
$406,825
0
$0
Aggregated Statistics For Year 2008 (Based on 16 partial tracts)
A) FHA, FSA/RHS & VA Home Purchase Loans
B) Conventional Home Purchase Loans
C) Refinancings
D) Home Improvement Loans
F) Non-occupant Loans on < 5 Family Dwellings (A B C & D)
G) Loans On Manufactured Home Dwelling (A B C & D)
Number
Average Value
Number
Average Value
Number
Average Value
Number
Average Value
Number
Average Value
Number
Average Value
LOANS ORIGINATED
34
$196,817
48
$194,291
223
$185,799
28
$67,321
18
$205,229
63
$157,474
APPLICATIONS APPROVED, NOT ACCEPTED
4
$198,210
14
$161,180
23
$195,296
5
$119,044
8
$104,834
7
$111,533
APPLICATIONS DENIED
6
$139,112
31
$130,282
156
$207,541
30
$55,725
21
$203,296
42
$108,772
APPLICATIONS WITHDRAWN
11
$199,876
45
$166,871
66
$178,903
10
$147,512
8
$94,882
4
$98,585
FILES CLOSED FOR INCOMPLETENESS
1
$155,080
9
$160,717
12
$241,474
0
$0
4
$165,958
6
$136,117
Aggregated Statistics For Year 2007 (Based on 16 partial tracts)
A) FHA, FSA/RHS & VA Home Purchase Loans
B) Conventional Home Purchase Loans
C) Refinancings
D) Home Improvement Loans
E) Loans on Dwellings For 5+ Families
F) Non-occupant Loans on < 5 Family Dwellings (A B C & D)
G) Loans On Manufactured Home Dwelling (A B C & D)
Number
Average Value
Number
Average Value
Number
Average Value
Number
Average Value
Number
Average Value
Number
Average Value
Number
Average Value
LOANS ORIGINATED
30
$198,635
144
$185,679
275
$161,840
53
$83,914
2
$348,455
35
$140,458
67
$154,425
APPLICATIONS APPROVED, NOT ACCEPTED
3
$161,833
32
$169,987
40
$154,761
4
$124,968
0
$0
4
$94,315
11
$151,001
APPLICATIONS DENIED
1
$76,900
45
$163,560
177
$176,429
39
$78,443
2
$302,560
15
$151,628
41
$123,055
APPLICATIONS WITHDRAWN
8
$220,769
35
$141,901
72
$164,329
7
$87,433
0
$0
2
$163,175
16
$175,883
FILES CLOSED FOR INCOMPLETENESS
0
$0
1
$147,680
12
$171,757
2
$135,995
0
$0
0
$0
0
$0
Aggregated Statistics For Year 2006 (Based on 16 partial tracts)
A) FHA, FSA/RHS & VA Home Purchase Loans
B) Conventional Home Purchase Loans
C) Refinancings
D) Home Improvement Loans
E) Loans on Dwellings For 5+ Families
F) Non-occupant Loans on < 5 Family Dwellings (A B C & D)
G) Loans On Manufactured Home Dwelling (A B C & D)
Number
Average Value
Number
Average Value
Number
Average Value
Number
Average Value
Number
Average Value
Number
Average Value
Number
Average Value
LOANS ORIGINATED
18
$187,574
219
$136,226
272
$158,761
39
$83,064
2
$46,805
46
$134,282
59
$161,873
APPLICATIONS APPROVED, NOT ACCEPTED
1
$106,040
63
$129,488
66
$171,513
7
$49,749
0
$0
16
$104,938
12
$139,667
APPLICATIONS DENIED
2
$163,280
90
$119,842
156
$139,456
43
$92,961
0
$0
35
$153,482
49
$140,587
APPLICATIONS WITHDRAWN
6
$161,127
51
$124,955
142
$157,217
5
$85,118
0
$0
13
$146,158
15
$144,250
FILES CLOSED FOR INCOMPLETENESS
0
$0
6
$135,823
33
$194,931
1
$218,020
0
$0
5
$107,316
0
$0
Aggregated Statistics For Year 2005 (Based on 16 partial tracts)
A) FHA, FSA/RHS & VA Home Purchase Loans
B) Conventional Home Purchase Loans
C) Refinancings
D) Home Improvement Loans
F) Non-occupant Loans on < 5 Family Dwellings (A B C & D)
G) Loans On Manufactured Home Dwelling (A B C & D)
Number
Average Value
Number
Average Value
Number
Average Value
Number
Average Value
Number
Average Value
Number
Average Value
LOANS ORIGINATED
30
$152,955
279
$122,686
307
$134,483
22
$69,715
44
$116,877
70
$123,990
APPLICATIONS APPROVED, NOT ACCEPTED
8
$103,948
44
$100,177
70
$115,794
2
$204,625
13
$107,045
18
$135,874
APPLICATIONS DENIED
5
$136,068
78
$110,010
208
$132,240
37
$58,281
20
$115,736
70
$120,230
APPLICATIONS WITHDRAWN
5
$109,774
27
$141,549
155
$147,115
14
$105,296
11
$115,622
34
$139,056
FILES CLOSED FOR INCOMPLETENESS
0
$0
11
$108,812
32
$179,111
0
$0
2
$125,370
2
$110,420
Aggregated Statistics For Year 2004 (Based on 16 partial tracts)
A) FHA, FSA/RHS & VA Home Purchase Loans
B) Conventional Home Purchase Loans
C) Refinancings
D) Home Improvement Loans
F) Non-occupant Loans on < 5 Family Dwellings (A B C & D)
G) Loans On Manufactured Home Dwelling (A B C & D)
Number
Average Value
Number
Average Value
Number
Average Value
Number
Average Value
Number
Average Value
Number
Average Value
LOANS ORIGINATED
23
$154,179
119
$120,248
308
$120,070
27
$49,317
35
$98,987
70
$116,265
APPLICATIONS APPROVED, NOT ACCEPTED
3
$144,027
27
$88,427
71
$136,685
7
$40,843
9
$88,399
13
$75,381
APPLICATIONS DENIED
4
$164,260
51
$94,262
218
$131,557
14
$60,836
11
$120,609
54
$112,355
APPLICATIONS WITHDRAWN
0
$0
19
$133,934
162
$124,673
1
$54,690
6
$121,143
29
$131,692
FILES CLOSED FOR INCOMPLETENESS
0
$0
4
$193,465
25
$113,902
2
$93,990
4
$172,648
1
$53,020
Aggregated Statistics For Year 2003 (Based on 16 partial tracts)
A) FHA, FSA/RHS & VA Home Purchase Loans
B) Conventional Home Purchase Loans
C) Refinancings
D) Home Improvement Loans
F) Non-occupant Loans on < 5 Family Dwellings (A B C & D)
Number
Average Value
Number
Average Value
Number
Average Value
Number
Average Value
Number
Average Value
LOANS ORIGINATED
33
$137,145
99
$119,977
591
$124,960
41
$29,816
37
$100,944
APPLICATIONS APPROVED, NOT ACCEPTED
1
$58,850
14
$104,309
79
$134,261
8
$32,105
6
$124,300
APPLICATIONS DENIED
3
$125,347
39
$110,457
242
$136,275
21
$42,338
15
$117,306
APPLICATIONS WITHDRAWN
1
$247,260
17
$110,998
141
$137,868
0
$0
10
$112,253
FILES CLOSED FOR INCOMPLETENESS
2
$183,040
8
$99,460
28
$110,870
0
$0
7
$70,446
Aggregated Statistics For Year 2002 (Based on 16 partial tracts)
A) FHA, FSA/RHS & VA Home Purchase Loans
B) Conventional Home Purchase Loans
C) Refinancings
D) Home Improvement Loans
F) Non-occupant Loans on < 5 Family Dwellings (A B C & D)
Number
Average Value
Number
Average Value
Number
Average Value
Number
Average Value
Number
Average Value
LOANS ORIGINATED
20
$137,622
97
$101,762
397
$117,426
20
$26,498
42
$84,894
APPLICATIONS APPROVED, NOT ACCEPTED
2
$114,690
19
$110,106
74
$138,505
8
$29,241
8
$109,854
APPLICATIONS DENIED
8
$116,176
42
$104,405
142
$119,247
16
$30,239
8
$99,421
APPLICATIONS WITHDRAWN
6
$122,022
11
$107,045
86
$113,113
4
$29,222
8
$95,511
FILES CLOSED FOR INCOMPLETENESS
0
$0
3
$244,153
21
$106,359
0
$0
0
$0
Aggregated Statistics For Year 2001 (Based on 16 partial tracts)
A) FHA, FSA/RHS & VA Home Purchase Loans
B) Conventional Home Purchase Loans
C) Refinancings
D) Home Improvement Loans
E) Loans on Dwellings For 5+ Families
F) Non-occupant Loans on < 5 Family Dwellings (A B C & D)
Number
Average Value
Number
Average Value
Number
Average Value
Number
Average Value
Number
Average Value
Number
Average Value
LOANS ORIGINATED
28
$127,341
84
$115,607
302
$121,212
25
$33,808
2
$249,070
21
$108,076
APPLICATIONS APPROVED, NOT ACCEPTED
0
$0
23
$83,644
51
$121,370
13
$41,698
0
$0
4
$66,958
APPLICATIONS DENIED
2
$118,925
39
$83,644
141
$120,353
15
$18,109
0
$0
8
$57,595
APPLICATIONS WITHDRAWN
13
$111,229
14
$106,099
116
$128,004
7
$36,613
0
$0
3
$78,847
FILES CLOSED FOR INCOMPLETENESS
0
$0
3
$142,443
20
$144,482
5
$33,098
0
$0
2
$109,490
Aggregated Statistics For Year 2000 (Based on 16 partial tracts)
A) FHA, FSA/RHS & VA Home Purchase Loans
B) Conventional Home Purchase Loans
C) Refinancings
D) Home Improvement Loans
E) Loans on Dwellings For 5+ Families
F) Non-occupant Loans on < 5 Family Dwellings (A B C & D)
Number
Average Value
Number
Average Value
Number
Average Value
Number
Average Value
Number
Average Value
Number
Average Value
LOANS ORIGINATED
26
$131,761
110
$119,008
141
$107,192
30
$28,803
0
$0
18
$86,410
APPLICATIONS APPROVED, NOT ACCEPTED
0
$0
39
$105,720
39
$105,998
7
$17,057
0
$0
4
$150,940
APPLICATIONS DENIED
2
$114,105
65
$96,006
128
$85,118
43
$21,000
0
$0
11
$84,746
APPLICATIONS WITHDRAWN
8
$104,171
13
$104,136
47
$87,632
8
$32,816
2
$208,950
2
$59,030
FILES CLOSED FOR INCOMPLETENESS
2
$102,485
2
$41,135
22
$108,367
0
$0
0
$0
1
$39,140
Aggregated Statistics For Year 1999 (Based on 8 partial tracts)
A) FHA, FSA/RHS & VA Home Purchase Loans
B) Conventional Home Purchase Loans
C) Refinancings
D) Home Improvement Loans
E) Loans on Dwellings For 5+ Families
F) Non-occupant Loans on < 5 Family Dwellings (A B C & D)
2002 - 2018 National Fire Incident Reporting System (NFIRS) incidents
According to the data from the years 2002 - 2018 the average number of fire incidents per year is 24. The highest number of reported fire incidents - 39 took place in 2003, and the least - 8 in 2017. The data has an increasing trend.
When looking into fire subcategories, the most reports belonged to: Structure Fires (41.1%), and Mobile Property/Vehicle Fires (30.5%).
Fire incident types reported to NFIRS in Zip Code 97048

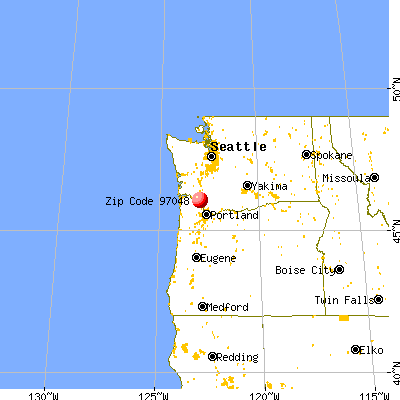


 Nearest zip codes: 97054, 97051, 98632, 97018, 97053, 98626.
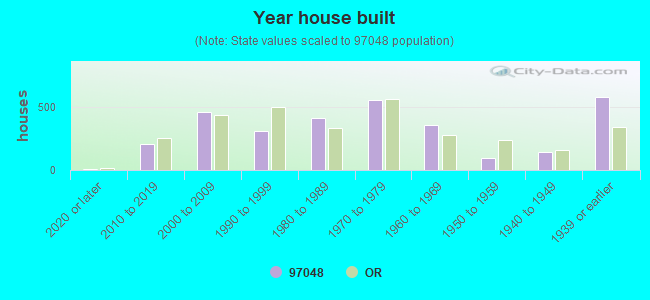


 According to the data from the years 2002 - 2018 the average number of fire incidents per year is 24. The highest number of reported fire incidents - 39 took place in 2003, and the least - 8 in 2017. The data has an increasing trend.
 When looking into fire subcategories, the most reports belonged to: Structure Fires (41.1%), and Mobile Property/Vehicle Fires (30.5%).