Estimated zip code population in 2022: 1,316 Zip code population in 2010: 1,579 Zip code population in 2000: 1,239
Houses and condos: 662 Renter-occupied apartments: 16
% of renters here:
3%
State:
37%
March 2022 cost of living index in zip code 97054: 91.3 (less than average, U.S. average is 100)
Land area: 48.0 sq. mi. Water area: 2.3 sq. mi.
Population density: 27 people per square mile
(very low).
OSM Map
General Map
Google Map
MSN Map
OSM Map
General Map
Google Map
MSN Map
OSM Map
General Map
Google Map
MSN Map
OSM Map
General Map
Google Map
MSN Map
Please wait while loading the map...
Real estate property taxes paid for housing units in 2022:
This zip code:
0.6% ($2,412)
Oregon:
0.8% ($3,646)
Median real estate property taxes paid for housing units with mortgages in 2022: $2,487 (0.6%) Median real estate property taxes paid for housing units with no mortgage in 2022: $2,114 (0.5%)
Estimated median house/condo value in 2022: $407,593
97054:
$407,593
Oregon:
$475,600
According to our research of Oregon and other state lists, there was 1 registered sex offender living in 97054 zip code as of May 28, 2024. The ratio of all residents to sex offenders in zip code 97054 is 1,886 to 1. The ratio of registered sex offenders to all residents in this zip code is near the state average.
Median resident age:
This zip code:
56.9 years
Oregon median age:
40.5 years
Average household size:
This zip code:
2.1 people
Oregon:
2.4 people
Averages for the 2020 tax year for zip code 97054, filed in 2021:
Average Adjusted Gross Income (AGI) in 2020: $65,651 (Individual Income Tax Returns)
Here:
$65,651
State:
$76,001
Salary/wage: $58,894 (reported on 79.4% of returns)
Here:
$58,894
State:
$61,959
(% of AGI for various income ranges: 1337.3% for AGIs below $25k, 3250.0% for AGIs $25k-50k, 6770.0% for AGIs $50k-75k, 8866.7% for AGIs $75k-100k, 25031.7% for AGIs $100k-200k)
Taxable interest for individuals: $555 (reported on 34.9% of returns)
This zip code:
$555
Oregon:
$1,628
(% of AGI for various income ranges: 14.5% for AGIs below $25k, 19.1% for AGIs $25k-50k, 13.3% for AGIs $50k-75k, 3.3% for AGIs $75k-100k, 125.0% for AGIs $100k-200k)
Ordinary dividends: $1,911 (reported on 14.3% of returns)
Here:
$1,911
State:
$7,165
(% of AGI for various income ranges: 56.4% for AGIs below $25k, 46.7% for AGIs $50k-75k, 136.7% for AGIs $100k-200k)
Net capital gain/loss in AGI: +$20,456 (reported on 14.3% of returns)
Here:
+$20,456
State:
+$23,403
(% of AGI for various income ranges: 51.8% for AGIs below $25k, 75.0% for AGIs $50k-75k, 2898.3% for AGIs $100k-200k)
Profit/loss from business: +$6,867 (reported on 9.5% of returns)
Here:
+$6,867
State:
+$16,511
(% of AGI for various income ranges: 170.9% for AGIs below $25k, 373.3% for AGIs $50k-75k)
Taxable individual retirement arrangement distribution: $14,450 (reported on 9.5% of returns)
97054:
$14,450
Oregon:
$20,730
(% of AGI for various income ranges: 332.7% for AGIs below $25k, 835.0% for AGIs $50k-75k)
Total itemized deductions: $25,725 (reported on 12.7% of returns)
Here:
$25,725
State:
$31,050
(% of AGI for various income ranges: 1698.3% for AGIs $50k-75k, 1731.7% for AGIs $100k-200k)
Charity contributions: $2,725 (reported on 6.3% of returns)
Here:
$2,725
State:
$8,791
(% of AGI for various income ranges: 181.7% for AGIs $100k-200k)
Taxes paid: $7,857 (reported on 11.1% of returns)
97054:
$7,857
State:
$8,487
(% of AGI for various income ranges: 421.7% for AGIs $50k-75k, 495.0% for AGIs $100k-200k)
Earned income credit: $1,829 (reported on 11.1% of returns)
Here:
$1,829
State:
$1,977
(% of AGI for various income ranges: 64.5% for AGIs below $25k, 51.8% for AGIs $25k-50k)
Percentage of individuals using paid preparers for their 2020 taxes: 92.1%
Here:
92%
State:
93%
(% for various income ranges: 94.1% for AGIs below $25k, 93.3% for AGIs $25k-50k, 90.0% for AGIs $50k-75k, 87.5% for AGIs $75k-100k, 90.9% for AGIs $100k-200k, 100.0% for AGIs over 200k)
Averages for the 2012 tax year for zip code 97054, filed in 2013:
Average Adjusted Gross Income (AGI) in 2012: $52,951 (Individual Income Tax Returns)
Here:
$52,951
State:
$57,845
Salary/wage: $46,871 (reported on 78.9% of returns)
Here:
$46,871
State:
$47,723
(% of AGI for various income ranges: 67.0% for AGIs below $25k, 70.9% for AGIs $25k-50k, 76.1% for AGIs $50k-75k, 71.0% for AGIs $75k-100k, 66.2% for AGIs $100k-200k)
Taxable interest for individuals: $432 (reported on 33.3% of returns)
This zip code:
$432
Oregon:
$1,848
(% of AGI for various income ranges: 1.1% for AGIs below $25k, 0.1% for AGIs $25k-50k, 0.1% for AGIs $50k-75k, 0.3% for AGIs $75k-100k, 0.2% for AGIs $100k-200k)
Ordinary dividends: $1,775 (reported on 14.0% of returns)
Here:
$1,775
State:
$5,987
(% of AGI for various income ranges: 3.5% for AGIs below $25k, 0.5% for AGIs $50k-75k, 0.3% for AGIs $100k-200k)
Net capital gain/loss in AGI: +$2,271 (reported on 12.3% of returns)
Here:
+$2,271
State:
+$13,095
Profit/loss from business: +$4,071 (reported on 12.3% of returns)
Here:
+$4,071
State:
+$13,871
(% of AGI for various income ranges: 2.5% for AGIs below $25k, 4.4% for AGIs $25k-50k, 0.3% for AGIs $75k-100k)
Taxable individual retirement arrangement distribution: $10,583 (reported on 10.5% of returns)
97054:
$10,583
Oregon:
$16,036
Total itemized deductions: $20,932 (24% of AGI, reported on 38.6% of returns)
Here:
$20,932
State:
$24,430
Here:
23.6% of AGI
State:
23.2% of AGI
(% of AGI for various income ranges: 19.0% for AGIs $25k-50k, 12.9% for AGIs $50k-75k, 16.2% for AGIs $75k-100k, 17.7% for AGIs $100k-200k)
Charity contributions: $1,681 (reported on 28.1% of returns)
Here:
$1,681
State:
$3,648
(% of AGI for various income ranges: 1.1% for AGIs $25k-50k, 0.6% for AGIs $50k-75k, 0.8% for AGIs $75k-100k, 1.2% for AGIs $100k-200k)
Taxes paid: $7,882 (reported on 38.6% of returns)
97054:
$7,882
State:
$10,269
(% of AGI for various income ranges: 4.2% for AGIs $25k-50k, 4.3% for AGIs $50k-75k, 6.5% for AGIs $75k-100k, 8.0% for AGIs $100k-200k)
Earned income credit: $2,112 (reported on 14.0% of returns)
Here:
$2,112
State:
$2,021
(% of AGI for various income ranges: 4.6% for AGIs below $25k, 1.3% for AGIs $25k-50k)
Percentage of individuals using paid preparers for their 2012 taxes: 49.1%
Here:
49%
State:
47%
(% for various income ranges: 47.4% for AGIs below $25k, 46.2% for AGIs $25k-50k, 50.0% for AGIs $50k-75k, 42.9% for AGIs $75k-100k, 62.5% for AGIs $100k-200k)
Averages for the 2004 tax year for zip code 97054, filed in 2005:
Average Adjusted Gross Income (AGI) in 2004: $45,262 (Individual Income Tax Returns)
Here:
$45,262
State:
$46,788
Salary/wage: $40,572 (reported on 85.3% of returns)
Here:
$40,572
State:
$39,788
(% of AGI for various income ranges: 99.3% for AGIs below $10k, 71.0% for AGIs $10k-25k, 81.2% for AGIs $25k-50k, 85.9% for AGIs $50k-75k, 85.2% for AGIs $75k-100k, 57.2% for AGIs over 100k)
Taxable interest for individuals: $724 (reported on 42.4% of returns)
This zip code:
$724
Oregon:
$2,126
(% of AGI for various income ranges: 2.7% for AGIs below $10k, 1.2% for AGIs $10k-25k, 0.3% for AGIs $25k-50k, 0.8% for AGIs $50k-75k, 0.5% for AGIs $75k-100k, 0.7% for AGIs over 100k)
Taxable dividends: $1,198 (reported on 17.4% of returns)
Here:
$1,198
State:
$3,427
(% of AGI for various income ranges: 3.0% for AGIs below $10k, 1.5% for AGIs $10k-25k, 0.3% for AGIs $25k-50k, 0.5% for AGIs $50k-75k, 0.4% for AGIs over 100k)
Net capital gain/loss: +$3,152 (reported on 17.1% of returns)
Here:
+$3,152
State:
+$12,447
(% of AGI for various income ranges: -3.5% for AGIs below $10k, 0.8% for AGIs $10k-25k, -0.5% for AGIs $25k-50k, 0.6% for AGIs $50k-75k, 4.2% for AGIs over 100k)
Profit/loss from business: +$4,562 (reported on 12.6% of returns)
Here:
+$4,562
State:
+$11,682
(% of AGI for various income ranges: -5.4% for AGIs below $10k, 5.1% for AGIs $10k-25k, 4.1% for AGIs $25k-50k, 0.5% for AGIs $50k-75k)
Total itemized deductions: $17,482 (26% of AGI, reported on 49.0% of returns)
Here:
$17,482
State:
$20,209
Here:
25.5% of AGI
State:
24.7% of AGI
(% of AGI for various income ranges: 18.4% for AGIs $10k-25k, 20.2% for AGIs $25k-50k, 19.1% for AGIs $50k-75k, 22.0% for AGIs $75k-100k, 17.2% for AGIs over 100k)
Charity contributions deductions: $1,798 (2% of AGI, reported on 38.4% of returns)
Here:
$1,798
State:
$3,145
Here:
2.5% of AGI
State:
3.6% of AGI
(% of AGI for various income ranges: 0.9% for AGIs $10k-25k, 2.0% for AGIs $25k-50k, 1.5% for AGIs $50k-75k, 1.5% for AGIs $75k-100k, 1.4% for AGIs over 100k)
Total tax: $5,924 (reported on 75.0% of returns)
97054:
$5,924
State:
$7,148
(% of AGI for various income ranges: 2.5% for AGIs below $10k, 3.8% for AGIs $10k-25k, 6.7% for AGIs $25k-50k, 7.4% for AGIs $50k-75k, 10.2% for AGIs $75k-100k, 16.8% for AGIs over 100k)
Earned income credit: $1,431 (reported on 12.4% of returns)
Here:
$1,431
State:
$1,605
Percentage of individuals using paid preparers for their 2004 taxes: 55.7%
Here:
56%
State:
53%
(% for various income ranges: 43.4% for AGIs below $10k, 57.7% for AGIs $10k-25k, 56.9% for AGIs $25k-50k, 57.8% for AGIs $50k-75k, 58.7% for AGIs $75k-100k, 66.7% for AGIs over 100k)
Household received Food Stamps/SNAP in the past 12 months: 55 Household did not receive Food Stamps/SNAP in the past 12 months: 560
Women who had a birth in the past 12 months: 7 (7 now married, 0 unmarried) Women who did not have a birth in the past 12 months: 156 (60 now married, 95 unmarried)
Housing units in zip code 97054 with a mortgage: 451 (55 second mortgage, 17 both second mortgage and home equity loan) Median monthly owner costs for units with a mortgage: $1,870 Median monthly owner costs for units without a mortgage: $330
Residents with income below the poverty level in 2022:
This zip code:
3.6%
Whole state:
12.1%
Residents with income below 50% of the poverty level in 2022:
This zip code:
2.7%
Whole state:
6.2%
Median number of rooms in houses and condos:
Here:
5.8
State:
6.2
Notable locations in this zip code not listed on our city pages
Notable locations in zip code 97054: Meissner Lookout (A), Waterview (B), Columbia River Fire and Rescue - Deer Island Station (C). Display/hide their locations on the map
Lakes and swamps: Horsepasture Lake (A), Muckle Lake (B), Oak Ridge Lake (C), Resting Lake (D), Swan Lake (E), Thorn Lake (F), Adams Lake (G), Benham Slough (H). Display/hide their locations on the map
Size of family households: 312 2-persons, 45 3-persons, 19 4-persons, 27 5-persons, 18 6-persons
Size of nonfamily households: 137 1-person, 50 2-persons, 7 3-persons
95 married couples with children.
0 single-parent households ().
96.5% of residents of 97054 zip code speak English at home.
1.9% of residents speak Spanish at home (100% very well).
2.3% of residents speak other Indo-European language at home (100% very well).
Foreign born population: 9 (0.7%) (65.7% of them are naturalized citizens)
This zip code:
0.7%
Whole state:
9.9%
23%Irish
17%German
12%European
8%American
8%English
7%Scotch-Irish
6%Danish
Year of entry for the foreign-born population
02010 or later
02000 to 2009
01990 to 1999
40Before 1990
Facilities with environmental interests located in this zip code:
DEER ISLAND STORE (64561 COLUMBIA RIVER HWY in DEER ISLAND, OR)
ENFORCEMENT/COMPLIANCE ACTIVITY (Integrated Compliance Information System) - ICIS-10-2003-0171, FORMAL ENFORCEMENT ACTION (Integrated Compliance Information System) - ICIS-10-2003-0171, FORMAL ENFORCEMENT ACTION STATE MASTER (Oregon inspections and permits database) - OR-LUST-05-99-0637, LEAKING STORAGE TANK, OR-UST-BFBEJ, OR-UST-BFBFK, Organizations: DAVE LAWRENCE (CONTACT/OWNER)
DEER ISLAND STOCK RANCH (65640 ISLAND RD in DEER ISLAND, OR)
(Resource Conservation and Recovery Act (tracking hazardous waste)) Organizations: HOWARD KEM DEER ISLAND STOCK RANCH (CONTACT/OWNER)
Housing units lacking complete plumbing facilities: 1.8%
61.8%Electricity
33.2%Wood
5.2%Bottled, tank, or LP gas
Population in 1990: 1,317.
Place of birth for U.S.-born residents:
This state: 627
Northeast: 43
Midwest: 134
South: 20
West: 445
63% of the 97054 zip code residents lived in the same house 5 years ago. Out of people who lived in different houses, 59% lived in this county. Out of people who lived in different counties, 50% lived in Oregon.
96% of the 97054 zip code residents lived in the same house 1 year ago. Out of people who lived in different houses, 14% moved from this county. Out of people who lived in different houses, 65% moved from different county within same state. Out of people who lived in different houses, 40% moved from different state.
Private vs. public school enrollment:
Students in private schools in grades 1 to 8 (elementary and middle school): 33
Here:
78.1%
Oregon:
13.7%
Students in private schools in grades 9 to 12 (high school): 4
Here:
80.7%
Oregon:
8.8%
Students in private undergraduate colleges:
Here:
0.0%
Oregon:
17.7%
Occupation by median earnings in the past 12 months ($)
79,261Production occupations
77,033Architecture and engineering occupations
76,359Building and grounds cleaning and maintenance occupations
47,901Office and administrative support occupations
41,268Construction and extraction occupations
40,808Installation, maintenance, and repair occupations
Top industries in this zip code by the number of employees in 2005:
Mining: Construction Sand and Gravel Mining (10-19 employees: 1 establishment, 1-4 employees: 1 establishment)
Wholesale Trade: Other Chemical and Allied Products Merchant Wholesalers (5-9: 1)
Professional, Scientific, and Technical Services: Engineering Services (5-9: 1)
Mining: Other Crushed and Broken Stone Mining and Quarrying (1-4: 1)
Construction: New Single-Family Housing Construction (except Operative Builders) (1-4: 1)
Construction: Plumbing, Heating, and Air-Conditioning Contractors (1-4: 1)
Health Care and Social Assistance: Offices of Physical, Occupational and Speech Therapists, and Audiologists (1-4: 1)
Fatal accident statistics in 2010:
Fatal accident count: 1
Vehicles involved in fatal accidents: 2
Fatal accidents caused by drunken drivers: 0
Fatalities: 1
Persons involved in fatal accidents: 2
Pedestrians involved in fatal accidents: 0
Home Mortgage Disclosure Act Aggregated Statistics For Year 2009 (Based on 8 partial tracts)
A) FHA, FSA/RHS & VA Home Purchase Loans
B) Conventional Home Purchase Loans
C) Refinancings
D) Home Improvement Loans
F) Non-occupant Loans on < 5 Family Dwellings (A B C & D)
G) Loans On Manufactured Home Dwelling (A B C & D)
Number
Average Value
Number
Average Value
Number
Average Value
Number
Average Value
Number
Average Value
Number
Average Value
LOANS ORIGINATED
16
$200,120
6
$200,983
146
$211,680
7
$97,923
2
$244,020
21
$179,121
APPLICATIONS APPROVED, NOT ACCEPTED
1
$45,550
3
$195,497
26
$225,556
1
$8,950
1
$56,010
4
$124,542
APPLICATIONS DENIED
5
$126,210
8
$156,218
71
$241,100
9
$133,384
1
$26,140
13
$115,742
APPLICATIONS WITHDRAWN
1
$198,390
7
$150,291
48
$226,131
1
$193,740
0
$0
7
$205,051
FILES CLOSED FOR INCOMPLETENESS
1
$178,550
3
$174,320
13
$261,372
1
$121,730
0
$0
1
$75,860
Aggregated Statistics For Year 2008 (Based on 8 partial tracts)
A) FHA, FSA/RHS & VA Home Purchase Loans
B) Conventional Home Purchase Loans
C) Refinancings
D) Home Improvement Loans
F) Non-occupant Loans on < 5 Family Dwellings (A B C & D)
G) Loans On Manufactured Home Dwelling (A B C & D)
Number
Average Value
Number
Average Value
Number
Average Value
Number
Average Value
Number
Average Value
Number
Average Value
LOANS ORIGINATED
11
$231,242
24
$227,668
103
$217,793
11
$89,661
4
$213,402
21
$167,369
APPLICATIONS APPROVED, NOT ACCEPTED
1
$362,200
6
$178,098
16
$234,312
2
$66,155
2
$84,995
6
$118,737
APPLICATIONS DENIED
4
$170,090
7
$159,824
75
$220,323
10
$108,128
5
$118,998
18
$137,912
APPLICATIONS WITHDRAWN
7
$211,934
11
$209,938
27
$220,119
3
$209,440
1
$150,540
1
$225,620
FILES CLOSED FOR INCOMPLETENESS
1
$196,420
4
$219,198
6
$251,015
0
$0
1
$171,570
2
$184,730
Aggregated Statistics For Year 2007 (Based on 8 partial tracts)
A) FHA, FSA/RHS & VA Home Purchase Loans
B) Conventional Home Purchase Loans
C) Refinancings
D) Home Improvement Loans
F) Non-occupant Loans on < 5 Family Dwellings (A B C & D)
G) Loans On Manufactured Home Dwelling (A B C & D)
Number
Average Value
Number
Average Value
Number
Average Value
Number
Average Value
Number
Average Value
Number
Average Value
LOANS ORIGINATED
7
$245,239
75
$217,186
125
$192,892
14
$106,538
8
$215,726
30
$158,703
APPLICATIONS APPROVED, NOT ACCEPTED
2
$266,505
15
$197,133
21
$204,706
4
$54,515
1
$318,590
7
$169,460
APPLICATIONS DENIED
0
$0
19
$174,573
83
$207,053
17
$156,904
2
$136,650
21
$110,656
APPLICATIONS WITHDRAWN
1
$502,600
11
$160,078
37
$184,063
5
$136,536
2
$102,635
7
$174,134
FILES CLOSED FOR INCOMPLETENESS
0
$0
1
$273,860
7
$288,299
1
$124,870
0
$0
0
$0
Aggregated Statistics For Year 2006 (Based on 8 partial tracts)
A) FHA, FSA/RHS & VA Home Purchase Loans
B) Conventional Home Purchase Loans
C) Refinancings
D) Home Improvement Loans
F) Non-occupant Loans on < 5 Family Dwellings (A B C & D)
G) Loans On Manufactured Home Dwelling (A B C & D)
Number
Average Value
Number
Average Value
Number
Average Value
Number
Average Value
Number
Average Value
Number
Average Value
LOANS ORIGINATED
5
$242,428
96
$172,329
124
$175,385
12
$111,696
13
$140,375
23
$186,126
APPLICATIONS APPROVED, NOT ACCEPTED
0
$0
20
$133,491
24
$161,756
3
$51,093
2
$107,670
7
$124,573
APPLICATIONS DENIED
2
$190,565
25
$144,818
80
$146,800
19
$103,953
3
$297,680
26
$104,185
APPLICATIONS WITHDRAWN
1
$311,420
15
$130,523
64
$170,280
2
$67,180
3
$92,003
8
$167,838
FILES CLOSED FOR INCOMPLETENESS
0
$0
2
$212,850
12
$203,918
1
$144,880
0
$0
0
$0
Aggregated Statistics For Year 2005 (Based on 8 partial tracts)
A) FHA, FSA/RHS & VA Home Purchase Loans
B) Conventional Home Purchase Loans
C) Refinancings
D) Home Improvement Loans
F) Non-occupant Loans on < 5 Family Dwellings (A B C & D)
G) Loans On Manufactured Home Dwelling (A B C & D)
Number
Average Value
Number
Average Value
Number
Average Value
Number
Average Value
Number
Average Value
Number
Average Value
LOANS ORIGINATED
10
$193,039
128
$146,946
146
$156,654
10
$100,417
13
$134,484
28
$136,039
APPLICATIONS APPROVED, NOT ACCEPTED
1
$124,720
20
$122,144
29
$137,442
3
$139,823
4
$162,278
11
$127,858
APPLICATIONS DENIED
1
$146,260
31
$148,609
97
$158,953
13
$48,087
6
$166,932
34
$132,289
APPLICATIONS WITHDRAWN
2
$178,130
13
$160,197
60
$167,903
6
$124,873
3
$128,127
14
$145,974
FILES CLOSED FOR INCOMPLETENESS
0
$0
3
$127,537
11
$157,263
0
$0
0
$0
0
$0
Aggregated Statistics For Year 2004 (Based on 8 partial tracts)
A) FHA, FSA/RHS & VA Home Purchase Loans
B) Conventional Home Purchase Loans
C) Refinancings
D) Home Improvement Loans
F) Non-occupant Loans on < 5 Family Dwellings (A B C & D)
G) Loans On Manufactured Home Dwelling (A B C & D)
Number
Average Value
Number
Average Value
Number
Average Value
Number
Average Value
Number
Average Value
Number
Average Value
LOANS ORIGINATED
10
$164,168
77
$145,533
130
$150,618
11
$64,014
9
$119,539
30
$128,237
APPLICATIONS APPROVED, NOT ACCEPTED
2
$160,450
13
$114,694
26
$154,866
2
$53,095
2
$124,170
6
$85,595
APPLICATIONS DENIED
2
$119,425
21
$115,005
87
$157,397
10
$54,232
5
$124,310
23
$137,741
APPLICATIONS WITHDRAWN
2
$131,870
10
$162,826
64
$142,818
0
$0
3
$98,620
14
$152,056
FILES CLOSED FOR INCOMPLETENESS
0
$0
3
$186,270
9
$174,282
1
$208,120
2
$126,400
0
$0
Aggregated Statistics For Year 2003 (Based on 8 partial tracts)
A) FHA, FSA/RHS & VA Home Purchase Loans
B) Conventional Home Purchase Loans
C) Refinancings
D) Home Improvement Loans
F) Non-occupant Loans on < 5 Family Dwellings (A B C & D)
Number
Average Value
Number
Average Value
Number
Average Value
Number
Average Value
Number
Average Value
LOANS ORIGINATED
18
$149,699
49
$144,916
261
$150,433
9
$35,589
13
$129,348
APPLICATIONS APPROVED, NOT ACCEPTED
0
$0
11
$98,211
41
$163,401
0
$0
7
$126,849
APPLICATIONS DENIED
2
$143,870
23
$135,563
102
$144,103
11
$58,565
5
$139,334
APPLICATIONS WITHDRAWN
2
$142,680
11
$127,137
70
$149,602
2
$47,460
4
$142,750
FILES CLOSED FOR INCOMPLETENESS
0
$0
2
$141,015
15
$156,022
1
$17,500
0
$0
Aggregated Statistics For Year 2002 (Based on 8 partial tracts)
A) FHA, FSA/RHS & VA Home Purchase Loans
B) Conventional Home Purchase Loans
C) Refinancings
D) Home Improvement Loans
F) Non-occupant Loans on < 5 Family Dwellings (A B C & D)
Number
Average Value
Number
Average Value
Number
Average Value
Number
Average Value
Number
Average Value
LOANS ORIGINATED
8
$159,328
45
$130,226
147
$144,908
8
$53,051
11
$129,117
APPLICATIONS APPROVED, NOT ACCEPTED
0
$0
7
$135,701
26
$141,351
3
$38,363
1
$55,240
APPLICATIONS DENIED
0
$0
21
$79,960
68
$144,868
7
$20,494
4
$119,880
APPLICATIONS WITHDRAWN
3
$127,717
3
$124,407
34
$165,940
1
$38,900
2
$110,280
FILES CLOSED FOR INCOMPLETENESS
0
$0
3
$285,253
11
$101,737
0
$0
0
$0
Aggregated Statistics For Year 2001 (Based on 8 partial tracts)
A) FHA, FSA/RHS & VA Home Purchase Loans
B) Conventional Home Purchase Loans
C) Refinancings
D) Home Improvement Loans
F) Non-occupant Loans on < 5 Family Dwellings (A B C & D)
Number
Average Value
Number
Average Value
Number
Average Value
Number
Average Value
Number
Average Value
LOANS ORIGINATED
13
$159,902
47
$136,891
126
$130,965
10
$25,723
7
$102,531
APPLICATIONS APPROVED, NOT ACCEPTED
1
$117,090
10
$85,681
24
$124,976
2
$49,405
2
$87,460
APPLICATIONS DENIED
1
$145,100
18
$86,964
75
$135,001
5
$14,586
5
$95,546
APPLICATIONS WITHDRAWN
2
$133,340
6
$108,362
42
$141,918
0
$0
3
$113,820
FILES CLOSED FOR INCOMPLETENESS
0
$0
1
$157,160
9
$135,411
0
$0
0
$0
Aggregated Statistics For Year 2000 (Based on 8 partial tracts)
A) FHA, FSA/RHS & VA Home Purchase Loans
B) Conventional Home Purchase Loans
C) Refinancings
D) Home Improvement Loans
F) Non-occupant Loans on < 5 Family Dwellings (A B C & D)
Number
Average Value
Number
Average Value
Number
Average Value
Number
Average Value
Number
Average Value
LOANS ORIGINATED
11
$140,356
54
$132,534
46
$122,764
12
$27,854
8
$92,514
APPLICATIONS APPROVED, NOT ACCEPTED
0
$0
12
$110,994
12
$104,957
2
$19,715
2
$167,410
APPLICATIONS DENIED
2
$93,665
32
$86,041
47
$93,455
11
$30,213
7
$121,219
APPLICATIONS WITHDRAWN
0
$0
7
$113,410
20
$113,142
3
$22,997
0
$0
FILES CLOSED FOR INCOMPLETENESS
0
$0
1
$186,330
9
$116,354
0
$0
0
$0
Aggregated Statistics For Year 1999 (Based on 4 partial tracts)
A) FHA, FSA/RHS & VA Home Purchase Loans
B) Conventional Home Purchase Loans
C) Refinancings
D) Home Improvement Loans
F) Non-occupant Loans on < 5 Family Dwellings (A B C & D)

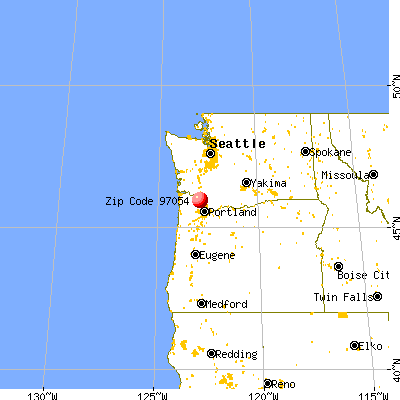


 Nearest zip codes: 97051, 97048, 97053, 97018, 97056, 98625.


