Estimated zip code population in 2022: 6,960 Zip code population in 2010: 6,614 Zip code population in 2000: 5,787
Houses and condos: 2,341 Renter-occupied apartments: 404
% of renters here:
18%
State:
37%
March 2022 cost of living index in zip code 97325: 96.6 (near average, U.S. average is 100)
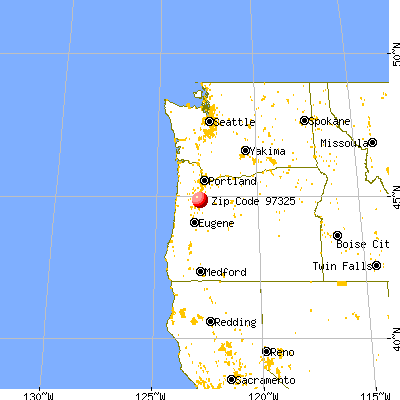
Land area: 31.0 sq. mi. Water area: 0.2 sq. mi.
Population density: 224 people per square mile
(very low).
OSM Map
General Map
Google Map
MSN Map
OSM Map
General Map
Google Map
MSN Map
OSM Map
General Map
Google Map
MSN Map
OSM Map
General Map
Google Map
MSN Map
Please wait while loading the map...
Real estate property taxes paid for housing units in 2022:
This zip code:
0.7% ($2,560)
Oregon:
0.8% ($3,646)
Median real estate property taxes paid for housing units with mortgages in 2022: $2,855 (0.7%) Median real estate property taxes paid for housing units with no mortgage in 2022: $2,087 (0.6%)
Business Search- 14 Million verified businesses
Males: 3,695
(53.1%)
Females: 3,265
(46.9%)
For population 25 years and over in 97325:
High school or higher: 90.5%
Bachelor's degree or higher: 17.4%
Graduate or professional degree: 5.6%
Unemployed: 2.4%
Mean travel time to work (commute): 22.2 minutes
For population 15 years and over in 97325:
Never married: 32.6%
Now married: 50.9%
Separated: 0.9%
Widowed: 4.7%
Divorced: 10.9%
Zip code 97325 compared to state average:
Unemployed percentage below state average.
Black race population percentage significantly below state average.
Foreign-born population percentage significantly below state average.
Renting percentage below state average.
Length of stay since moving in significantly above state average.
Percentage of population with a bachelor's degree or higher below state average.
Estimated median house/condo value in 2022: $387,359
97325:
$387,359
Oregon:
$475,600
According to our research of Oregon and other state lists, there were 3 registered sex offenders living in 97325 zip code as of May 29, 2024. The ratio of all residents to sex offenders in zip code 97325 is 2,431 to 1. The ratio of registered sex offenders to all residents in this zip code is near the state average.
Median resident age:
This zip code:
39.8 years
Oregon median age:
40.5 years
Average household size:
This zip code:
3.0 people
Oregon:
2.4 people
Averages for the 2020 tax year for zip code 97325, filed in 2021:
Average Adjusted Gross Income (AGI) in 2020: $66,282 (Individual Income Tax Returns)
Here:
$66,282
State:
$76,001
Salary/wage: $56,479 (reported on 82.4% of returns)
Here:
$56,479
State:
$61,959
(% of AGI for various income ranges: 1306.6% for AGIs below $25k, 3760.6% for AGIs $25k-50k, 7050.5% for AGIs $50k-75k, 9830.8% for AGIs $75k-100k, 19483.3% for AGIs $100k-200k, 70730.0% for AGIs over 200k)
Taxable interest for individuals: $1,443 (reported on 28.6% of returns)
This zip code:
$1,443
Oregon:
$1,628
(% of AGI for various income ranges: 10.0% for AGIs below $25k, 12.6% for AGIs $25k-50k, 15.0% for AGIs $50k-75k, 105.0% for AGIs $75k-100k, 112.0% for AGIs $100k-200k, 3040.0% for AGIs over 200k)
Ordinary dividends: $3,774 (reported on 13.6% of returns)
Here:
$3,774
State:
$7,165
(% of AGI for various income ranges: 17.5% for AGIs below $25k, 39.1% for AGIs $25k-50k, 47.1% for AGIs $50k-75k, 56.2% for AGIs $75k-100k, 93.0% for AGIs $100k-200k, 3900.0% for AGIs over 200k)
Net capital gain/loss in AGI: +$19,024 (reported on 13.0% of returns)
Here:
+$19,024
State:
+$23,403
(% of AGI for various income ranges: 7.8% for AGIs below $25k, 50.8% for AGIs $25k-50k, 49.8% for AGIs $50k-75k, 133.1% for AGIs $75k-100k, 550.7% for AGIs $100k-200k, 29860.0% for AGIs over 200k)
Profit/loss from business: +$8,582 (reported on 11.0% of returns)
Here:
+$8,582
State:
+$16,511
(% of AGI for various income ranges: 55.1% for AGIs below $25k, 117.4% for AGIs $25k-50k, 75.0% for AGIs $50k-75k, 252.7% for AGIs $75k-100k, 385.7% for AGIs $100k-200k)
Taxable individual retirement arrangement distribution: $14,782 (reported on 8.1% of returns)
97325:
$14,782
Oregon:
$20,730
(% of AGI for various income ranges: 51.0% for AGIs below $25k, 71.4% for AGIs $25k-50k, 148.6% for AGIs $50k-75k, 197.7% for AGIs $75k-100k, 731.7% for AGIs $100k-200k)
Total itemized deductions: $28,167 (reported on 12.1% of returns)
Here:
$28,167
State:
$31,050
(% of AGI for various income ranges: 81.9% for AGIs below $25k, 104.5% for AGIs $25k-50k, 531.4% for AGIs $50k-75k, 731.9% for AGIs $75k-100k, 1509.3% for AGIs $100k-200k, 9695.0% for AGIs over 200k)
Charity contributions: $6,107 (reported on 7.8% of returns)
Here:
$6,107
State:
$8,791
(% of AGI for various income ranges: 20.9% for AGIs $25k-50k, 55.0% for AGIs $50k-75k, 92.7% for AGIs $75k-100k, 223.7% for AGIs $100k-200k, 1850.0% for AGIs over 200k)
Taxes paid: $7,805 (reported on 12.1% of returns)
97325:
$7,805
State:
$8,487
(% of AGI for various income ranges: 40.3% for AGIs $25k-50k, 151.0% for AGIs $50k-75k, 240.4% for AGIs $75k-100k, 435.7% for AGIs $100k-200k, 2250.0% for AGIs over 200k)
Earned income credit: $2,270 (reported on 12.7% of returns)
Here:
$2,270
State:
$1,977
(% of AGI for various income ranges: 81.9% for AGIs below $25k, 69.2% for AGIs $25k-50k)
Percentage of individuals using paid preparers for their 2020 taxes: 92.2%
Here:
92%
State:
93%
(% for various income ranges: 90.5% for AGIs below $25k, 91.8% for AGIs $25k-50k, 91.5% for AGIs $50k-75k, 92.3% for AGIs $75k-100k, 94.8% for AGIs $100k-200k, 100.0% for AGIs over 200k)
Averages for the 2012 tax year for zip code 97325, filed in 2013:
Average Adjusted Gross Income (AGI) in 2012: $47,801 (Individual Income Tax Returns)
Here:
$47,801
State:
$57,845
Salary/wage: $41,613 (reported on 81.4% of returns)
Here:
$41,613
State:
$47,723
(% of AGI for various income ranges: 70.7% for AGIs below $25k, 78.7% for AGIs $25k-50k, 76.7% for AGIs $50k-75k, 73.0% for AGIs $75k-100k, 74.5% for AGIs $100k-200k, 26.6% for AGIs over 200k)
Taxable interest for individuals: $1,549 (reported on 28.2% of returns)
This zip code:
$1,549
Oregon:
$1,848
(% of AGI for various income ranges: 1.1% for AGIs below $25k, 0.9% for AGIs $25k-50k, 0.5% for AGIs $50k-75k, 0.9% for AGIs $75k-100k, 0.5% for AGIs $100k-200k, 2.5% for AGIs over 200k)
Ordinary dividends: $2,492 (reported on 13.2% of returns)
Here:
$2,492
State:
$5,987
(% of AGI for various income ranges: 1.0% for AGIs below $25k, 0.6% for AGIs $25k-50k, 0.6% for AGIs $50k-75k, 0.2% for AGIs $75k-100k, 0.6% for AGIs $100k-200k, 1.7% for AGIs over 200k)
Net capital gain/loss in AGI: +$7,555 (reported on 11.1% of returns)
Here:
+$7,555
State:
+$13,095
(% of AGI for various income ranges: 0.8% for AGIs $75k-100k, 1.2% for AGIs $100k-200k, 15.3% for AGIs over 200k)
Profit/loss from business: +$8,509 (reported on 12.5% of returns)
Here:
+$8,509
State:
+$13,871
(% of AGI for various income ranges: 4.2% for AGIs below $25k, 2.4% for AGIs $25k-50k, 1.4% for AGIs $50k-75k, 1.8% for AGIs $75k-100k, 3.2% for AGIs $100k-200k)
Taxable individual retirement arrangement distribution: $12,613 (reported on 10.7% of returns)
97325:
$12,613
Oregon:
$16,036
(% of AGI for various income ranges: 3.3% for AGIs below $25k, 2.5% for AGIs $25k-50k, 2.1% for AGIs $50k-75k, 2.2% for AGIs $75k-100k, 5.2% for AGIs $100k-200k)
Total itemized deductions: $20,055 (26% of AGI, reported on 40.7% of returns)
Here:
$20,055
State:
$24,430
Here:
26.4% of AGI
State:
23.2% of AGI
(% of AGI for various income ranges: 15.3% for AGIs below $25k, 13.2% for AGIs $25k-50k, 18.7% for AGIs $50k-75k, 20.4% for AGIs $75k-100k, 18.2% for AGIs $100k-200k, 14.5% for AGIs over 200k)
Charity contributions: $2,750 (reported on 31.4% of returns)
Here:
$2,750
State:
$3,648
(% of AGI for various income ranges: 1.2% for AGIs below $25k, 1.4% for AGIs $25k-50k, 1.5% for AGIs $50k-75k, 2.4% for AGIs $75k-100k, 2.4% for AGIs $100k-200k, 1.3% for AGIs over 200k)
Taxes paid: $6,866 (reported on 40.4% of returns)
97325:
$6,866
State:
$10,269
(% of AGI for various income ranges: 2.7% for AGIs below $25k, 3.8% for AGIs $25k-50k, 5.6% for AGIs $50k-75k, 7.0% for AGIs $75k-100k, 7.6% for AGIs $100k-200k, 7.2% for AGIs over 200k)
Earned income credit: $2,244 (reported on 19.6% of returns)
Here:
$2,244
State:
$2,021
(% of AGI for various income ranges: 6.5% for AGIs below $25k, 1.4% for AGIs $25k-50k)
Percentage of individuals using paid preparers for their 2012 taxes: 46.1%
Here:
46%
State:
47%
(% for various income ranges: 41.9% for AGIs below $25k, 44.6% for AGIs $25k-50k, 48.9% for AGIs $50k-75k, 53.6% for AGIs $75k-100k, 50.0% for AGIs $100k-200k, 75.0% for AGIs over 200k)
Averages for the 2004 tax year for zip code 97325, filed in 2005:
Average Adjusted Gross Income (AGI) in 2004: $39,772 (Individual Income Tax Returns)
Here:
$39,772
State:
$46,788
Salary/wage: $34,467 (reported on 84.3% of returns)
Here:
$34,467
State:
$39,788
(% of AGI for various income ranges: 120.8% for AGIs below $10k, 73.7% for AGIs $10k-25k, 81.7% for AGIs $25k-50k, 78.8% for AGIs $50k-75k, 78.5% for AGIs $75k-100k, 47.4% for AGIs over 100k)
Taxable interest for individuals: $1,857 (reported on 39.4% of returns)
This zip code:
$1,857
Oregon:
$2,126
(% of AGI for various income ranges: 5.3% for AGIs below $10k, 2.4% for AGIs $10k-25k, 1.1% for AGIs $25k-50k, 1.5% for AGIs $50k-75k, 1.2% for AGIs $75k-100k, 3.1% for AGIs over 100k)
Taxable dividends: $1,926 (reported on 17.0% of returns)
Here:
$1,926
State:
$3,427
(% of AGI for various income ranges: 2.4% for AGIs below $10k, 0.8% for AGIs $10k-25k, 0.6% for AGIs $25k-50k, 0.3% for AGIs $50k-75k, 0.3% for AGIs $75k-100k, 2.0% for AGIs over 100k)
Net capital gain/loss: +$11,268 (reported on 15.3% of returns)
Here:
+$11,268
State:
+$12,447
(% of AGI for various income ranges: 3.4% for AGIs below $10k, 1.0% for AGIs $10k-25k, 0.6% for AGIs $25k-50k, 1.2% for AGIs $50k-75k, 2.1% for AGIs $75k-100k, 16.0% for AGIs over 100k)
Profit/loss from business: +$6,594 (reported on 15.1% of returns)
Here:
+$6,594
State:
+$11,682
(% of AGI for various income ranges: 1.5% for AGIs below $10k, 4.6% for AGIs $10k-25k, 2.5% for AGIs $25k-50k, 2.4% for AGIs $50k-75k, 1.2% for AGIs $75k-100k, 2.7% for AGIs over 100k)
IRA payment deduction: $2,947 (reported on 3.0% of returns)
97325:
$2,947
Oregon:
$3,035
(% of AGI for various income ranges: 0.3% for AGIs $10k-25k, 0.2% for AGIs $25k-50k, 0.3% for AGIs $50k-75k, 0.3% for AGIs over 100k)
Total itemized deductions: $17,271 (27% of AGI, reported on 40.9% of returns)
Here:
$17,271
State:
$20,209
Here:
26.5% of AGI
State:
24.7% of AGI
(% of AGI for various income ranges: 19.4% for AGIs below $10k, 12.7% for AGIs $10k-25k, 16.5% for AGIs $25k-50k, 18.3% for AGIs $50k-75k, 19.5% for AGIs $75k-100k, 19.6% for AGIs over 100k)
Charity contributions deductions: $2,577 (4% of AGI, reported on 34.0% of returns)
Here:
$2,577
State:
$3,145
Here:
3.8% of AGI
State:
3.6% of AGI
(% of AGI for various income ranges: 1.6% for AGIs below $10k, 1.2% for AGIs $10k-25k, 1.5% for AGIs $25k-50k, 2.0% for AGIs $50k-75k, 2.0% for AGIs $75k-100k, 3.9% for AGIs over 100k)
Total tax: $4,806 (reported on 71.5% of returns)
97325:
$4,806
State:
$7,148
(% of AGI for various income ranges: 3.0% for AGIs below $10k, 3.7% for AGIs $10k-25k, 5.7% for AGIs $25k-50k, 7.8% for AGIs $50k-75k, 9.3% for AGIs $75k-100k, 15.6% for AGIs over 100k)
Earned income credit: $1,763 (reported on 17.1% of returns)
Here:
$1,763
State:
$1,605
Percentage of individuals using paid preparers for their 2004 taxes: 51.6%
Here:
52%
State:
53%
(% for various income ranges: 44.1% for AGIs below $10k, 53.9% for AGIs $10k-25k, 49.8% for AGIs $25k-50k, 54.2% for AGIs $50k-75k, 60.1% for AGIs $75k-100k, 59.5% for AGIs over 100k)
Household received Food Stamps/SNAP in the past 12 months: 444 Household did not receive Food Stamps/SNAP in the past 12 months: 1,858
Women who had a birth in the past 12 months: 60 (26 now married, 33 unmarried) Women who did not have a birth in the past 12 months: 1,562 (712 now married, 845 unmarried)
Housing units in zip code 97325 with a mortgage: 1,171 (61 second mortgage, 64 both second mortgage and home equity loan) Median monthly owner costs for units with a mortgage: $1,743 Median monthly owner costs for units without a mortgage: $483
Residents with income below the poverty level in 2022:
This zip code:
7.3%
Whole state:
12.1%
Residents with income below 50% of the poverty level in 2022:
This zip code:
3.2%
Whole state:
6.2%
Median number of rooms in houses and condos:
Here:
6.3
State:
6.2
Median number of rooms in apartments:
Here:
4.9
State:
4.0
Notable locations in this zip code not listed on our city pages
Notable locations in zip code 97325: Oakley Farms (A), Cherriots State Highway 22 and Golf Club Road Park and Ride (B), Aumsville Sewage Treatment Plant (C), Stayton Sewage Treatment Plant (D), Shaff (E), Aumsville Public Works Department (F), Aumsville Municipal Court (G), Aumsville City Hall (H), Aumsville Post Office (I), Aumsville Rural Fire Protection District (J), Aumsville Rural Fire Protection District Substation 670 (K). Display/hide their locations on the map
Churches in zip code 97325 include: Willamette Valley Baptist Church (A), Church of God of Prophecy Bible Place (B). Display/hide their locations on the map
Cemeteries: Aumsville Cemetery (1), Kimsey-Walker Cemetery (2), Shaw Catholic Cemetery (3), Anderson Lone Fir Pioneer Cemetery (4). Display/hide their locations on the map
In group quarters: 35 (-1 institutionalized population)
Size of family households: 642 2-persons, 449 3-persons, 295 4-persons, 315 5-persons, 90 6-persons, 1 7-or-more-persons
Size of nonfamily households: 401 1-person, 43 2-persons, 9 7-or-more-persons
978 married couples with children.
364 single-parent households (14 men, 350 women).
92.0% of residents of 97325 zip code speak English at home.
7.2% of residents speak Spanish at home (63% very well, 26% well, 9% not well, 3% not at all).
0.4% of residents speak Asian or Pacific Island language at home (100% very well).
Foreign born population: 221 (3.2%) (38.8% of them are naturalized citizens)
This zip code:
3.2%
Whole state:
9.9%
71%Honduras
8%Sweden
6%Germany
5%Japan
5%Malaysia
2%Costa Rica
13%German
10%European
8%English
6%American
4%Irish
4%Italian
3%Northern European
Year of entry for the foreign-born population
02010 or later
02000 to 2009
1291990 to 1999
89Before 1990
Facilities with environmental interests located in this zip code:
EKTRON INDUSTRIES (9610 MILL CREEK RD. in AUMSVILLE, OR)
STATE MASTER (Oregon inspections and permits database) - OR-HWMS-1562, CESQG STATE MASTER (Oregon inspections and permits database) - OR-ECSI-1425, SUPERFUND Conditionally Exempt Small Quantity Generators, less than 100 kg/month of hazardous waste (Resource Conservation and Recovery Act (tracking hazardous waste)) - notification TRI REPORTER (Tracking of toxic chemicals releasing facilities) Business SIC and NAICS classification: ELECTROPLATING, PLATING, POLISHING, ANODIZING, AND COLORING Organizations: EKTRON INDUSTRIES INC (CONTACT/ HAZARDOUS WASTE)
AUMSVILLE ELEM. SCHOOL (572 N 11TH ST in AUMSVILLE, OR)
COMPLIANCE ACTIVITY (Tracking inspections of insecticide, fungicide, and rodenticide, and toxic substances) (National Center for Education Statistics) - STATE ID-719 STATE MASTER (Oregon inspections and permits database) - OR-LUST-24-90-4334, LEAKING STORAGE TANK, OR-LUST-24-92-4169, (Resource Conservation and Recovery Act (tracking hazardous waste)) Organizations: CASCADE HIGH SCHOOL DIST. (CONTACT/GENERAL)
, AUMSVILLE ELEMENTARY SCHOOL DIST. 11 (CONTACT/GENERAL)
, CASCADE SCH DIST 005 (SCHOOL DISTRICT)
Alternative names: AUMSVILLE ELEMENTARY SCHOOL, AUMSVILLE SD 11C
BLAZER INDUSTRIES INC (945 OLNEY ST in AUMSVILLE, OR)
COMPLIANCE ACTIVITY (Tracking inspections of insecticide, fungicide, and rodenticide, and toxic substances) STATE MASTER (Oregon inspections and permits database) - OR-HWMS-4407, CESQG Conditionally Exempt Small Quantity Generators, less than 100 kg/month of hazardous waste (Resource Conservation and Recovery Act (tracking hazardous waste)) - notification Business SIC classification: PREFABRICATED WOOD BUILDINGS AND COMPONENTS Business NAICS classification: PREFABRICATED WOOD BUILDING MANUFACTURING.; PREFABRICATED WOOD BUILDING MANUFACTURING. Organizations: SHETLER & SHETLER (CONTACT/OPERATOR)
AUMSVILLE, CITY OF (BEAVER CREEK AT R.M. 2.5 in AUMSVILLE, OR)
STATE MASTER (Oregon inspections and permits database) - OR-SIS-4475-100352, NPDES NON-MAJOR, OR-SIS-4475-100881, OR-SIS-4475-101784, OR-SIS-4475-3481, National Pollutant Discharge Elimination System NON-MAJOR (Tracking pollutant discharge elimination systems) - permit COMMUNITY WATER SYSTEM (SDWIS) Business SIC classification: SEWERAGE SYSTEMS Organizations: CITY OF AUMSVILLE (CONTACT/OWNER)
CASCADE FLOORS SHOP (11832 STEINKAMP RD SE in AUMSVILLE, OR)
STATE MASTER (Oregon inspections and permits database) - OR-HWMS-494, CESQG (Resource Conservation and Recovery Act (tracking hazardous waste)) Organizations: VIC MORATTE (CONTACT/OWNER)
COLUMBIA SPAS INC MFG FAC (9493 PORTER RD in AUMSVILLE, OR)
Conditionally Exempt Small Quantity Generators, less than 100 kg/month of hazardous waste (Resource Conservation and Recovery Act (tracking hazardous waste)) HAZARDOUS WASTE BIENNIAL REPORTER (Resource Conservation and Recovery Act (tracking hazardous waste)) Business NAICS classification: PLASTICS PLUMBING FIXTURE MANUFACTURING.
DOERFLER, ROBERT (12333 SILVER CREEK FALLS RD in AUMSVILLE, OR)
(Resource Conservation and Recovery Act (tracking hazardous waste))
HATCH ENGINE SERVICE (ROUTE 1 in AUMSVILLE, OR)
(Resource Conservation and Recovery Act (tracking hazardous waste)) Business NAICS classification: OTHER COMMERCIAL AND SERVICE INDUSTRY MACHINERY MANUFACTURING.
BLAIR FARMS (9367 STAYTON RD SE in AUMSVILLE, OR)
TRANSPORTER (Resource Conservation and Recovery Act (tracking hazardous waste)) Organizations: FRANK & GLENDA BLAIR (CONTACT/OWNER)
52.0%Electricity
36.0%Utility gas
6.7%Wood
2.5%Fuel oil, kerosene, etc.
1.1%No fuel used
0.9%Other fuel
0.6%Bottled, tank, or LP gas
Population in 1990: 4,185. Population change in the 1990s: +1,602 (+38.3%).
Place of birth for U.S.-born residents:
This state: 4,371
Northeast: 63
Midwest: 196
South: 259
West: 1,821
53% of the 97325 zip code residents lived in the same house 5 years ago. Out of people who lived in different houses, 74% lived in this county. Out of people who lived in different counties, 50% lived in Oregon.
83% of the 97325 zip code residents lived in the same house 1 year ago. Out of people who lived in different houses, 73% moved from this county. Out of people who lived in different houses, 5% moved from different county within same state. Out of people who lived in different houses, 16% moved from different state.
Private vs. public school enrollment:
Students in private schools in grades 1 to 8 (elementary and middle school): 27
Here:
4.7%
Oregon:
13.7%
Students in private schools in grades 9 to 12 (high school): 34
Here:
9.9%
Oregon:
8.8%
Students in private undergraduate colleges: 43
Here:
19.2%
Oregon:
17.7%
Occupation by median earnings in the past 12 months ($)
98,179Fire fighting and prevention, and other protective service workers including supervisors
90,708Business and financial operations occupations
84,595Arts, design, entertainment, sports, and media occupations
71,712Production occupations
70,149Management occupations
69,152Construction and extraction occupations
Top industries in this zip code by the number of employees in 2005:
Administrative and Support and Waste Management and Remediation Services: Landscaping Services (50-99 employees: 1 establishment, 1-4 employees: 3 establishments)
Construction: Poured Concrete Foundation and Structure Contractors (20-49: 1, 1-4: 1)
Accommodation and Food Services: Full-Service Restaurants (10-19: 2, 1-4: 2)
Arts, Entertainment, and Recreation: Golf Courses and Country Clubs (20-49: 1)
People in group quarters in 2010:
28 people in group homes intended for adults
People in group quarters in 2000:
7 people in nursing homes
Fatal accident statistics in 2012:
Fatal accident count: 1
Vehicles involved in fatal accidents: 1
Fatal accidents caused by drunken drivers: 1
Fatalities: 1
Persons involved in fatal accidents: 2
Pedestrians involved in fatal accidents: 0
Fatal accident statistics in 2011:
Fatal accident count: 1
Vehicles involved in fatal accidents: 1
Fatal accidents caused by drunken drivers: 1
Fatalities: 2
Persons involved in fatal accidents: 3
Pedestrians involved in fatal accidents: 0
Home Mortgage Disclosure Act Aggregated Statistics For Year 2009 (Based on 6 partial tracts)
A) FHA, FSA/RHS & VA Home Purchase Loans
B) Conventional Home Purchase Loans
C) Refinancings
D) Home Improvement Loans
F) Non-occupant Loans on < 5 Family Dwellings (A B C & D)
G) Loans On Manufactured Home Dwelling (A B C & D)
Number
Average Value
Number
Average Value
Number
Average Value
Number
Average Value
Number
Average Value
Number
Average Value
LOANS ORIGINATED
25
$223,368
32
$232,113
209
$225,911
8
$139,074
10
$208,483
20
$146,902
APPLICATIONS APPROVED, NOT ACCEPTED
1
$188,520
2
$361,765
26
$251,040
2
$99,630
0
$0
3
$151,210
APPLICATIONS DENIED
7
$220,014
8
$222,668
83
$247,216
7
$100,939
4
$175,060
10
$136,227
APPLICATIONS WITHDRAWN
4
$225,715
3
$208,640
40
$242,705
2
$97,080
2
$165,340
1
$196,770
FILES CLOSED FOR INCOMPLETENESS
0
$0
1
$193,230
14
$256,029
0
$0
0
$0
2
$93,660
Aggregated Statistics For Year 2008 (Based on 6 partial tracts)
A) FHA, FSA/RHS & VA Home Purchase Loans
B) Conventional Home Purchase Loans
C) Refinancings
D) Home Improvement Loans
F) Non-occupant Loans on < 5 Family Dwellings (A B C & D)
G) Loans On Manufactured Home Dwelling (A B C & D)
Number
Average Value
Number
Average Value
Number
Average Value
Number
Average Value
Number
Average Value
Number
Average Value
LOANS ORIGINATED
12
$222,370
42
$240,113
114
$223,828
9
$114,079
13
$181,808
20
$180,826
APPLICATIONS APPROVED, NOT ACCEPTED
1
$124,520
9
$188,097
18
$209,797
2
$116,400
3
$120,850
4
$166,690
APPLICATIONS DENIED
4
$199,712
16
$285,548
83
$260,010
15
$136,702
5
$255,096
15
$161,761
APPLICATIONS WITHDRAWN
1
$312,940
8
$305,891
26
$235,417
3
$839,460
2
$153,835
6
$152,298
FILES CLOSED FOR INCOMPLETENESS
0
$0
2
$304,145
8
$244,259
2
$91,605
0
$0
1
$165,720
Aggregated Statistics For Year 2007 (Based on 6 partial tracts)
A) FHA, FSA/RHS & VA Home Purchase Loans
B) Conventional Home Purchase Loans
C) Refinancings
D) Home Improvement Loans
E) Loans on Dwellings For 5+ Families
F) Non-occupant Loans on < 5 Family Dwellings (A B C & D)
G) Loans On Manufactured Home Dwelling (A B C & D)
Number
Average Value
Number
Average Value
Number
Average Value
Number
Average Value
Number
Average Value
Number
Average Value
Number
Average Value
LOANS ORIGINATED
5
$196,492
94
$201,446
150
$206,111
19
$131,268
2
$1,234,085
17
$186,481
22
$138,170
APPLICATIONS APPROVED, NOT ACCEPTED
1
$261,140
15
$200,499
30
$181,127
3
$93,943
0
$0
1
$235,930
5
$136,484
APPLICATIONS DENIED
2
$165,055
25
$192,716
97
$218,695
21
$112,302
0
$0
9
$194,504
21
$114,017
APPLICATIONS WITHDRAWN
0
$0
11
$202,971
31
$202,980
3
$196,560
0
$0
3
$202,503
5
$206,930
FILES CLOSED FOR INCOMPLETENESS
0
$0
4
$213,585
17
$198,820
2
$109,155
0
$0
1
$117,030
2
$137,860
Aggregated Statistics For Year 2006 (Based on 6 partial tracts)
A) FHA, FSA/RHS & VA Home Purchase Loans
B) Conventional Home Purchase Loans
C) Refinancings
D) Home Improvement Loans
F) Non-occupant Loans on < 5 Family Dwellings (A B C & D)
G) Loans On Manufactured Home Dwelling (A B C & D)
Number
Average Value
Number
Average Value
Number
Average Value
Number
Average Value
Number
Average Value
Number
Average Value
LOANS ORIGINATED
3
$240,327
122
$172,443
146
$180,304
20
$129,721
21
$182,530
22
$129,806
APPLICATIONS APPROVED, NOT ACCEPTED
1
$245,040
20
$152,908
28
$193,694
4
$198,545
2
$167,855
3
$159,433
APPLICATIONS DENIED
2
$122,825
33
$158,802
71
$184,066
19
$87,819
6
$240,842
12
$138,822
APPLICATIONS WITHDRAWN
0
$0
15
$154,701
52
$179,109
3
$183,553
6
$113,755
3
$157,140
FILES CLOSED FOR INCOMPLETENESS
0
$0
3
$160,713
17
$195,611
0
$0
1
$150,360
0
$0
Aggregated Statistics For Year 2005 (Based on 6 partial tracts)
A) FHA, FSA/RHS & VA Home Purchase Loans
B) Conventional Home Purchase Loans
C) Refinancings
D) Home Improvement Loans
E) Loans on Dwellings For 5+ Families
F) Non-occupant Loans on < 5 Family Dwellings (A B C & D)
G) Loans On Manufactured Home Dwelling (A B C & D)
Number
Average Value
Number
Average Value
Number
Average Value
Number
Average Value
Number
Average Value
Number
Average Value
Number
Average Value
LOANS ORIGINATED
7
$179,440
146
$163,863
151
$172,173
16
$156,582
1
$351,780
18
$142,286
25
$126,516
APPLICATIONS APPROVED, NOT ACCEPTED
0
$0
25
$126,781
28
$153,450
4
$71,895
0
$0
2
$88,545
6
$68,862
APPLICATIONS DENIED
2
$201,845
42
$136,024
96
$221,044
16
$73,981
0
$0
8
$130,671
21
$148,851
APPLICATIONS WITHDRAWN
0
$0
21
$144,029
57
$168,376
10
$166,209
0
$0
4
$102,025
7
$150,717
FILES CLOSED FOR INCOMPLETENESS
0
$0
5
$132,098
13
$193,544
1
$120,500
0
$0
1
$124,110
1
$115,930
Aggregated Statistics For Year 2004 (Based on 6 partial tracts)
A) FHA, FSA/RHS & VA Home Purchase Loans
B) Conventional Home Purchase Loans
C) Refinancings
D) Home Improvement Loans
F) Non-occupant Loans on < 5 Family Dwellings (A B C & D)
G) Loans On Manufactured Home Dwelling (A B C & D)
Number
Average Value
Number
Average Value
Number
Average Value
Number
Average Value
Number
Average Value
Number
Average Value
LOANS ORIGINATED
10
$146,253
125
$147,861
145
$154,052
12
$84,701
19
$124,862
26
$124,790
APPLICATIONS APPROVED, NOT ACCEPTED
0
$0
18
$132,604
32
$155,534
3
$79,913
2
$105,000
6
$94,725
APPLICATIONS DENIED
1
$104,550
33
$125,863
89
$179,821
14
$57,009
5
$132,266
22
$108,029
APPLICATIONS WITHDRAWN
2
$169,675
22
$199,322
53
$148,495
6
$93,590
3
$131,580
6
$126,113
FILES CLOSED FOR INCOMPLETENESS
1
$94,790
5
$138,996
11
$314,981
0
$0
1
$101,230
1
$175,510
Aggregated Statistics For Year 2003 (Based on 6 partial tracts)
A) FHA, FSA/RHS & VA Home Purchase Loans
B) Conventional Home Purchase Loans
C) Refinancings
D) Home Improvement Loans
E) Loans on Dwellings For 5+ Families
F) Non-occupant Loans on < 5 Family Dwellings (A B C & D)
Number
Average Value
Number
Average Value
Number
Average Value
Number
Average Value
Number
Average Value
Number
Average Value
LOANS ORIGINATED
8
$122,781
93
$156,741
372
$147,630
14
$40,903
1
$1,197,380
14
$124,610
APPLICATIONS APPROVED, NOT ACCEPTED
1
$196,090
18
$123,449
55
$140,725
3
$57,253
0
$0
3
$135,247
APPLICATIONS DENIED
3
$115,080
19
$117,442
119
$141,706
10
$26,683
0
$0
7
$116,969
APPLICATIONS WITHDRAWN
2
$113,605
9
$126,230
67
$153,182
1
$24,030
0
$0
2
$98,290
FILES CLOSED FOR INCOMPLETENESS
2
$120,135
2
$116,500
13
$157,511
1
$47,080
0
$0
1
$111,800
Aggregated Statistics For Year 2002 (Based on 2 partial tracts)
A) FHA, FSA/RHS & VA Home Purchase Loans
B) Conventional Home Purchase Loans
C) Refinancings
D) Home Improvement Loans
F) Non-occupant Loans on < 5 Family Dwellings (A B C & D)
Number
Average Value
Number
Average Value
Number
Average Value
Number
Average Value
Number
Average Value
LOANS ORIGINATED
6
$125,883
39
$156,275
106
$171,171
4
$36,628
5
$142,962
APPLICATIONS APPROVED, NOT ACCEPTED
0
$0
6
$150,958
12
$171,954
1
$51,740
0
$0
APPLICATIONS DENIED
0
$0
6
$176,968
19
$190,979
4
$20,668
0
$0
APPLICATIONS WITHDRAWN
1
$79,020
2
$168,015
19
$155,045
1
$9,560
1
$172,380
FILES CLOSED FOR INCOMPLETENESS
0
$0
1
$59,330
4
$155,925
0
$0
1
$96,730
Aggregated Statistics For Year 2001 (Based on 2 partial tracts)
A) FHA, FSA/RHS & VA Home Purchase Loans
B) Conventional Home Purchase Loans
C) Refinancings
D) Home Improvement Loans
F) Non-occupant Loans on < 5 Family Dwellings (A B C & D)
Number
Average Value
Number
Average Value
Number
Average Value
Number
Average Value
Number
Average Value
LOANS ORIGINATED
7
$122,603
27
$140,891
89
$152,742
8
$29,315
2
$127,100
APPLICATIONS APPROVED, NOT ACCEPTED
1
$68,330
6
$147,817
7
$133,490
2
$15,325
0
$0
APPLICATIONS DENIED
0
$0
8
$104,606
24
$147,442
3
$33,650
1
$76,210
APPLICATIONS WITHDRAWN
0
$0
2
$75,785
15
$148,792
1
$80,140
1
$136,100
FILES CLOSED FOR INCOMPLETENESS
0
$0
1
$193,180
4
$195,505
1
$38,810
0
$0
Aggregated Statistics For Year 2000 (Based on 2 partial tracts)
A) FHA, FSA/RHS & VA Home Purchase Loans
B) Conventional Home Purchase Loans
C) Refinancings
D) Home Improvement Loans
F) Non-occupant Loans on < 5 Family Dwellings (A B C & D)
Number
Average Value
Number
Average Value
Number
Average Value
Number
Average Value
Number
Average Value
LOANS ORIGINATED
2
$140,740
22
$162,904
26
$138,610
11
$27,225
2
$102,640
APPLICATIONS APPROVED, NOT ACCEPTED
0
$0
5
$90,208
6
$105,450
1
$32,900
1
$135,540
APPLICATIONS DENIED
1
$90,830
10
$101,457
20
$118,146
4
$32,127
3
$100,107
APPLICATIONS WITHDRAWN
0
$0
3
$157,283
8
$129,669
0
$0
1
$84,080
FILES CLOSED FOR INCOMPLETENESS
0
$0
0
$0
6
$127,008
0
$0
0
$0
Aggregated Statistics For Year 1999 (Based on 2 partial tracts)
A) FHA, FSA/RHS & VA Home Purchase Loans
B) Conventional Home Purchase Loans
C) Refinancings
D) Home Improvement Loans
F) Non-occupant Loans on < 5 Family Dwellings (A B C & D)
2002 - 2018 National Fire Incident Reporting System (NFIRS) incidents
Based on the data from the years 2002 - 2018 the average number of fires per year is 30. The highest number of reported fires - 56 took place in 2016, and the least - 6 in 2017. The data has a decreasing trend.
When looking into fire subcategories, the most reports belonged to: Outside Fires (45.3%), and Structure Fires (38.6%).
Fire incident types reported to NFIRS in Zip Code 97325


 Nearest zip codes: 97392, 97317, 97385, 97383, 97381, 97374.


 Based on the data from the years 2002 - 2018 the average number of fires per year is 30. The highest number of reported fires - 56 took place in 2016, and the least - 6 in 2017. The data has a decreasing trend.
 When looking into fire subcategories, the most reports belonged to: Outside Fires (45.3%), and Structure Fires (38.6%).