Estimated zip code population in 2022: 3,922 Zip code population in 2010: 3,257 Zip code population in 2000: 2,654
Houses and condos: 1,611 Renter-occupied apartments: 454
% of renters here:
28%
State:
37%
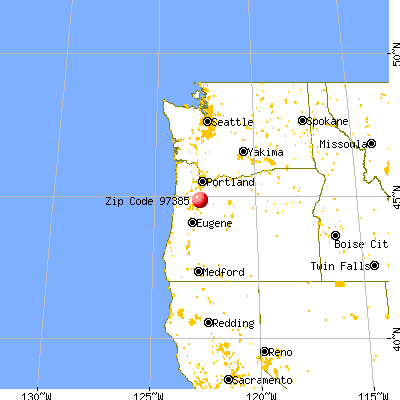
March 2022 cost of living index in zip code 97385: 97.4 (near average, U.S. average is 100)
Land area: 40.8 sq. mi. Water area: 0.0 sq. mi.
Population density: 96 people per square mile
(very low).
OSM Map
General Map
Google Map
MSN Map
OSM Map
General Map
Google Map
MSN Map
OSM Map
General Map
Google Map
MSN Map
OSM Map
General Map
Google Map
MSN Map
Please wait while loading the map...
Real estate property taxes paid for housing units in 2022:
This zip code:
0.7% ($3,326)
Oregon:
0.8% ($3,646)
Median real estate property taxes paid for housing units with mortgages in 2022: $3,573 (0.6%) Median real estate property taxes paid for housing units with no mortgage in 2022: $2,998 (0.7%)
Business Search- 14 Million verified businesses
Males: 2,050
(52.3%)
Females: 1,873
(47.7%)
For population 25 years and over in 97385:
High school or higher: 86.2%
Bachelor's degree or higher: 29.5%
Graduate or professional degree: 6.5%
Unemployed: 1.4%
Mean travel time to work (commute): 22.2 minutes
For population 15 years and over in 97385:
Never married: 21.1%
Now married: 56.6%
Separated: 0.1%
Widowed: 13.1%
Divorced: 9.0%
Zip code 97385 compared to state average:
Unemployed percentage significantly below state average.
Black race population percentage significantly below state average.
Median age above state average.
Length of stay since moving in above state average.
Estimated median house/condo value in 2022: $507,861
97385:
$507,861
Oregon:
$475,600
According to our research of Oregon and other state lists, there was 1 registered sex offender living in 97385 zip code as of May 28, 2024. The ratio of all residents to sex offenders in zip code 97385 is 3,258 to 1. The ratio of registered sex offenders to all residents in this zip code is lower than the state average.
Median resident age:
This zip code:
46.8 years
Oregon median age:
40.5 years
Average household size:
This zip code:
2.4 people
Oregon:
2.4 people
Averages for the 2020 tax year for zip code 97385, filed in 2021:
Average Adjusted Gross Income (AGI) in 2020: $93,380 (Individual Income Tax Returns)
Here:
$93,380
State:
$76,001
Salary/wage: $67,365 (reported on 72.2% of returns)
Here:
$67,365
State:
$61,959
(% of AGI for various income ranges: 1114.2% for AGIs below $25k, 3349.2% for AGIs $25k-50k, 6321.2% for AGIs $50k-75k, 9682.3% for AGIs $75k-100k, 21273.2% for AGIs $100k-200k, 78495.0% for AGIs over 200k)
Taxable interest for individuals: $2,962 (reported on 42.8% of returns)
This zip code:
$2,962
Oregon:
$1,628
(% of AGI for various income ranges: 44.2% for AGIs below $25k, 49.2% for AGIs $25k-50k, 210.6% for AGIs $50k-75k, 160.8% for AGIs $75k-100k, 260.5% for AGIs $100k-200k, 5265.0% for AGIs over 200k)
Ordinary dividends: $6,125 (reported on 21.4% of returns)
Here:
$6,125
State:
$7,165
(% of AGI for various income ranges: 52.3% for AGIs below $25k, 70.0% for AGIs $25k-50k, 171.2% for AGIs $50k-75k, 193.1% for AGIs $75k-100k, 363.2% for AGIs $100k-200k, 4440.0% for AGIs over 200k)
Net capital gain/loss in AGI: +$25,349 (reported on 23.0% of returns)
Here:
+$25,349
State:
+$23,403
(% of AGI for various income ranges: 34.8% for AGIs below $25k, 84.2% for AGIs $25k-50k, 85.9% for AGIs $50k-75k, 355.4% for AGIs $75k-100k, 901.6% for AGIs $100k-200k, 41345.0% for AGIs over 200k)
Profit/loss from business: +$15,723 (reported on 11.8% of returns)
Here:
+$15,723
State:
+$16,511
(% of AGI for various income ranges: 81.3% for AGIs below $25k, 53.8% for AGIs $25k-50k, 192.9% for AGIs $50k-75k, 233.1% for AGIs $75k-100k, 374.7% for AGIs $100k-200k, 8675.0% for AGIs over 200k)
Taxable individual retirement arrangement distribution: $20,870 (reported on 14.4% of returns)
97385:
$20,870
Oregon:
$20,730
(% of AGI for various income ranges: 108.1% for AGIs below $25k, 244.6% for AGIs $25k-50k, 329.4% for AGIs $50k-75k, 557.7% for AGIs $75k-100k, 1804.2% for AGIs $100k-200k)
Total itemized deductions: $34,169 (reported on 13.9% of returns)
Here:
$34,169
State:
$31,050
(% of AGI for various income ranges: 315.8% for AGIs below $25k, 675.3% for AGIs $50k-75k, 1002.3% for AGIs $75k-100k, 1637.4% for AGIs $100k-200k, 11715.0% for AGIs over 200k)
Charity contributions: $8,786 (reported on 11.2% of returns)
Here:
$8,786
State:
$8,791
(% of AGI for various income ranges: 38.1% for AGIs below $25k, 92.4% for AGIs $50k-75k, 150.8% for AGIs $75k-100k, 403.2% for AGIs $100k-200k, 3040.0% for AGIs over 200k)
Taxes paid: $8,254 (reported on 13.9% of returns)
97385:
$8,254
State:
$8,487
(% of AGI for various income ranges: 40.6% for AGIs below $25k, 151.2% for AGIs $50k-75k, 304.6% for AGIs $75k-100k, 487.9% for AGIs $100k-200k, 2200.0% for AGIs over 200k)
Earned income credit: $1,836 (reported on 5.9% of returns)
Here:
$1,836
State:
$1,977
(% of AGI for various income ranges: 42.6% for AGIs below $25k, 29.2% for AGIs $25k-50k)
Percentage of individuals using paid preparers for their 2020 taxes: 90.4%
Here:
90%
State:
93%
(% for various income ranges: 89.4% for AGIs below $25k, 91.4% for AGIs $25k-50k, 86.2% for AGIs $50k-75k, 91.3% for AGIs $75k-100k, 92.9% for AGIs $100k-200k, 90.9% for AGIs over 200k)
Averages for the 2012 tax year for zip code 97385, filed in 2013:
Average Adjusted Gross Income (AGI) in 2012: $56,049 (Individual Income Tax Returns)
Here:
$56,049
State:
$57,845
Salary/wage: $50,472 (reported on 76.3% of returns)
Here:
$50,472
State:
$47,723
(% of AGI for various income ranges: 66.2% for AGIs below $25k, 65.9% for AGIs $25k-50k, 65.8% for AGIs $50k-75k, 66.7% for AGIs $75k-100k, 72.6% for AGIs $100k-200k, 71.7% for AGIs over 200k)
Taxable interest for individuals: $2,010 (reported on 38.8% of returns)
This zip code:
$2,010
Oregon:
$1,848
(% of AGI for various income ranges: 2.3% for AGIs below $25k, 2.6% for AGIs $25k-50k, 1.3% for AGIs $50k-75k, 1.5% for AGIs $75k-100k, 1.0% for AGIs $100k-200k)
Ordinary dividends: $3,684 (reported on 24.3% of returns)
Here:
$3,684
State:
$5,987
(% of AGI for various income ranges: 2.4% for AGIs below $25k, 1.7% for AGIs $25k-50k, 1.4% for AGIs $50k-75k, 1.5% for AGIs $75k-100k, 1.9% for AGIs $100k-200k)
Net capital gain/loss in AGI: +$3,631 (reported on 21.1% of returns)
Here:
+$3,631
State:
+$13,095
(% of AGI for various income ranges: 0.8% for AGIs $25k-50k, 1.7% for AGIs $50k-75k, 1.7% for AGIs $75k-100k, 2.0% for AGIs $100k-200k)
Profit/loss from business: +$7,840 (reported on 13.2% of returns)
Here:
+$7,840
State:
+$13,871
(% of AGI for various income ranges: 4.2% for AGIs below $25k, 2.3% for AGIs $25k-50k, 1.5% for AGIs $50k-75k, 3.2% for AGIs $75k-100k, 0.9% for AGIs $100k-200k)
Taxable individual retirement arrangement distribution: $13,382 (reported on 14.5% of returns)
97385:
$13,382
Oregon:
$16,036
(% of AGI for various income ranges: 4.7% for AGIs below $25k, 4.4% for AGIs $25k-50k, 3.8% for AGIs $50k-75k, 3.9% for AGIs $75k-100k, 3.1% for AGIs $100k-200k)
Total itemized deductions: $22,087 (26% of AGI, reported on 46.1% of returns)
Here:
$22,087
State:
$24,430
Here:
25.9% of AGI
State:
23.2% of AGI
(% of AGI for various income ranges: 16.0% for AGIs below $25k, 13.3% for AGIs $25k-50k, 16.7% for AGIs $50k-75k, 20.3% for AGIs $75k-100k, 18.8% for AGIs $100k-200k, 24.1% for AGIs over 200k)
Charity contributions: $3,305 (reported on 38.8% of returns)
Here:
$3,305
State:
$3,648
(% of AGI for various income ranges: 1.0% for AGIs below $25k, 1.7% for AGIs $25k-50k, 2.3% for AGIs $50k-75k, 2.9% for AGIs $75k-100k, 2.4% for AGIs $100k-200k, 2.7% for AGIs over 200k)
Taxes paid: $8,100 (reported on 44.7% of returns)
97385:
$8,100
State:
$10,269
(% of AGI for various income ranges: 1.5% for AGIs below $25k, 2.8% for AGIs $25k-50k, 5.2% for AGIs $50k-75k, 6.7% for AGIs $75k-100k, 8.2% for AGIs $100k-200k, 12.8% for AGIs over 200k)
Earned income credit: $2,013 (reported on 9.9% of returns)
Here:
$2,013
State:
$2,021
(% of AGI for various income ranges: 3.7% for AGIs below $25k, 0.7% for AGIs $25k-50k)
Percentage of individuals using paid preparers for their 2012 taxes: 51.3%
Here:
51%
State:
47%
(% for various income ranges: 46.0% for AGIs below $25k, 53.1% for AGIs $25k-50k, 56.0% for AGIs $50k-75k, 50.0% for AGIs $75k-100k, 54.5% for AGIs $100k-200k, 66.7% for AGIs over 200k)
Averages for the 2004 tax year for zip code 97385, filed in 2005:
Average Adjusted Gross Income (AGI) in 2004: $58,855 (Individual Income Tax Returns)
Here:
$58,855
State:
$46,788
Salary/wage: $41,589 (reported on 77.8% of returns)
Here:
$41,589
State:
$39,788
(% of AGI for various income ranges: 87.4% for AGIs below $10k, 62.4% for AGIs $10k-25k, 69.2% for AGIs $25k-50k, 67.5% for AGIs $50k-75k, 74.6% for AGIs $75k-100k, 35.0% for AGIs over 100k)
Taxable interest for individuals: $3,277 (reported on 53.0% of returns)
This zip code:
$3,277
Oregon:
$2,126
(% of AGI for various income ranges: 7.5% for AGIs below $10k, 4.7% for AGIs $10k-25k, 3.6% for AGIs $25k-50k, 3.1% for AGIs $50k-75k, 1.5% for AGIs $75k-100k, 2.9% for AGIs over 100k)
Taxable dividends: $2,493 (reported on 29.1% of returns)
Here:
$2,493
State:
$3,427
(% of AGI for various income ranges: 3.4% for AGIs below $10k, 2.8% for AGIs $10k-25k, 1.1% for AGIs $25k-50k, 2.1% for AGIs $50k-75k, 1.4% for AGIs $75k-100k, 0.5% for AGIs over 100k)
Net capital gain/loss: +$11,725 (reported on 26.4% of returns)
Here:
+$11,725
State:
+$12,447
(% of AGI for various income ranges: -4.6% for AGIs below $10k, 1.3% for AGIs $10k-25k, 1.9% for AGIs $25k-50k, 3.5% for AGIs $50k-75k, 4.2% for AGIs $75k-100k, 8.5% for AGIs over 100k)
Profit/loss from business: +$9,308 (reported on 15.0% of returns)
Here:
+$9,308
State:
+$11,682
(% of AGI for various income ranges: 4.7% for AGIs below $10k, 1.9% for AGIs $10k-25k, 3.0% for AGIs $25k-50k, 2.8% for AGIs $50k-75k, 5.1% for AGIs $75k-100k, 0.9% for AGIs over 100k)
IRA payment deduction: $3,550 (reported on 2.8% of returns)
97385:
$3,550
Oregon:
$3,035
Total itemized deductions: $21,051 (21% of AGI, reported on 46.7% of returns)
Here:
$21,051
State:
$20,209
Here:
21.4% of AGI
State:
24.7% of AGI
(% of AGI for various income ranges: 16.5% for AGIs below $10k, 21.3% for AGIs $10k-25k, 15.8% for AGIs $25k-50k, 20.5% for AGIs $50k-75k, 20.4% for AGIs $75k-100k, 13.2% for AGIs over 100k)
Charity contributions deductions: $3,032 (3% of AGI, reported on 41.8% of returns)
Here:
$3,032
State:
$3,145
Here:
2.9% of AGI
State:
3.6% of AGI
(% of AGI for various income ranges: 0.9% for AGIs below $10k, 2.8% for AGIs $10k-25k, 1.9% for AGIs $25k-50k, 2.8% for AGIs $50k-75k, 2.5% for AGIs $75k-100k, 1.8% for AGIs over 100k)
Total tax: $9,919 (reported on 75.7% of returns)
97385:
$9,919
State:
$7,148
(% of AGI for various income ranges: 2.3% for AGIs below $10k, 3.6% for AGIs $10k-25k, 6.6% for AGIs $25k-50k, 7.5% for AGIs $50k-75k, 9.1% for AGIs $75k-100k, 20.1% for AGIs over 100k)
Earned income credit: $1,690 (reported on 7.9% of returns)
Here:
$1,690
State:
$1,605
Percentage of individuals using paid preparers for their 2004 taxes: 56.6%
Here:
57%
State:
53%
(% for various income ranges: 37.0% for AGIs below $10k, 60.0% for AGIs $10k-25k, 60.1% for AGIs $25k-50k, 61.2% for AGIs $50k-75k, 58.4% for AGIs $75k-100k, 70.4% for AGIs over 100k)
Household received Food Stamps/SNAP in the past 12 months: 66 Household did not receive Food Stamps/SNAP in the past 12 months: 1,520
Women who had a birth in the past 12 months: 70 (61 now married, 9 unmarried) Women who did not have a birth in the past 12 months: 594 (409 now married, 173 unmarried)
Housing units in zip code 97385 with a mortgage: 662 (54 second mortgage, 57 both second mortgage and home equity loan) Houses without a mortgage: 27
Median monthly owner costs for units with a mortgage: $2,070 Median monthly owner costs for units without a mortgage: $607
Residents with income below the poverty level in 2022:
This zip code:
6.2%
Whole state:
12.1%
Residents with income below 50% of the poverty level in 2022:
This zip code:
2.7%
Whole state:
6.2%
Median number of rooms in houses and condos:
Here:
6.2
State:
6.2
Median number of rooms in apartments:
Here:
3.9
State:
4.0
Notable locations in this zip code not listed on our city pages
Notable locations in zip code 97385: Smith Creek Youth Camp (A), Sublimity Harvest Festival Grounds (B), South Burn Guard Station (C), Santiam Golf Club (D), Park Campground (E), Silver Falls Conference Center (F), Union Hill Grange (G), Sublimity Rural Fire Protection District (H), Sublimity Fire District Station 52 Substation (I), Sublimity Public Works Department Office (J), Sublimity City Hall (K). Display/hide their locations on the map
Cemeteries: Union Hill Cemetery (1), Saint Boniface Cemetery (2), Glover Cemetery (3), Hobson-Whitney Cemetery (4), Mater Dolorosa Cemetery (5). Display/hide their locations on the map
Creeks: East Fork Drift Creek (A), North Fork Silver Creek (B), West Fork Drift Creek (C), Howard Creek (D), Smith Creek (E). Display/hide their locations on the map
In group quarters: 155 (-1 institutionalized population)
Size of family households: 422 2-persons, 166 3-persons, 194 4-persons, 77 5-persons, 55 6-persons, 19 7-or-more-persons
Size of nonfamily households: 593 1-person, 75 2-persons
813 married couples with children.
129 single-parent households (84 men, 45 women).
87.8% of residents of 97385 zip code speak English at home.
12.0% of residents speak Spanish at home (65% very well, 32% well, 4% not well).
0.6% of residents speak other Indo-European language at home (30% very well, 70% well).
0.4% of residents speak Asian or Pacific Island language at home (86% very well, 14% not well).
0.1% of residents speak other language at home (100% very well).
Foreign born population: 312 (8.0%) (61.0% of them are naturalized citizens)
This zip code:
8.0%
Whole state:
9.9%
83%Honduras
2%Sweden
2%Japan
1%Netherlands
1%Malaysia
19%German
15%English
8%American
6%Irish
5%Finnish
5%European
4%Dutch
Year of entry for the foreign-born population
372010 or later
142000 to 2009
1791990 to 1999
102Before 1990
Facilities with environmental interests located in this zip code:
FITZMAURICE FERTILIZER (13163 SILVER FALLS HWY in SUBLIMITY, OR)
COMPLIANCE ACTIVITY (Tracking inspections of insecticide, fungicide, and rodenticide, and toxic substances)
Housing units lacking complete kitchen facilities: 5.1%
52.7%Utility gas
34.9%Electricity
9.4%Wood
1.6%No fuel used
1.2%Bottled, tank, or LP gas
Population in 1990: 2,881.
Place of birth for U.S.-born residents:
This state: 2,332
Northeast: 66
Midwest: 280
South: 162
West: 720
46% of the 97385 zip code residents lived in the same house 5 years ago. Out of people who lived in different houses, 67% lived in this county. Out of people who lived in different counties, 50% lived in Oregon.
91% of the 97385 zip code residents lived in the same house 1 year ago. Out of people who lived in different houses, 62% moved from this county. Out of people who lived in different houses, 25% moved from different county within same state. Out of people who lived in different houses, 14% moved from different state.
Private vs. public school enrollment:
Students in private schools in grades 1 to 8 (elementary and middle school): 47
Here:
13.9%
Oregon:
13.7%
Students in private schools in grades 9 to 12 (high school): 13
Here:
5.9%
Oregon:
8.8%
Students in private undergraduate colleges: 21
Here:
29.1%
Oregon:
17.7%
Occupation by median earnings in the past 12 months ($)
100,831Computer and mathematical occupations
93,836Law enforcement workers including supervisors
89,233Health diagnosing and treating practitioners and other technical occupations
86,285Management occupations
67,580Education, training, and library occupations
66,736Construction and extraction occupations
Companies with federal contracts located in this zip code:
CRUISE MASTER PRISMS INC (4790 DRIFT CREEK RD SE in SUBLIMITY, OR; small business)
$2,857 with Navy for Fire Fighting Equipment. Signed on 2005-02-22. Completion date: 2005-03-25.
Top industries in this zip code by the number of employees in 2005:
Health Care and Social Assistance: Nursing Care Facilities (100-249 employees: 1 establishment)
Finance and Insurance: Direct Property and Casualty Insurance Carriers (20-49: 1)
Construction: Flooring Contractors (20-49: 1)
Health Care and Social Assistance: Homes for the Elderly (20-49: 1)
Accommodation and Food Services: Drinking Places (Alcoholic Beverages) (20-49: 1)
Accommodation and Food Services: Hotels (except Casino Hotels) and Motels (10-19: 1, 5-9: 1)
Accommodation and Food Services: Full-Service Restaurants (10-19: 1, 1-4: 1)
People in group quarters in 2010:
204 people in nursing facilities/skilled-nursing facilities
4 people in workers' group living quarters and job corps centers
People in group quarters in 2000:
315 people in nursing homes
2 people in other workers' dormitories
Fatal accident statistics in 2014:
Fatal accident count: 2
Vehicles involved in fatal accidents: 2
Fatal accidents caused by drunken drivers: 0
Fatalities: 2
Persons involved in fatal accidents: 2
Pedestrians involved in fatal accidents: 1
Home Mortgage Disclosure Act Aggregated Statistics For Year 2009 (Based on 4 partial tracts)
A) FHA, FSA/RHS & VA Home Purchase Loans
B) Conventional Home Purchase Loans
C) Refinancings
D) Home Improvement Loans
F) Non-occupant Loans on < 5 Family Dwellings (A B C & D)
G) Loans On Manufactured Home Dwelling (A B C & D)
Number
Average Value
Number
Average Value
Number
Average Value
Number
Average Value
Number
Average Value
Number
Average Value
LOANS ORIGINATED
21
$232,745
30
$199,210
146
$230,035
7
$173,659
10
$233,723
15
$138,211
APPLICATIONS APPROVED, NOT ACCEPTED
0
$0
3
$227,297
16
$271,916
0
$0
0
$0
2
$62,285
APPLICATIONS DENIED
5
$249,202
10
$215,000
63
$242,614
6
$55,820
2
$198,365
9
$103,947
APPLICATIONS WITHDRAWN
3
$295,800
3
$240,903
27
$264,244
1
$39,090
1
$279,250
1
$221,090
FILES CLOSED FOR INCOMPLETENESS
0
$0
2
$110,855
10
$206,052
0
$0
0
$0
3
$103,013
Aggregated Statistics For Year 2008 (Based on 4 partial tracts)
A) FHA, FSA/RHS & VA Home Purchase Loans
B) Conventional Home Purchase Loans
C) Refinancings
D) Home Improvement Loans
F) Non-occupant Loans on < 5 Family Dwellings (A B C & D)
G) Loans On Manufactured Home Dwelling (A B C & D)
Number
Average Value
Number
Average Value
Number
Average Value
Number
Average Value
Number
Average Value
Number
Average Value
LOANS ORIGINATED
5
$275,370
31
$252,259
87
$242,230
5
$81,510
7
$224,429
16
$167,141
APPLICATIONS APPROVED, NOT ACCEPTED
1
$185,630
6
$173,087
12
$232,933
2
$140,210
2
$148,985
2
$175,610
APPLICATIONS DENIED
2
$257,320
15
$314,263
47
$234,238
10
$141,010
1
$106,070
9
$153,880
APPLICATIONS WITHDRAWN
1
$226,010
7
$292,590
22
$245,812
3
$182,293
2
$233,140
5
$129,698
FILES CLOSED FOR INCOMPLETENESS
1
$137,690
2
$263,565
4
$269,982
1
$100,490
0
$0
1
$101,720
Aggregated Statistics For Year 2007 (Based on 4 partial tracts)
A) FHA, FSA/RHS & VA Home Purchase Loans
B) Conventional Home Purchase Loans
C) Refinancings
D) Home Improvement Loans
E) Loans on Dwellings For 5+ Families
F) Non-occupant Loans on < 5 Family Dwellings (A B C & D)
G) Loans On Manufactured Home Dwelling (A B C & D)
Number
Average Value
Number
Average Value
Number
Average Value
Number
Average Value
Number
Average Value
Number
Average Value
Number
Average Value
LOANS ORIGINATED
1
$238,490
77
$200,252
119
$212,813
12
$120,457
1
$2,990,950
13
$221,388
22
$123,213
APPLICATIONS APPROVED, NOT ACCEPTED
1
$324,930
11
$232,091
19
$206,572
1
$98,230
0
$0
0
$0
2
$159,730
APPLICATIONS DENIED
1
$254,300
21
$168,629
76
$225,433
11
$140,955
0
$0
7
$239,271
18
$86,767
APPLICATIONS WITHDRAWN
0
$0
8
$239,852
25
$222,633
2
$263,320
0
$0
1
$273,470
4
$177,592
FILES CLOSED FOR INCOMPLETENESS
0
$0
4
$275,735
12
$240,192
2
$140,880
0
$0
0
$0
2
$81,915
Aggregated Statistics For Year 2006 (Based on 4 partial tracts)
A) FHA, FSA/RHS & VA Home Purchase Loans
B) Conventional Home Purchase Loans
C) Refinancings
D) Home Improvement Loans
F) Non-occupant Loans on < 5 Family Dwellings (A B C & D)
G) Loans On Manufactured Home Dwelling (A B C & D)
Number
Average Value
Number
Average Value
Number
Average Value
Number
Average Value
Number
Average Value
Number
Average Value
LOANS ORIGINATED
3
$183,583
112
$180,092
99
$200,897
15
$121,189
20
$214,416
23
$113,617
APPLICATIONS APPROVED, NOT ACCEPTED
1
$110,680
19
$176,756
23
$170,947
4
$146,755
2
$205,820
4
$166,455
APPLICATIONS DENIED
1
$81,690
20
$187,846
53
$205,646
12
$87,981
6
$314,850
8
$158,349
APPLICATIONS WITHDRAWN
0
$0
11
$142,204
34
$188,550
2
$106,545
5
$75,894
3
$105,587
FILES CLOSED FOR INCOMPLETENESS
0
$0
1
$247,560
13
$242,638
0
$0
1
$207,520
0
$0
Aggregated Statistics For Year 2005 (Based on 4 partial tracts)
A) FHA, FSA/RHS & VA Home Purchase Loans
B) Conventional Home Purchase Loans
C) Refinancings
D) Home Improvement Loans
F) Non-occupant Loans on < 5 Family Dwellings (A B C & D)
G) Loans On Manufactured Home Dwelling (A B C & D)
Number
Average Value
Number
Average Value
Number
Average Value
Number
Average Value
Number
Average Value
Number
Average Value
LOANS ORIGINATED
2
$261,390
107
$161,905
104
$177,007
11
$100,998
11
$138,547
23
$110,576
APPLICATIONS APPROVED, NOT ACCEPTED
0
$0
20
$146,499
21
$144,690
3
$76,797
1
$208,900
8
$64,001
APPLICATIONS DENIED
2
$170,960
30
$159,664
71
$179,919
10
$83,864
3
$106,670
18
$136,416
APPLICATIONS WITHDRAWN
0
$0
12
$138,303
46
$168,932
8
$149,422
2
$146,255
6
$132,257
FILES CLOSED FOR INCOMPLETENESS
0
$0
1
$234,680
8
$191,259
0
$0
1
$163,380
1
$68,020
Aggregated Statistics For Year 2004 (Based on 4 partial tracts)
A) FHA, FSA/RHS & VA Home Purchase Loans
B) Conventional Home Purchase Loans
C) Refinancings
D) Home Improvement Loans
F) Non-occupant Loans on < 5 Family Dwellings (A B C & D)
G) Loans On Manufactured Home Dwelling (A B C & D)
Number
Average Value
Number
Average Value
Number
Average Value
Number
Average Value
Number
Average Value
Number
Average Value
LOANS ORIGINATED
7
$170,563
105
$151,036
100
$163,233
5
$125,402
13
$134,548
24
$118,403
APPLICATIONS APPROVED, NOT ACCEPTED
1
$87,620
18
$118,057
25
$182,931
2
$170,510
2
$91,690
4
$151,928
APPLICATIONS DENIED
0
$0
25
$132,417
51
$164,193
7
$98,960
4
$127,370
17
$124,659
APPLICATIONS WITHDRAWN
1
$193,690
13
$133,008
36
$155,940
4
$129,465
3
$152,003
5
$136,752
FILES CLOSED FOR INCOMPLETENESS
1
$87,620
7
$116,214
4
$217,260
0
$0
0
$0
0
$0
Aggregated Statistics For Year 2003 (Based on 4 partial tracts)
A) FHA, FSA/RHS & VA Home Purchase Loans
B) Conventional Home Purchase Loans
C) Refinancings
D) Home Improvement Loans
E) Loans on Dwellings For 5+ Families
F) Non-occupant Loans on < 5 Family Dwellings (A B C & D)
Number
Average Value
Number
Average Value
Number
Average Value
Number
Average Value
Number
Average Value
Number
Average Value
LOANS ORIGINATED
3
$131,980
83
$149,557
257
$144,256
8
$36,799
1
$1,719,470
8
$114,414
APPLICATIONS APPROVED, NOT ACCEPTED
1
$126,490
15
$130,191
44
$141,273
2
$18,445
0
$0
2
$155,905
APPLICATIONS DENIED
2
$101,080
20
$115,112
81
$147,421
8
$28,368
0
$0
8
$128,625
APPLICATIONS WITHDRAWN
0
$0
5
$200,888
48
$141,682
0
$0
0
$0
2
$116,290
FILES CLOSED FOR INCOMPLETENESS
1
$135,710
1
$296,420
7
$119,614
0
$0
0
$0
1
$40,850
Aggregated Statistics For Year 1999 (Based on 2 partial tracts)
A) FHA, FSA/RHS & VA Home Purchase Loans
B) Conventional Home Purchase Loans
C) Refinancings
D) Home Improvement Loans
E) Loans on Dwellings For 5+ Families
F) Non-occupant Loans on < 5 Family Dwellings (A B C & D)
Detailed PMIC statistics for the following Tracts:0105.01
, 0107.02
2002 - 2018 National Fire Incident Reporting System (NFIRS) incidents
Based on the data from the years 2002 - 2018 the average number of fires per year is 16. The highest number of reported fire incidents - 39 took place in 2003, and the least - 0 in 2011. The data has a declining trend.
When looking into fire subcategories, the most incidents belonged to: Outside Fires (49.5%), and Structure Fires (42.2%).
Fire incident types reported to NFIRS in Zip Code 97385


 Nearest zip codes: 97383, 97381, 97384, 97325, 97375, 97317.


 Based on the data from the years 2002 - 2018 the average number of fires per year is 16. The highest number of reported fire incidents - 39 took place in 2003, and the least - 0 in 2011. The data has a declining trend.
 When looking into fire subcategories, the most incidents belonged to: Outside Fires (49.5%), and Structure Fires (42.2%).