Estimated zip code population in 2022: 819 Zip code population in 2010: 928 Zip code population in 2000: 357
Houses and condos: 385 Renter-occupied apartments: 105
% of renters here:
35%
State:
37%
March 2022 cost of living index in zip code 97434: 91.2 (less than average, U.S. average is 100)
Land area: 107.0 sq. mi. Water area: 0.8 sq. mi.
Population density: 8 people per square mile
(very low).
OSM Map
General Map
Google Map
MSN Map
OSM Map
General Map
Google Map
MSN Map
OSM Map
General Map
Google Map
MSN Map
OSM Map
General Map
Google Map
MSN Map
Please wait while loading the map...
Real estate property taxes paid for housing units in 2022:
This zip code:
0.5% ($1,808)
Oregon:
0.8% ($3,646)
Median real estate property taxes paid for housing units with mortgages in 2022: $1,605 (0.4%) Median real estate property taxes paid for housing units with no mortgage in 2022: $1,891 (0.5%)
Business Search- 14 Million verified businesses
Males: 485
(59.3%)
Females: 333
(40.7%)
For population 25 years and over in 97434:
High school or higher: 83.0%
Bachelor's degree or higher: 28.0%
Graduate or professional degree: 6.5%
Unemployed: 12.0%
Mean travel time to work (commute): 44.3 minutes
For population 15 years and over in 97434:
Never married: 31.7%
Now married: 44.6%
Separated: 4.7%
Widowed: 2.3%
Divorced: 16.6%
Zip code 97434 compared to state average:
Median household income below state average.
Unemployed percentage above state average.
Black race population percentage significantly below state average.
Median age above state average.
Length of stay since moving in significantly above state average.
Number of college students significantly below state average.
Averages for the 2020 tax year for zip code 97434, filed in 2021:
Average Adjusted Gross Income (AGI) in 2020: $47,449 (Individual Income Tax Returns)
Here:
$47,449
State:
$76,001
Salary/wage: $44,808 (reported on 74.3% of returns)
Here:
$44,808
State:
$61,959
(% of AGI for various income ranges: 1290.0% for AGIs below $25k, 3475.7% for AGIs $25k-50k, 12132.5% for AGIs $50k-75k)
Taxable interest for individuals: $490 (reported on 28.6% of returns)
This zip code:
$490
Oregon:
$1,628
(% of AGI for various income ranges: 27.5% for AGIs below $25k, 15.7% for AGIs $25k-50k, 12.5% for AGIs $50k-75k, 55.0% for AGIs $75k-100k)
Ordinary dividends: $1,100 (reported on 17.1% of returns)
Here:
$1,100
State:
$7,165
(% of AGI for various income ranges: 47.5% for AGIs below $25k, 70.0% for AGIs $50k-75k)
Net capital gain/loss in AGI: +$1,100 (reported on 11.4% of returns)
Here:
+$1,100
State:
+$23,403
(% of AGI for various income ranges: 62.9% for AGIs $25k-50k)
Profit/loss from business: +$14,225 (reported on 11.4% of returns)
Here:
+$14,225
State:
+$16,511
(% of AGI for various income ranges: 812.9% for AGIs $25k-50k)
Taxable individual retirement arrangement distribution: $6,625 (reported on 11.4% of returns)
97434:
$6,625
Oregon:
$20,730
(% of AGI for various income ranges: 378.6% for AGIs $25k-50k)
Earned income credit: $2,500 (reported on 17.1% of returns)
Here:
$2,500
State:
$1,977
(% of AGI for various income ranges: 105.0% for AGIs below $25k, 94.3% for AGIs $25k-50k)
Percentage of individuals using paid preparers for their 2020 taxes: 91.4%
Here:
91%
State:
93%
(% for various income ranges: 91.7% for AGIs below $25k, 88.9% for AGIs $25k-50k, 85.7% for AGIs $50k-75k, 100.0% for AGIs $75k-100k, 100.0% for AGIs $100k-200k)
Averages for the 2012 tax year for zip code 97434, filed in 2013:
Average Adjusted Gross Income (AGI) in 2012: $37,969 (Individual Income Tax Returns)
Here:
$37,969
State:
$57,845
Salary/wage: $34,936 (reported on 75.9% of returns)
Here:
$34,936
State:
$47,723
(% of AGI for various income ranges: 46.9% for AGIs below $25k, 72.5% for AGIs $25k-50k, 72.8% for AGIs $50k-75k, 75.5% for AGIs $75k-100k)
Taxable interest for individuals: $725 (reported on 27.6% of returns)
This zip code:
$725
Oregon:
$1,848
(% of AGI for various income ranges: 3.3% for AGIs below $25k, 0.2% for AGIs $50k-75k)
Ordinary dividends: $733 (reported on 10.3% of returns)
Here:
$733
State:
$5,987
Profit/loss from business: +$8,367 (reported on 10.3% of returns)
Here:
+$8,367
State:
+$13,871
Taxable individual retirement arrangement distribution: $10,725 (reported on 13.8% of returns)
97434:
$10,725
Oregon:
$16,036
Total itemized deductions: $17,656 (31% of AGI, reported on 31.0% of returns)
Here:
$17,656
State:
$24,430
Here:
30.6% of AGI
State:
23.2% of AGI
(% of AGI for various income ranges: 19.9% for AGIs $25k-50k, 12.8% for AGIs $50k-75k, 17.7% for AGIs $75k-100k)
Charity contributions: $1,433 (reported on 20.7% of returns)
Here:
$1,433
State:
$3,648
(% of AGI for various income ranges: 1.7% for AGIs $25k-50k, 1.0% for AGIs $75k-100k)
Taxes paid: $4,767 (reported on 31.0% of returns)
97434:
$4,767
State:
$10,269
(% of AGI for various income ranges: 3.8% for AGIs $25k-50k, 3.5% for AGIs $50k-75k, 5.9% for AGIs $75k-100k)
Earned income credit: $2,317 (reported on 20.7% of returns)
Here:
$2,317
State:
$2,021
(% of AGI for various income ranges: 8.5% for AGIs below $25k)
Percentage of individuals using paid preparers for their 2012 taxes: 48.3%
Here:
48%
State:
47%
(% for various income ranges: 46.2% for AGIs below $25k, 50.0% for AGIs $25k-50k, 100.0% for AGIs $50k-75k)
Averages for the 2004 tax year for zip code 97434, filed in 2005:
Average Adjusted Gross Income (AGI) in 2004: $33,272 (Individual Income Tax Returns)
Here:
$33,272
State:
$46,788
Salary/wage: $30,600 (reported on 81.5% of returns)
Here:
$30,600
State:
$39,788
(% of AGI for various income ranges: 74.4% for AGIs below $10k, 72.7% for AGIs $10k-25k, 87.9% for AGIs $25k-50k, 111.3% for AGIs $50k-75k)
Taxable interest for individuals: $338 (reported on 35.3% of returns)
This zip code:
$338
Oregon:
$2,126
(% of AGI for various income ranges: 0.6% for AGIs below $10k, 1.3% for AGIs $10k-25k, 0.1% for AGIs $25k-50k, 0.4% for AGIs $50k-75k)
Taxable dividends: $304 (reported on 12.5% of returns)
Here:
$304
State:
$3,427
Net capital gain/loss: +$538 (reported on 7.1% of returns)
Here:
+$538
State:
+$12,447
Profit/loss from business: +$1,778 (reported on 9.8% of returns)
Here:
+$1,778
State:
+$11,682
Total itemized deductions: $15,417 (31% of AGI, reported on 26.1% of returns)
Here:
$15,417
State:
$20,209
Here:
30.5% of AGI
State:
24.7% of AGI
Charity contributions deductions: $1,147 (2% of AGI, reported on 18.5% of returns)
Here:
$1,147
State:
$3,145
Here:
2.0% of AGI
State:
3.6% of AGI
Total tax: $3,453 (reported on 69.6% of returns)
97434:
$3,453
State:
$7,148
Earned income credit: $1,500 (reported on 16.3% of returns)
Here:
$1,500
State:
$1,605
Percentage of individuals using paid preparers for their 2004 taxes: 52.7%
Here:
53%
State:
53%
(% for various income ranges: 54.1% for AGIs below $10k, 52.0% for AGIs $10k-25k, 43.9% for AGIs $25k-50k, 86.7% for AGIs $50k-75k)
Household received Food Stamps/SNAP in the past 12 months: 45 Household did not receive Food Stamps/SNAP in the past 12 months: 258
Women who had a birth in the past 12 months: 10 (8 now married, 1 unmarried) Women who did not have a birth in the past 12 months: 151 (67 now married, 83 unmarried)
Housing units in zip code 97434 with a mortgage: 97 (7 second mortgage) Median monthly owner costs for units with a mortgage: $1,893 Median monthly owner costs for units without a mortgage: $488
Residents with income below the poverty level in 2022:
This zip code:
32.0%
Whole state:
12.1%
Residents with income below 50% of the poverty level in 2022:
This zip code:
19.1%
Whole state:
6.2%
Median number of rooms in houses and condos:
Here:
6.1
State:
6.2
Median number of rooms in apartments:
Here:
5.2
State:
4.0
Notable locations in this zip code not listed on our city pages
Notable locations in zip code 97434: Laying Creek Water Treatment Plant (A), Crawfish Shelter (B), Fairview Camp (C), Cedar Creek Recreation Site (D), Musick Guard Station (E), Baker Bay Park Boat Ramp (F). Display/hide their locations on the map
Streams, rivers, and creeks: Spring Brook (A), Jumbo Creek (B), Hunt Creek (C), Day Creek (D), Grizzly Creek (E), Hawley Creek (F), Golden Curry Creek (G), Nelson Creek (H), Damewood Creek (I). Display/hide their locations on the map
Parks in zip code 97434 include: Lasells D Stewart County Park (1), Sharps Creek Wayside (2), Wildwood Falls County Park (3), Vaughn County Park (4). Display/hide their locations on the map
In group quarters: 5 (-1 institutionalized population)
Size of family households: 36 2-persons, 14 3-persons, 33 4-persons, 61 5-persons, 8 7-or-more-persons
Size of nonfamily households: 136 1-person, 11 2-persons
77 married couples with children.
0 single-parent households ().
95.4% of residents of 97434 zip code speak English at home.
4.3% of residents speak Asian or Pacific Island language at home (26% very well, 74% not well).
Foreign born population: 57 (7.0%) (76.4% of them are naturalized citizens)
This zip code:
7.0%
Whole state:
9.9%
90%Philippines
34%Japan
17%American
11%English
11%German
10%European
Year of entry for the foreign-born population
152010 or later
02000 to 2009
01990 to 1999
41Before 1990
Facilities with environmental interests located in this zip code:
DORENA ELEM. SCHOOL (37141 ROW RIVER RD in DORENA, OR)
(National Center for Education Statistics) - STATE ID-574 Organizations: SOUTH LANE SCH DIST 45J (SCHOOL DISTRICT)
BOHEMIA INC DORENA (37585 ROW RIVER RD in DORENA, OR)
COMPLIANCE ACTIVITY (Tracking inspections of insecticide, fungicide, and rodenticide, and toxic substances) Alternative names: WILLAMETTE INDUSTRIES/DORENA
Housing units lacking complete plumbing facilities: 2.7% Housing units lacking complete kitchen facilities: 3.0%
48.8%Electricity
37.2%Wood
10.2%Bottled, tank, or LP gas
4.8%Utility gas
Population in 1990: 225. Population change in the 1990s: +132 (+58.7%).
Place of birth for U.S.-born residents:
This state: 416
Midwest: 36
South: 58
West: 250
80% of the 97434 zip code residents lived in the same house 5 years ago. Out of people who lived in different houses, 100% lived in this county.
74% of the 97434 zip code residents lived in the same house 1 year ago. Out of people who lived in different houses, 52% moved from this county. Out of people who lived in different houses, 22% moved from different county within same state. Out of people who lived in different houses, 22% moved from different state.
Private vs. public school enrollment:
Students in private schools in grades 1 to 8 (elementary and middle school): 11
Here:
21.2%
Oregon:
13.7%
Students in private schools in grades 9 to 12 (high school):
Here:
0.0%
Oregon:
8.8%
Students in private undergraduate colleges: 8
Here:
82.8%
Oregon:
17.7%
Occupation by median earnings in the past 12 months ($)
53,206Office and administrative support occupations
51,770Sales and related occupations
43,992Management occupations
Top industries in this zip code by the number of employees in 2005:
Finance and Insurance: Insurance Agencies and Brokerages (5-9 employees: 1 establishment)
Construction: Electrical Contractors (1-4: 1)
Other Services (except Public Administration): Religious Organizations (1-4: 1)
Administrative and Support and Waste Management and Remediation Services: Landscaping Services (1-4: 1)
Construction: Painting and Wall Covering Contractors (1-4: 1)
People in group quarters in 2010:
5 people in group homes intended for adults
Fatal accident statistics in 2014:
Fatal accident count: 1
Vehicles involved in fatal accidents: 2
Fatal accidents caused by drunken drivers: 0
Fatalities: 1
Persons involved in fatal accidents: 2
Pedestrians involved in fatal accidents: 1
Fatal accident statistics in 2011:
Fatal accident count: 1
Vehicles involved in fatal accidents: 2
Fatal accidents caused by drunken drivers: 0
Fatalities: 1
Persons involved in fatal accidents: 2
Pedestrians involved in fatal accidents: 0
Home Mortgage Disclosure Act Aggregated Statistics For Year 2009 (Based on 2 partial tracts)
C) Refinancings
G) Loans On Manufactured Home Dwelling (A B C & D)
Number
Average Value
Number
Average Value
LOANS ORIGINATED
4
$183,905
1
$182,670
APPLICATIONS APPROVED, NOT ACCEPTED
0
$0
0
$0
APPLICATIONS DENIED
2
$146,265
0
$0
APPLICATIONS WITHDRAWN
1
$112,800
0
$0
FILES CLOSED FOR INCOMPLETENESS
0
$0
0
$0
Aggregated Statistics For Year 2008 (Based on 2 partial tracts)
B) Conventional Home Purchase Loans
C) Refinancings
G) Loans On Manufactured Home Dwelling (A B C & D)
Number
Average Value
Number
Average Value
Number
Average Value
LOANS ORIGINATED
1
$180,080
3
$277,270
1
$343,700
APPLICATIONS APPROVED, NOT ACCEPTED
0
$0
1
$112,870
0
$0
APPLICATIONS DENIED
0
$0
2
$235,470
0
$0
APPLICATIONS WITHDRAWN
0
$0
1
$187,340
0
$0
FILES CLOSED FOR INCOMPLETENESS
0
$0
0
$0
0
$0
Aggregated Statistics For Year 2007 (Based on 2 partial tracts)
B) Conventional Home Purchase Loans
C) Refinancings
D) Home Improvement Loans
G) Loans On Manufactured Home Dwelling (A B C & D)
Number
Average Value
Number
Average Value
Number
Average Value
Number
Average Value
LOANS ORIGINATED
1
$307,610
3
$194,903
1
$44,530
1
$110,280
APPLICATIONS APPROVED, NOT ACCEPTED
0
$0
1
$96,390
0
$0
0
$0
APPLICATIONS DENIED
1
$167,240
2
$140,440
1
$44,250
1
$140,720
APPLICATIONS WITHDRAWN
0
$0
1
$277,940
0
$0
0
$0
FILES CLOSED FOR INCOMPLETENESS
0
$0
0
$0
0
$0
0
$0
Aggregated Statistics For Year 2006 (Based on 2 partial tracts)
B) Conventional Home Purchase Loans
C) Refinancings
D) Home Improvement Loans
F) Non-occupant Loans on < 5 Family Dwellings (A B C & D)
G) Loans On Manufactured Home Dwelling (A B C & D)
Number
Average Value
Number
Average Value
Number
Average Value
Number
Average Value
Number
Average Value
LOANS ORIGINATED
3
$138,297
3
$168,333
0
$0
1
$113,080
1
$147,070
APPLICATIONS APPROVED, NOT ACCEPTED
1
$129,480
0
$0
0
$0
0
$0
0
$0
APPLICATIONS DENIED
1
$142,670
2
$178,515
1
$34,970
0
$0
1
$122,780
APPLICATIONS WITHDRAWN
0
$0
2
$112,415
0
$0
0
$0
0
$0
FILES CLOSED FOR INCOMPLETENESS
0
$0
0
$0
0
$0
0
$0
0
$0
Aggregated Statistics For Year 2005 (Based on 2 partial tracts)
A) FHA, FSA/RHS & VA Home Purchase Loans
B) Conventional Home Purchase Loans
C) Refinancings
D) Home Improvement Loans
G) Loans On Manufactured Home Dwelling (A B C & D)
Number
Average Value
Number
Average Value
Number
Average Value
Number
Average Value
Number
Average Value
LOANS ORIGINATED
1
$97,720
3
$90,250
4
$173,715
0
$0
1
$187,340
APPLICATIONS APPROVED, NOT ACCEPTED
0
$0
1
$86,760
1
$145,670
0
$0
0
$0
APPLICATIONS DENIED
0
$0
2
$105,710
3
$174,220
1
$88,510
1
$121,800
APPLICATIONS WITHDRAWN
0
$0
1
$111,260
2
$128,325
0
$0
0
$0
FILES CLOSED FOR INCOMPLETENESS
0
$0
0
$0
1
$86,690
0
$0
0
$0
Aggregated Statistics For Year 2004 (Based on 2 partial tracts)
B) Conventional Home Purchase Loans
C) Refinancings
G) Loans On Manufactured Home Dwelling (A B C & D)
Number
Average Value
Number
Average Value
Number
Average Value
LOANS ORIGINATED
2
$106,760
4
$129,880
1
$79,010
APPLICATIONS APPROVED, NOT ACCEPTED
0
$0
1
$152,650
0
$0
APPLICATIONS DENIED
1
$35,740
3
$147,977
1
$121,520
APPLICATIONS WITHDRAWN
0
$0
1
$181,620
0
$0
FILES CLOSED FOR INCOMPLETENESS
0
$0
0
$0
0
$0
Aggregated Statistics For Year 2003 (Based on 2 partial tracts)
B) Conventional Home Purchase Loans
C) Refinancings
F) Non-occupant Loans on < 5 Family Dwellings (A B C & D)
Number
Average Value
Number
Average Value
Number
Average Value
LOANS ORIGINATED
2
$147,210
8
$141,441
1
$72,030
APPLICATIONS APPROVED, NOT ACCEPTED
0
$0
1
$132,060
0
$0
APPLICATIONS DENIED
1
$80,130
4
$124,925
0
$0
APPLICATIONS WITHDRAWN
1
$112,520
2
$126,025
0
$0
FILES CLOSED FOR INCOMPLETENESS
0
$0
0
$0
0
$0
Aggregated Statistics For Year 1999 (Based on 1 partial tract)

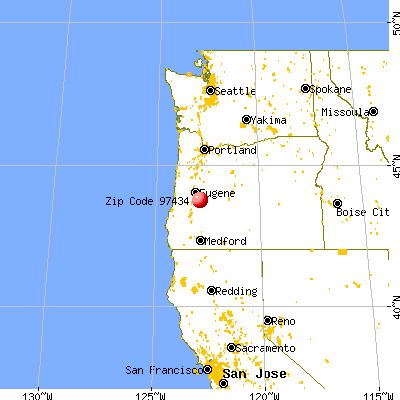


 Nearest zip codes: 97492, 97452, 97431, 97424, 97438, 97463.


