Estimated zip code population in 2022: 586 Zip code population in 2010: 658 Zip code population in 2000: 641
Houses and condos: 250 Renter-occupied apartments: 42
% of renters here:
19%
State:
37%
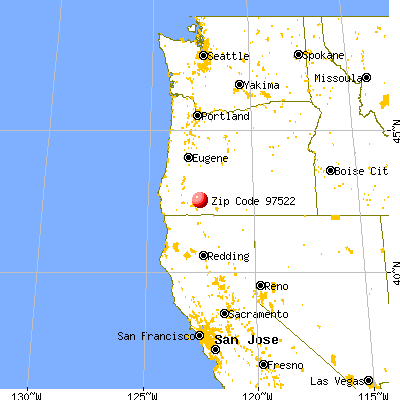
March 2022 cost of living index in zip code 97522: 88.6 (less than average, U.S. average is 100)
Land area: 90.6 sq. mi. Water area: 0.2 sq. mi.
Population density: 6 people per square mile
(very low).
OSM Map
General Map
Google Map
MSN Map
OSM Map
General Map
Google Map
MSN Map
OSM Map
General Map
Google Map
MSN Map
OSM Map
General Map
Google Map
MSN Map
Please wait while loading the map...
Real estate property taxes paid for housing units in 2022:
This zip code:
0.7% ($1,649)
Oregon:
0.8% ($3,646)
Median real estate property taxes paid for housing units with mortgages in 2022: $1,611 (0.6%) Median real estate property taxes paid for housing units with no mortgage in 2022: $1,808 (0.9%)
Business Search- 14 Million verified businesses
Males: 342
(58.4%)
Females: 244
(41.6%)
For population 25 years and over in 97522:
High school or higher: 93.8%
Bachelor's degree or higher: 8.1%
Graduate or professional degree: 0.0%
Unemployed: 5.4%
Mean travel time to work (commute): 33.0 minutes
For population 15 years and over in 97522:
Never married: 26.1%
Now married: 47.5%
Separated: 3.8%
Widowed: 8.4%
Divorced: 14.2%
Zip code 97522 compared to state average:
Median house value below state average.
Black race population percentage significantly below state average.
Hispanic race population percentage significantly below state average.
Foreign-born population percentage significantly below state average.
Renting percentage below state average.
Length of stay since moving in significantly above state average.
Number of college students below state average.
Percentage of population with a bachelor's degree or higher significantly below state average.
Averages for the 2020 tax year for zip code 97522, filed in 2021:
Average Adjusted Gross Income (AGI) in 2020: $45,915 (Individual Income Tax Returns)
Here:
$45,915
State:
$76,001
Salary/wage: $38,281 (reported on 77.8% of returns)
Here:
$38,281
State:
$61,959
(% of AGI for various income ranges: 1211.4% for AGIs below $25k, 3540.0% for AGIs $25k-50k, 4515.0% for AGIs $50k-75k)
Taxable interest for individuals: $733 (reported on 33.3% of returns)
This zip code:
$733
Oregon:
$1,628
(% of AGI for various income ranges: 37.1% for AGIs below $25k, 13.3% for AGIs $50k-75k)
Ordinary dividends: $1,800 (reported on 11.1% of returns)
Here:
$1,800
State:
$7,165
(% of AGI for various income ranges: 108.0% for AGIs $25k-50k)
Net capital gain/loss in AGI: +$18,667 (reported on 11.1% of returns)
Here:
+$18,667
State:
+$23,403
(% of AGI for various income ranges: 933.3% for AGIs $50k-75k)
Profit/loss from business: +$2,600 (reported on 11.1% of returns)
Here:
+$2,600
State:
+$16,511
(% of AGI for various income ranges: 156.0% for AGIs $25k-50k)
Taxable individual retirement arrangement distribution: $9,350 (reported on 7.4% of returns)
97522:
$9,350
Oregon:
$20,730
(% of AGI for various income ranges: 267.1% for AGIs below $25k)
Earned income credit: $2,060 (reported on 18.5% of returns)
Here:
$2,060
State:
$1,977
(% of AGI for various income ranges: 147.1% for AGIs below $25k)
Percentage of individuals using paid preparers for their 2020 taxes: 96.3%
Here:
96%
State:
93%
(% for various income ranges: 100.0% for AGIs below $25k, 100.0% for AGIs $25k-50k, 100.0% for AGIs $50k-75k, 66.7% for AGIs $75k-100k, 100.0% for AGIs $100k-200k)
Averages for the 2012 tax year for zip code 97522, filed in 2013:
Average Adjusted Gross Income (AGI) in 2012: $33,630 (Individual Income Tax Returns)
Here:
$33,630
State:
$57,845
Salary/wage: $27,379 (reported on 70.4% of returns)
Here:
$27,379
State:
$47,723
(% of AGI for various income ranges: 63.9% for AGIs below $25k, 57.9% for AGIs $25k-50k, 135.7% for AGIs $50k-75k)
Taxable interest for individuals: $971 (reported on 25.9% of returns)
This zip code:
$971
Oregon:
$1,848
Ordinary dividends: $3,000 (reported on 11.1% of returns)
Here:
$3,000
State:
$5,987
Profit/loss from business: +$967 (reported on 11.1% of returns)
Here:
+$967
State:
+$13,871
Taxable individual retirement arrangement distribution: $6,867 (reported on 11.1% of returns)
97522:
$6,867
Oregon:
$16,036
Total itemized deductions: $18,829 (32% of AGI, reported on 25.9% of returns)
Here:
$18,829
State:
$24,430
Here:
32.0% of AGI
State:
23.2% of AGI
Charity contributions: $2,575 (reported on 14.8% of returns)
Here:
$2,575
State:
$3,648
Taxes paid: $4,429 (reported on 25.9% of returns)
97522:
$4,429
State:
$10,269
Earned income credit: $2,329 (reported on 25.9% of returns)
Here:
$2,329
State:
$2,021
(% of AGI for various income ranges: 9.6% for AGIs below $25k)
Percentage of individuals using paid preparers for their 2012 taxes: 51.9%
Here:
52%
State:
47%
(% for various income ranges: 42.9% for AGIs below $25k, 57.1% for AGIs $25k-50k, 133.3% for AGIs $50k-75k)
Averages for the 2004 tax year for zip code 97522, filed in 2005:
Average Adjusted Gross Income (AGI) in 2004: $31,134 (Individual Income Tax Returns)
Here:
$31,134
State:
$46,788
Salary/wage: $25,979 (reported on 78.4% of returns)
Here:
$25,979
State:
$39,788
(% of AGI for various income ranges: 80.6% for AGIs below $10k, 74.1% for AGIs $10k-25k, 77.1% for AGIs $25k-50k, 94.5% for AGIs $50k-75k)
Taxable interest for individuals: $1,255 (reported on 30.8% of returns)
This zip code:
$1,255
Oregon:
$2,126
(% of AGI for various income ranges: 6.0% for AGIs below $10k, 0.7% for AGIs $10k-25k, 1.6% for AGIs $25k-50k, 0.0% for AGIs $50k-75k, 1.8% for AGIs $75k-100k)
Taxable dividends: $1,000 (reported on 13.8% of returns)
Here:
$1,000
State:
$3,427
Net capital gain/loss: +$1,896 (reported on 15.7% of returns)
Here:
+$1,896
State:
+$12,447
Profit/loss from business: +$1,029 (reported on 11.5% of returns)
Here:
+$1,029
State:
+$11,682
Total itemized deductions: $15,115 (29% of AGI, reported on 31.5% of returns)
Here:
$15,115
State:
$20,209
Here:
29.0% of AGI
State:
24.7% of AGI
(% of AGI for various income ranges: 12.4% for AGIs $10k-25k, 13.7% for AGIs $25k-50k, 18.7% for AGIs $50k-75k, 18.3% for AGIs $75k-100k)
Charity contributions deductions: $1,807 (3% of AGI, reported on 18.7% of returns)
Here:
$1,807
State:
$3,145
Here:
3.4% of AGI
State:
3.6% of AGI
Total tax: $3,195 (reported on 67.2% of returns)
97522:
$3,195
State:
$7,148
(% of AGI for various income ranges: 4.9% for AGIs below $10k, 3.0% for AGIs $10k-25k, 4.8% for AGIs $25k-50k, 8.4% for AGIs $50k-75k, 12.1% for AGIs $75k-100k)
Earned income credit: $1,907 (reported on 24.6% of returns)
Here:
$1,907
State:
$1,605
Percentage of individuals using paid preparers for their 2004 taxes: 49.8%
Here:
50%
State:
53%
(% for various income ranges: 41.9% for AGIs below $10k, 34.9% for AGIs $10k-25k, 58.4% for AGIs $25k-50k, 64.1% for AGIs $50k-75k, 70.6% for AGIs $75k-100k)
Household received Food Stamps/SNAP in the past 12 months: 43 Household did not receive Food Stamps/SNAP in the past 12 months: 185
Women who did not have a birth in the past 12 months: 98 (70 now married, 25 unmarried)
Housing units in zip code 97522 with a mortgage: 113 (15 second mortgage, 16 both second mortgage and home equity loan) Median monthly owner costs for units with a mortgage: $1,238 Median monthly owner costs for units without a mortgage: $560
Residents with income below the poverty level in 2022:
This zip code:
12.6%
Whole state:
12.1%
Residents with income below 50% of the poverty level in 2022:
This zip code:
4.6%
Whole state:
6.2%
Median number of rooms in houses and condos:
Here:
5.2
State:
6.2
Median number of rooms in apartments:
Here:
4.7
State:
4.0
Notable locations in this zip code not listed on our city pages
Notable locations in zip code 97522: Hoffman Ranch (A), Pennington Ranch (B), Butte Falls State Forest Station (C), Camp Four (D), Perry School (E), Mill-Mar Ranch (F), Rancheria Ranch (G), Mount Pitt School (H), Butte Falls Sewage Treatment Plant (I), Thomson Ranch (J), Bill Edmonson Memorial Museum (K), Butte Falls Volunteer Fire Department (L), Butte Falls Ranger Station (M), Butte Falls Branch Library (N), Butte Falls City Hall (O), Butte Falls Historical Society and Railway Museum Caboose (P), Butte Falls Municipal Court (Q). Display/hide their locations on the map
Creeks: Indian Creek (A), Hukill Creek (B), Horse Creek (C), Richard Creek (D), Ginger Creek (E), Fourbit Creek (F), Eighty Acre Creek (G), Doubleday Creek (H), North Fork Big Butte Creek (I). Display/hide their locations on the map
In group quarters: 3 (-1 institutionalized population)
Size of family households: 72 2-persons, 15 3-persons, 15 4-persons, 11 5-persons, 9 6-persons, 8 7-or-more-persons
Size of nonfamily households: 74 1-person, 18 2-persons, 1 3-persons
112 married couples with children.
14 single-parent households (8 men, 6 women).
99.8% of residents of 97522 zip code speak English at home.
0.2% of residents speak Spanish at home (100% not at all).
Foreign born population: 24 (4.2%) (4.0% of them are naturalized citizens)
This zip code:
4.2%
Whole state:
9.9%
4%France
4%Honduras
25%English
18%American
12%German
7%Northern European
7%Irish
5%Norwegian
5%Polish
Year of entry for the foreign-born population
292010 or later
12000 to 2009
01990 to 1999
0Before 1990
Facilities with environmental interests located in this zip code:
BUTTE FALLS TOWN OF (FALLS ROAD in BUTTE FALLS, OR)
STATE MASTER (Oregon inspections and permits database) - OR-SIS-12800-100266, NPDES NON-MAJOR, OR-SIS-12800-100852, OR-SIS-12800-101552, OR-SIS-12800-3394, National Pollutant Discharge Elimination System NON-MAJOR (Tracking pollutant discharge elimination systems) - permit COMMUNITY WATER SYSTEM (SDWIS) - SDWIS-OR4100154 63, WATER TREATMENT PLANT Business SIC classification: SEWERAGE SYSTEMS Organizations: TOWN OF BUTTE FALLS (CONTACT/OWNER)
, BUTTE FALLS, TOWN OF (CONTACT/OWNER)
Alternative names: TOWN OF BUTTE FALLS
BUTTE FALLS ELEM. SCHOOL (239 MAIN ST in BUTTE FALLS, OR)
(National Center for Education Statistics) - STATE ID-405 Organizations: BUTTE FALLS SCH DIST 091 (SCHOOL DISTRICT)
BUTTE FALLS HIGH SCHOOL (625 FIR ST in BUTTE FALLS, OR)
(National Center for Education Statistics) - STATE ID-406 Organizations: BUTTE FALLS SCH DIST 091 (SCHOOL DISTRICT)
BUTTE FALLS SD 91 (239 MAIN ST in BUTTE FALLS, OR)
COMPLIANCE ACTIVITY (Tracking inspections of insecticide, fungicide, and rodenticide, and toxic substances)
Housing units lacking complete kitchen facilities: 2.8%
41.8%Wood
39.1%Electricity
10.5%Fuel oil, kerosene, etc.
7.3%Bottled, tank, or LP gas
2.3%Utility gas
Population in 1990: 1,115.
Place of birth for U.S.-born residents:
This state: 326
Northeast: 9
Midwest: 35
South: 3
West: 183
45% of the 97522 zip code residents lived in the same house 5 years ago. Out of people who lived in different houses, 70% lived in this county. Out of people who lived in different counties, 50% lived in Oregon.
95% of the 97522 zip code residents lived in the same house 1 year ago. Out of people who lived in different houses, 95% moved from this county. Out of people who lived in different houses, 5% moved from different state.
Private vs. public school enrollment:
Students in private schools in grades 1 to 8 (elementary and middle school): 2
Here:
4.4%
Oregon:
13.7%
Students in private schools in grades 9 to 12 (high school):
Here:
0.0%
Oregon:
8.8%
Students in private undergraduate colleges:
Here:
0.0%
Oregon:
17.7%
Occupation by median earnings in the past 12 months ($)
54,990Management occupations
30,403Office and administrative support occupations
28,276Sales and related occupations
27,449Material moving occupations
18,452Education, training, and library occupations
17,160Food preparation and serving related occupations
Top industries in this zip code by the number of employees in 2005:
Construction: Highway, Street, and Bridge Construction (5-9 employees: 1 establishment)
Accommodation and Food Services: Drinking Places (Alcoholic Beverages) (1-4: 2)
Arts, Entertainment, and Recreation: Museums (1-4: 1)
Administrative and Support and Waste Management and Remediation Services: All Other Support Services (1-4: 1)
Accommodation and Food Services: Recreational and Vacation Camps (except Campgrounds) (1-4: 1)
Other Services (except Public Administration): Religious Organizations (1-4: 1)
Accommodation and Food Services: Limited-Service Restaurants (1-4: 1)
Home Mortgage Disclosure Act Aggregated Statistics For Year 2009 (Based on 2 partial tracts)
A) FHA, FSA/RHS & VA Home Purchase Loans
B) Conventional Home Purchase Loans
C) Refinancings
D) Home Improvement Loans
G) Loans On Manufactured Home Dwelling (A B C & D)
Number
Average Value
Number
Average Value
Number
Average Value
Number
Average Value
Number
Average Value
LOANS ORIGINATED
1
$107,840
1
$112,270
5
$208,806
1
$39,740
1
$149,790
APPLICATIONS APPROVED, NOT ACCEPTED
0
$0
0
$0
1
$203,110
0
$0
0
$0
APPLICATIONS DENIED
0
$0
1
$86,110
5
$224,780
1
$73,840
1
$49,900
APPLICATIONS WITHDRAWN
0
$0
0
$0
1
$177,360
0
$0
0
$0
FILES CLOSED FOR INCOMPLETENESS
0
$0
0
$0
0
$0
0
$0
0
$0
Aggregated Statistics For Year 2008 (Based on 2 partial tracts)
B) Conventional Home Purchase Loans
C) Refinancings
D) Home Improvement Loans
F) Non-occupant Loans on < 5 Family Dwellings (A B C & D)
G) Loans On Manufactured Home Dwelling (A B C & D)
Number
Average Value
Number
Average Value
Number
Average Value
Number
Average Value
Number
Average Value
LOANS ORIGINATED
0
$0
3
$219,980
0
$0
0
$0
1
$101,000
APPLICATIONS APPROVED, NOT ACCEPTED
0
$0
1
$282,380
0
$0
0
$0
1
$99,900
APPLICATIONS DENIED
1
$120,020
3
$142,013
1
$86,520
1
$100,500
2
$104,070
APPLICATIONS WITHDRAWN
0
$0
1
$187,520
0
$0
0
$0
0
$0
FILES CLOSED FOR INCOMPLETENESS
0
$0
0
$0
0
$0
0
$0
0
$0
Aggregated Statistics For Year 2007 (Based on 2 partial tracts)
B) Conventional Home Purchase Loans
C) Refinancings
D) Home Improvement Loans
F) Non-occupant Loans on < 5 Family Dwellings (A B C & D)
G) Loans On Manufactured Home Dwelling (A B C & D)
Number
Average Value
Number
Average Value
Number
Average Value
Number
Average Value
Number
Average Value
LOANS ORIGINATED
2
$157,490
5
$215,606
1
$62,070
1
$213,670
2
$140,440
APPLICATIONS APPROVED, NOT ACCEPTED
0
$0
1
$240,130
0
$0
0
$0
0
$0
APPLICATIONS DENIED
1
$133,800
5
$175,930
1
$52,710
1
$132,590
1
$200,500
APPLICATIONS WITHDRAWN
0
$0
2
$291,940
0
$0
0
$0
0
$0
FILES CLOSED FOR INCOMPLETENESS
0
$0
1
$208,140
0
$0
0
$0
0
$0
Aggregated Statistics For Year 2006 (Based on 2 partial tracts)
B) Conventional Home Purchase Loans
C) Refinancings
D) Home Improvement Loans
F) Non-occupant Loans on < 5 Family Dwellings (A B C & D)
G) Loans On Manufactured Home Dwelling (A B C & D)
Number
Average Value
Number
Average Value
Number
Average Value
Number
Average Value
Number
Average Value
LOANS ORIGINATED
3
$195,833
7
$176,697
1
$44,360
1
$222,630
2
$141,795
APPLICATIONS APPROVED, NOT ACCEPTED
1
$151,000
1
$257,330
0
$0
0
$0
0
$0
APPLICATIONS DENIED
1
$117,600
5
$143,858
1
$106,740
0
$0
1
$195,370
APPLICATIONS WITHDRAWN
1
$241,640
3
$176,353
0
$0
1
$108,040
0
$0
FILES CLOSED FOR INCOMPLETENESS
0
$0
1
$197,480
0
$0
0
$0
0
$0
Aggregated Statistics For Year 2005 (Based on 2 partial tracts)
A) FHA, FSA/RHS & VA Home Purchase Loans
B) Conventional Home Purchase Loans
C) Refinancings
D) Home Improvement Loans
F) Non-occupant Loans on < 5 Family Dwellings (A B C & D)
G) Loans On Manufactured Home Dwelling (A B C & D)
Number
Average Value
Number
Average Value
Number
Average Value
Number
Average Value
Number
Average Value
Number
Average Value
LOANS ORIGINATED
1
$110,260
5
$188,364
7
$162,454
1
$151,910
2
$208,895
2
$130,325
APPLICATIONS APPROVED, NOT ACCEPTED
0
$0
1
$225,550
2
$193,855
0
$0
0
$0
1
$89,940
APPLICATIONS DENIED
0
$0
2
$161,515
6
$162,268
1
$142,750
1
$90,340
1
$171,930
APPLICATIONS WITHDRAWN
0
$0
1
$193,760
4
$226,752
1
$78,970
0
$0
1
$122,430
FILES CLOSED FOR INCOMPLETENESS
0
$0
0
$0
1
$190,340
0
$0
0
$0
0
$0
Aggregated Statistics For Year 2004 (Based on 2 partial tracts)
B) Conventional Home Purchase Loans
C) Refinancings
D) Home Improvement Loans
F) Non-occupant Loans on < 5 Family Dwellings (A B C & D)
G) Loans On Manufactured Home Dwelling (A B C & D)
Number
Average Value
Number
Average Value
Number
Average Value
Number
Average Value
Number
Average Value
LOANS ORIGINATED
4
$169,638
7
$129,127
1
$117,800
1
$203,410
2
$150,900
APPLICATIONS APPROVED, NOT ACCEPTED
1
$166,790
2
$171,725
0
$0
0
$0
0
$0
APPLICATIONS DENIED
2
$106,585
4
$232,662
2
$126,150
0
$0
1
$76,050
APPLICATIONS WITHDRAWN
1
$251,100
3
$150,363
0
$0
1
$54,420
1
$89,330
FILES CLOSED FOR INCOMPLETENESS
0
$0
0
$0
0
$0
0
$0
0
$0
Aggregated Statistics For Year 2003 (Based on 2 partial tracts)
B) Conventional Home Purchase Loans
C) Refinancings
D) Home Improvement Loans
F) Non-occupant Loans on < 5 Family Dwellings (A B C & D)
Number
Average Value
Number
Average Value
Number
Average Value
Number
Average Value
LOANS ORIGINATED
3
$155,460
8
$129,182
1
$38,430
1
$131,180
APPLICATIONS APPROVED, NOT ACCEPTED
0
$0
2
$122,730
0
$0
0
$0
APPLICATIONS DENIED
1
$77,560
6
$100,935
1
$15,790
1
$85,910
APPLICATIONS WITHDRAWN
0
$0
3
$126,623
0
$0
0
$0
FILES CLOSED FOR INCOMPLETENESS
0
$0
1
$91,340
0
$0
0
$0
Aggregated Statistics For Year 2002 (Based on 2 partial tracts)
A) FHA, FSA/RHS & VA Home Purchase Loans
B) Conventional Home Purchase Loans
C) Refinancings
D) Home Improvement Loans
F) Non-occupant Loans on < 5 Family Dwellings (A B C & D)
Number
Average Value
Number
Average Value
Number
Average Value
Number
Average Value
Number
Average Value
LOANS ORIGINATED
1
$119,010
2
$115,840
8
$120,859
1
$6,340
1
$102,410
APPLICATIONS APPROVED, NOT ACCEPTED
0
$0
1
$45,570
2
$90,190
0
$0
0
$0
APPLICATIONS DENIED
0
$0
1
$126,450
4
$104,522
0
$0
0
$0
APPLICATIONS WITHDRAWN
0
$0
1
$79,680
1
$131,180
0
$0
0
$0
FILES CLOSED FOR INCOMPLETENESS
0
$0
0
$0
1
$66,090
0
$0
0
$0
Aggregated Statistics For Year 2001 (Based on 2 partial tracts)
A) FHA, FSA/RHS & VA Home Purchase Loans
B) Conventional Home Purchase Loans
C) Refinancings
D) Home Improvement Loans
F) Non-occupant Loans on < 5 Family Dwellings (A B C & D)
Number
Average Value
Number
Average Value
Number
Average Value
Number
Average Value
Number
Average Value
LOANS ORIGINATED
1
$50,300
3
$97,917
8
$104,298
1
$8,950
1
$115,790
APPLICATIONS APPROVED, NOT ACCEPTED
0
$0
1
$60,060
3
$110,660
0
$0
0
$0
APPLICATIONS DENIED
0
$0
2
$89,585
3
$92,450
0
$0
0
$0
APPLICATIONS WITHDRAWN
0
$0
1
$71,220
2
$104,170
0
$0
0
$0
FILES CLOSED FOR INCOMPLETENESS
0
$0
0
$0
1
$58,150
0
$0
0
$0
Aggregated Statistics For Year 2000 (Based on 2 partial tracts)
B) Conventional Home Purchase Loans
C) Refinancings
D) Home Improvement Loans
Number
Average Value
Number
Average Value
Number
Average Value
LOANS ORIGINATED
2
$106,485
3
$149,457
1
$26,960
APPLICATIONS APPROVED, NOT ACCEPTED
1
$126,550
1
$109,750
1
$13,780
APPLICATIONS DENIED
2
$112,270
3
$78,433
0
$0
APPLICATIONS WITHDRAWN
1
$65,990
1
$54,930
0
$0
FILES CLOSED FOR INCOMPLETENESS
0
$0
0
$0
0
$0
Aggregated Statistics For Year 1999 (Based on 1 partial tract)


 Nearest zip codes: 97524, 97536, 97539, 97541, 97504, 97503.