Estimated median house/condo value in 2022: $311,821
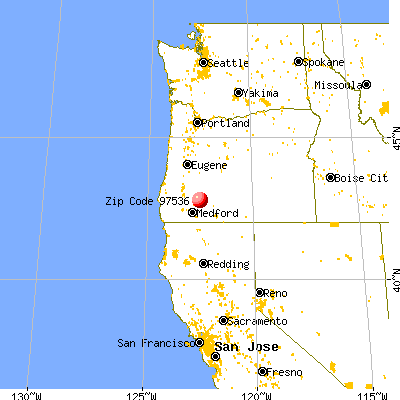
97536:
$311,821
Oregon:
$475,600
Median resident age:
This zip code:
55.1 years
Oregon median age:
40.5 years
Average household size:
This zip code:
2.4 people
Oregon:
2.4 people
Averages for the 2020 tax year for zip code 97536, filed in 2021:
Average Adjusted Gross Income (AGI) in 2020: $50,237 (Individual Income Tax Returns)
Here:
$50,237
State:
$76,001
Salary/wage: $41,103 (reported on 72.1% of returns)
Here:
$41,103
State:
$61,959
(% of AGI for various income ranges: 1130.0% for AGIs below $25k, 3582.9% for AGIs $25k-50k, 6520.0% for AGIs $50k-75k, 7415.0% for AGIs $75k-100k, 25065.0% for AGIs $100k-200k)
Taxable interest for individuals: $465 (reported on 39.5% of returns)
This zip code:
$465
Oregon:
$1,628
(% of AGI for various income ranges: 30.0% for AGIs below $25k, 32.9% for AGIs $25k-50k, 45.0% for AGIs $50k-75k, 40.0% for AGIs $100k-200k)
Ordinary dividends: $800 (reported on 7.0% of returns)
Here:
$800
State:
$7,165
(% of AGI for various income ranges: 34.3% for AGIs $25k-50k)
Net capital gain/loss in AGI: +$12,675 (reported on 9.3% of returns)
Here:
+$12,675
State:
+$23,403
(% of AGI for various income ranges: 41.0% for AGIs below $25k, 1165.0% for AGIs $50k-75k)
Profit/loss from business: +$10,012 (reported on 18.6% of returns)
Here:
+$10,012
State:
+$16,511
(% of AGI for various income ranges: 95.0% for AGIs below $25k, 1765.0% for AGIs $50k-75k)
Taxable individual retirement arrangement distribution: $11,200 (reported on 7.0% of returns)
97536:
$11,200
Oregon:
$20,730
(% of AGI for various income ranges: 480.0% for AGIs $25k-50k)
Total itemized deductions: $23,550 (reported on 4.7% of returns)
Here:
$23,550
State:
$31,050
(% of AGI for various income ranges: 672.9% for AGIs $25k-50k)
Taxes paid: $7,300 (reported on 4.7% of returns)
97536:
$7,300
State:
$8,487
(% of AGI for various income ranges: 208.6% for AGIs $25k-50k)
Earned income credit: $2,488 (reported on 18.6% of returns)
Here:
$2,488
State:
$1,977
(% of AGI for various income ranges: 148.0% for AGIs below $25k, 72.9% for AGIs $25k-50k)
Percentage of individuals using paid preparers for their 2020 taxes: 90.7%
Here:
91%
State:
93%
(% for various income ranges: 87.5% for AGIs below $25k, 90.9% for AGIs $25k-50k, 85.7% for AGIs $50k-75k, 100.0% for AGIs $75k-100k, 100.0% for AGIs $100k-200k)
Averages for the 2012 tax year for zip code 97536, filed in 2013:
Average Adjusted Gross Income (AGI) in 2012: $34,530 (Individual Income Tax Returns)
Here:
$34,530
State:
$57,845
Salary/wage: $29,300 (reported on 72.5% of returns)
Here:
$29,300
State:
$47,723
(% of AGI for various income ranges: 58.2% for AGIs below $25k, 63.6% for AGIs $25k-50k, 69.9% for AGIs $50k-75k, 56.3% for AGIs $75k-100k)
Taxable interest for individuals: $909 (reported on 27.5% of returns)
This zip code:
$909
Oregon:
$1,848
(% of AGI for various income ranges: 1.8% for AGIs below $25k, 1.2% for AGIs $25k-50k, 0.2% for AGIs $75k-100k)
Ordinary dividends: $920 (reported on 12.5% of returns)
Here:
$920
State:
$5,987
(% of AGI for various income ranges: 1.1% for AGIs below $25k, 0.6% for AGIs $50k-75k)
Profit/loss from business: +$7,433 (reported on 15.0% of returns)
Here:
+$7,433
State:
+$13,871
(% of AGI for various income ranges: 9.2% for AGIs below $25k, 6.0% for AGIs $25k-50k)
Taxable individual retirement arrangement distribution: $10,075 (reported on 10.0% of returns)
97536:
$10,075
Oregon:
$16,036
(% of AGI for various income ranges: 4.5% for AGIs below $25k, 8.1% for AGIs $25k-50k)
Total itemized deductions: $16,110 (29% of AGI, reported on 25.0% of returns)
Here:
$16,110
State:
$24,430
Here:
28.6% of AGI
State:
23.2% of AGI
(% of AGI for various income ranges: 14.2% for AGIs below $25k, 18.5% for AGIs $25k-50k, 12.6% for AGIs $75k-100k)
Charity contributions: $1,717 (reported on 15.0% of returns)
Here:
$1,717
State:
$3,648
(% of AGI for various income ranges: 2.0% for AGIs $25k-50k, 0.7% for AGIs $75k-100k)
Taxes paid: $4,250 (reported on 25.0% of returns)
97536:
$4,250
State:
$10,269
(% of AGI for various income ranges: 1.4% for AGIs below $25k, 4.5% for AGIs $25k-50k, 4.8% for AGIs $75k-100k)
Earned income credit: $1,944 (reported on 22.5% of returns)
Here:
$1,944
State:
$2,021
(% of AGI for various income ranges: 7.1% for AGIs below $25k)
Percentage of individuals using paid preparers for their 2012 taxes: 52.5%
Here:
52%
State:
47%
(% for various income ranges: 40.0% for AGIs below $25k, 60.0% for AGIs $25k-50k, 60.0% for AGIs $50k-75k, 80.0% for AGIs $75k-100k)
Averages for the 2004 tax year for zip code 97536, filed in 2005:
Average Adjusted Gross Income (AGI) in 2004: $39,801 (Individual Income Tax Returns)
Here:
$39,801
State:
$46,788
Salary/wage: $33,664 (reported on 76.3% of returns)
Here:
$33,664
State:
$39,788
(% of AGI for various income ranges: 59.7% for AGIs $10k-25k, 69.8% for AGIs $25k-50k, 68.5% for AGIs $50k-75k, 54.7% for AGIs $75k-100k)
Taxable interest for individuals: $1,395 (reported on 46.5% of returns)
This zip code:
$1,395
Oregon:
$2,126
(% of AGI for various income ranges: 3.6% for AGIs $10k-25k, 1.6% for AGIs $25k-50k, 1.4% for AGIs $50k-75k, 0.7% for AGIs $75k-100k)
Taxable dividends: $1,600 (reported on 17.4% of returns)
Here:
$1,600
State:
$3,427
(% of AGI for various income ranges: 0.5% for AGIs $10k-25k, 0.6% for AGIs $25k-50k, 0.4% for AGIs $50k-75k, 1.3% for AGIs $75k-100k)
Net capital gain/loss: +$3,865 (reported on 16.5% of returns)
Here:
+$3,865
State:
+$12,447
Profit/loss from business: +$8,205 (reported on 13.9% of returns)
Here:
+$8,205
State:
+$11,682
Total itemized deductions: $17,549 (33% of AGI, reported on 38.6% of returns)
Here:
$17,549
State:
$20,209
Here:
32.9% of AGI
State:
24.7% of AGI
(% of AGI for various income ranges: 15.8% for AGIs $10k-25k, 16.9% for AGIs $25k-50k, 17.8% for AGIs $50k-75k, 17.0% for AGIs $75k-100k)
Charity contributions deductions: $1,682 (3% of AGI, reported on 27.8% of returns)
Here:
$1,682
State:
$3,145
Here:
3.0% of AGI
State:
3.6% of AGI
(% of AGI for various income ranges: 0.5% for AGIs $10k-25k, 0.9% for AGIs $25k-50k, 1.6% for AGIs $50k-75k, 1.5% for AGIs $75k-100k)
Total tax: $3,673 (reported on 81.3% of returns)
97536:
$3,673
State:
$7,148
(% of AGI for various income ranges: 3.6% for AGIs $10k-25k, 6.9% for AGIs $25k-50k, 8.0% for AGIs $50k-75k, 10.3% for AGIs $75k-100k)
Earned income credit: $1,905 (reported on 13.3% of returns)
Here:
$1,905
State:
$1,605
Percentage of individuals using paid preparers for their 2004 taxes: 57.6%
Here:
58%
State:
53%
(% for various income ranges: 56.6% for AGIs $10k-25k, 54.8% for AGIs $25k-50k, 60.7% for AGIs $50k-75k, 66.7% for AGIs $75k-100k)
Household received Food Stamps/SNAP in the past 12 months: 49 Household did not receive Food Stamps/SNAP in the past 12 months: 424
Women who had a birth in the past 12 months: 2 (2 now married, 0 unmarried) Women who did not have a birth in the past 12 months: 194 (114 now married, 78 unmarried)
Housing units in zip code 97536 with a mortgage: 197 (23 second mortgage, 8 both second mortgage and home equity loan) Median monthly owner costs for units with a mortgage: $1,555 Median monthly owner costs for units without a mortgage: $381
Residents with income below the poverty level in 2022:
This zip code:
14.6%
Whole state:
12.1%
Residents with income below 50% of the poverty level in 2022:
This zip code:
5.5%
Whole state:
6.2%
Median number of rooms in houses and condos:
Here:
5.3
State:
6.2
Median number of rooms in apartments:
Here:
4.3
State:
4.0
Notable locations in this zip code not listed on our city pages
Notable locations in zip code 97536: Katydid Ranch (A), Mill Creek Recreation Site (B), Halls Cabin (C), Union Creek Resort (D), Union Creek Recreation Site (E), Natural Bridge Recreation Site (F), White Point Lookout (G), River Bridge Recreation Site (H), Farewell Bend Recreation Site (I), Union Rogue Church Camp (J), Prospect Guard Station (K), Natural Bridge Viewpoint (L), Rogue Gorge Recreation Site (M), Skeeters Camp (N), Ulrich Ranch (O), Prospect Sanitary Landfill (P), Prospect Branch Library (Q), Prospect Fire Department (R), United States Forest Service Prospect Ranger District (S), Prospect Ranger Station (T). Display/hide their locations on the map
Creeks: Dead Soldier Creek (A), Coffee Creek (B), Cod Creek (C), Grouse Creek (D), Ginkgo Creek (E), Hurd Creek (F), Middle Creek (G), Crawford Creek (H), Mill Creek (I). Display/hide their locations on the map
Size of family households: 222 2-persons, 24 3-persons, 41 4-persons, 44 5-persons, 8 6-persons, 1 7-or-more-persons
Size of nonfamily households: 86 1-person, 31 2-persons, 10 3-persons
171 married couples with children.
12 single-parent households (12 women).
98.3% of residents of 97536 zip code speak English at home.
1.5% of residents speak Spanish at home (82% very well, 18% well).
0.1% of residents speak other Indo-European language at home (100% very well).
0.3% of residents speak Asian or Pacific Island language at home (100% very well).
Foreign born population: 30 (2.6%) (62.4% of them are naturalized citizens)
This zip code:
2.6%
Whole state:
9.9%
47%France
47%El Salvador
17%Ireland
31%English
9%Irish
9%German
4%Norwegian
3%American
2%Scottish
2%Slavic
Year of entry for the foreign-born population
02010 or later
02000 to 2009
01990 to 1999
54Before 1990
Housing units lacking complete plumbing facilities: 2.6% Housing units lacking complete kitchen facilities: 1.5%
43.5%Wood
36.3%Electricity
17.3%Fuel oil, kerosene, etc.
1.5%Utility gas
0.9%Bottled, tank, or LP gas
0.9%Other fuel
Population in 1990: 869. Population change in the 1990s: +2 (+0.2%).
Place of birth for U.S.-born residents:
This state: 524
Northeast: 24
Midwest: 158
South: 20
West: 380
58% of the 97536 zip code residents lived in the same house 5 years ago. Out of people who lived in different houses, 48% lived in this county. Out of people who lived in different counties, 50% lived in Oregon.
93% of the 97536 zip code residents lived in the same house 1 year ago. Out of people who lived in different houses, 86% moved from this county. Out of people who lived in different houses, 9% moved from different county within same state. Out of people who lived in different houses, 3% moved from different state.
Private vs. public school enrollment:
Students in private schools in grades 1 to 8 (elementary and middle school): 2
Here:
1.7%
Oregon:
13.7%
Students in private schools in grades 9 to 12 (high school):
Here:
0.0%
Oregon:
8.8%
Students in private undergraduate colleges: 6
Here:
12.9%
Oregon:
17.7%
Occupation by median earnings in the past 12 months ($)
76,971Transportation occupations
68,848Installation, maintenance, and repair occupations
68,299Education, training, and library occupations
58,259Management occupations
42,357Production occupations
37,606Construction and extraction occupations
Top industries in this zip code by the number of employees in 2005:
Administrative and Support and Waste Management and Remediation Services: Janitorial Services (5-9 employees: 1 establishment)
Administrative and Support and Waste Management and Remediation Services: Solid Waste Collection (5-9: 1)
Utilities: Hydroelectric Power Generation (5-9: 1)
Accommodation and Food Services: Hotels (except Casino Hotels) and Motels (1-4: 2)
Information: Data Processing, Hosting, and Related Services (1-4: 1)
Accommodation and Food Services: Drinking Places (Alcoholic Beverages) (1-4: 1)
Construction: Flooring Contractors (1-4: 1)
Utilities: Electric Power Distribution (1-4: 1)
Fatal accident statistics in 2014:
Fatal accident count: 2
Vehicles involved in fatal accidents: 3
Fatal accidents caused by drunken drivers: 1
Fatalities: 2
Persons involved in fatal accidents: 5
Pedestrians involved in fatal accidents: 0
Fatal accident statistics in 2010:
Fatal accident count: 2
Vehicles involved in fatal accidents: 2
Fatal accidents caused by drunken drivers: 1
Fatalities: 2
Persons involved in fatal accidents: 2
Pedestrians involved in fatal accidents: 0
Home Mortgage Disclosure Act Aggregated Statistics For Year 2009 (Based on 2 partial tracts)
A) FHA, FSA/RHS & VA Home Purchase Loans
B) Conventional Home Purchase Loans
C) Refinancings
D) Home Improvement Loans
F) Non-occupant Loans on < 5 Family Dwellings (A B C & D)
G) Loans On Manufactured Home Dwelling (A B C & D)
Number
Average Value
Number
Average Value
Number
Average Value
Number
Average Value
Number
Average Value
Number
Average Value
LOANS ORIGINATED
1
$186,530
1
$194,180
9
$200,641
1
$68,730
1
$84,560
2
$129,545
APPLICATIONS APPROVED, NOT ACCEPTED
0
$0
0
$0
1
$351,310
0
$0
0
$0
0
$0
APPLICATIONS DENIED
0
$0
1
$148,940
9
$215,992
1
$127,720
1
$92,050
1
$86,300
APPLICATIONS WITHDRAWN
0
$0
0
$0
1
$306,760
0
$0
0
$0
1
$117,800
FILES CLOSED FOR INCOMPLETENESS
0
$0
0
$0
0
$0
0
$0
0
$0
0
$0
Aggregated Statistics For Year 2008 (Based on 2 partial tracts)
A) FHA, FSA/RHS & VA Home Purchase Loans
B) Conventional Home Purchase Loans
C) Refinancings
D) Home Improvement Loans
F) Non-occupant Loans on < 5 Family Dwellings (A B C & D)
G) Loans On Manufactured Home Dwelling (A B C & D)
Number
Average Value
Number
Average Value
Number
Average Value
Number
Average Value
Number
Average Value
Number
Average Value
LOANS ORIGINATED
1
$82,650
1
$214,370
6
$190,240
0
$0
1
$116,580
1
$174,700
APPLICATIONS APPROVED, NOT ACCEPTED
0
$0
0
$0
2
$244,210
0
$0
0
$0
1
$172,780
APPLICATIONS DENIED
1
$98,140
1
$207,580
5
$147,378
2
$74,820
1
$173,830
3
$120,003
APPLICATIONS WITHDRAWN
0
$0
0
$0
2
$162,170
0
$0
0
$0
1
$72,730
FILES CLOSED FOR INCOMPLETENESS
0
$0
1
$67,690
1
$107,180
0
$0
0
$0
0
$0
Aggregated Statistics For Year 2007 (Based on 2 partial tracts)
B) Conventional Home Purchase Loans
C) Refinancings
D) Home Improvement Loans
F) Non-occupant Loans on < 5 Family Dwellings (A B C & D)
G) Loans On Manufactured Home Dwelling (A B C & D)
Number
Average Value
Number
Average Value
Number
Average Value
Number
Average Value
Number
Average Value
LOANS ORIGINATED
3
$181,597
9
$207,176
2
$53,680
2
$184,790
3
$161,937
APPLICATIONS APPROVED, NOT ACCEPTED
0
$0
2
$207,670
0
$0
0
$0
0
$0
APPLICATIONS DENIED
1
$231,420
8
$190,182
2
$45,590
1
$229,330
2
$173,390
APPLICATIONS WITHDRAWN
1
$120,230
4
$252,475
1
$118,320
1
$137,460
0
$0
FILES CLOSED FOR INCOMPLETENESS
0
$0
2
$180,005
0
$0
0
$0
0
$0
Aggregated Statistics For Year 2006 (Based on 2 partial tracts)
A) FHA, FSA/RHS & VA Home Purchase Loans
B) Conventional Home Purchase Loans
C) Refinancings
D) Home Improvement Loans
F) Non-occupant Loans on < 5 Family Dwellings (A B C & D)
G) Loans On Manufactured Home Dwelling (A B C & D)
Number
Average Value
Number
Average Value
Number
Average Value
Number
Average Value
Number
Average Value
Number
Average Value
LOANS ORIGINATED
1
$98,140
5
$203,232
12
$178,277
1
$76,730
2
$192,530
3
$163,503
APPLICATIONS APPROVED, NOT ACCEPTED
0
$0
1
$261,170
2
$222,545
1
$99,350
0
$0
1
$108,400
APPLICATIONS DENIED
0
$0
1
$203,410
9
$138,233
2
$92,305
1
$95,350
2
$168,955
APPLICATIONS WITHDRAWN
0
$0
2
$208,975
5
$183,014
0
$0
1
$186,880
0
$0
FILES CLOSED FOR INCOMPLETENESS
0
$0
0
$0
2
$170,780
0
$0
0
$0
0
$0
Aggregated Statistics For Year 2005 (Based on 2 partial tracts)
A) FHA, FSA/RHS & VA Home Purchase Loans
B) Conventional Home Purchase Loans
C) Refinancings
D) Home Improvement Loans
F) Non-occupant Loans on < 5 Family Dwellings (A B C & D)
G) Loans On Manufactured Home Dwelling (A B C & D)
Number
Average Value
Number
Average Value
Number
Average Value
Number
Average Value
Number
Average Value
Number
Average Value
LOANS ORIGINATED
1
$190,700
9
$180,999
12
$163,908
2
$131,370
3
$240,873
3
$150,277
APPLICATIONS APPROVED, NOT ACCEPTED
0
$0
2
$195,055
3
$223,533
1
$19,140
1
$80,740
1
$155,560
APPLICATIONS DENIED
0
$0
3
$186,237
10
$168,397
2
$123,455
1
$156,250
2
$148,685
APPLICATIONS WITHDRAWN
0
$0
2
$167,560
6
$261,463
1
$136,590
0
$0
1
$211,760
FILES CLOSED FOR INCOMPLETENESS
0
$0
0
$0
1
$329,210
0
$0
0
$0
0
$0
Aggregated Statistics For Year 2004 (Based on 2 partial tracts)
A) FHA, FSA/RHS & VA Home Purchase Loans
B) Conventional Home Purchase Loans
C) Refinancings
D) Home Improvement Loans
F) Non-occupant Loans on < 5 Family Dwellings (A B C & D)
G) Loans On Manufactured Home Dwelling (A B C & D)
Number
Average Value
Number
Average Value
Number
Average Value
Number
Average Value
Number
Average Value
Number
Average Value
LOANS ORIGINATED
1
$68,210
8
$146,704
12
$130,282
1
$203,750
2
$175,915
4
$130,500
APPLICATIONS APPROVED, NOT ACCEPTED
0
$0
1
$288,490
3
$198,013
1
$42,110
0
$0
1
$79,690
APPLICATIONS DENIED
0
$0
4
$92,178
7
$229,953
3
$145,463
1
$60,900
1
$131,540
APPLICATIONS WITHDRAWN
0
$0
2
$217,150
6
$130,037
1
$98,310
1
$94,130
1
$154,510
FILES CLOSED FOR INCOMPLETENESS
0
$0
1
$56,550
1
$91,870
0
$0
0
$0
0
$0
Aggregated Statistics For Year 2003 (Based on 2 partial tracts)
B) Conventional Home Purchase Loans
C) Refinancings
D) Home Improvement Loans
F) Non-occupant Loans on < 5 Family Dwellings (A B C & D)
Number
Average Value
Number
Average Value
Number
Average Value
Number
Average Value
LOANS ORIGINATED
5
$161,332
15
$119,167
1
$66,470
2
$113,450
APPLICATIONS APPROVED, NOT ACCEPTED
1
$71,690
3
$141,520
0
$0
0
$0
APPLICATIONS DENIED
1
$134,150
10
$104,748
1
$27,320
1
$148,600
APPLICATIONS WITHDRAWN
1
$72,910
5
$131,404
0
$0
1
$42,460
FILES CLOSED FOR INCOMPLETENESS
1
$86,650
1
$157,990
0
$0
0
$0
Aggregated Statistics For Year 2002 (Based on 2 partial tracts)
A) FHA, FSA/RHS & VA Home Purchase Loans
B) Conventional Home Purchase Loans
C) Refinancings
D) Home Improvement Loans
F) Non-occupant Loans on < 5 Family Dwellings (A B C & D)
Number
Average Value
Number
Average Value
Number
Average Value
Number
Average Value
Number
Average Value
LOANS ORIGINATED
2
$102,920
4
$100,180
14
$119,451
1
$10,960
2
$88,565
APPLICATIONS APPROVED, NOT ACCEPTED
0
$0
1
$78,820
3
$103,993
0
$0
0
$0
APPLICATIONS DENIED
1
$79,000
2
$109,360
6
$120,523
0
$0
1
$24,710
APPLICATIONS WITHDRAWN
0
$0
2
$68,905
2
$113,450
0
$0
0
$0
FILES CLOSED FOR INCOMPLETENESS
0
$0
0
$0
1
$114,320
0
$0
0
$0
Aggregated Statistics For Year 2001 (Based on 2 partial tracts)
A) FHA, FSA/RHS & VA Home Purchase Loans
B) Conventional Home Purchase Loans
C) Refinancings
D) Home Improvement Loans
F) Non-occupant Loans on < 5 Family Dwellings (A B C & D)
Number
Average Value
Number
Average Value
Number
Average Value
Number
Average Value
Number
Average Value
LOANS ORIGINATED
1
$87,000
5
$101,616
13
$111,012
1
$15,490
2
$100,135
APPLICATIONS APPROVED, NOT ACCEPTED
0
$0
1
$103,880
5
$114,840
0
$0
1
$34,630
APPLICATIONS DENIED
0
$0
3
$103,297
4
$119,930
1
$20,530
0
$0
APPLICATIONS WITHDRAWN
0
$0
1
$123,190
3
$120,117
0
$0
0
$0
FILES CLOSED FOR INCOMPLETENESS
0
$0
0
$0
1
$100,570
0
$0
0
$0
Aggregated Statistics For Year 2000 (Based on 2 partial tracts)
B) Conventional Home Purchase Loans
C) Refinancings
D) Home Improvement Loans
Number
Average Value
Number
Average Value
Number
Average Value
LOANS ORIGINATED
3
$122,787
5
$155,104
2
$23,315
APPLICATIONS APPROVED, NOT ACCEPTED
2
$109,445
2
$94,915
1
$23,840
APPLICATIONS DENIED
3
$129,457
5
$81,398
1
$14,620
APPLICATIONS WITHDRAWN
1
$114,140
1
$95,000
0
$0
FILES CLOSED FOR INCOMPLETENESS
0
$0
0
$0
0
$0
Aggregated Statistics For Year 1999 (Based on 1 partial tract)


 Nearest zip codes: 97522, 97541, 97604, 97524, 97539, 97484.


