Estimated median house/condo value in 2022: $675,364
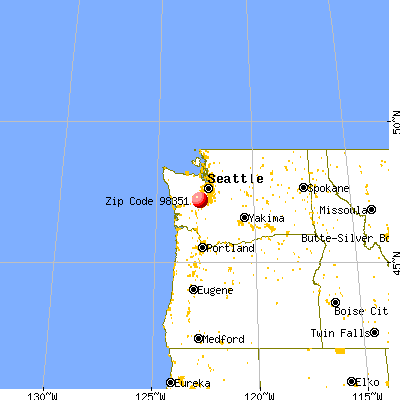
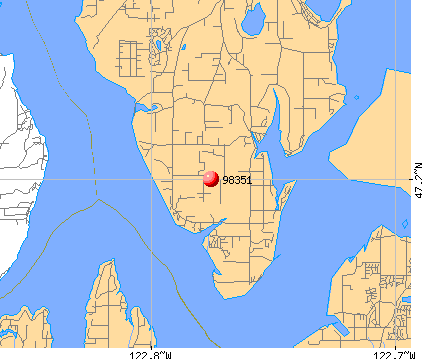
98351:
$675,364
Washington:
$569,500
Median resident age:
This zip code:
63.5 years
Washington median age:
38.4 years
Average household size:
This zip code:
2.1 people
Washington:
2.5 people
Averages for the 2020 tax year for zip code 98351, filed in 2021:
Average Adjusted Gross Income (AGI) in 2020: $75,550 (Individual Income Tax Returns)
Here:
$75,550
State:
$99,264
Salary/wage: $59,157 (reported on 70.0% of returns)
Here:
$59,157
State:
$80,347
(% of AGI for various income ranges: 927.5% for AGIs below $25k, 2591.2% for AGIs $25k-50k, 5901.7% for AGIs $50k-75k, 8997.5% for AGIs $75k-100k, 17916.7% for AGIs $100k-200k)
Taxable interest for individuals: $612 (reported on 32.0% of returns)
This zip code:
$612
Washington:
$2,077
(% of AGI for various income ranges: 10.0% for AGIs below $25k, 12.5% for AGIs $25k-50k, 21.7% for AGIs $50k-75k, 27.5% for AGIs $75k-100k, 41.7% for AGIs $100k-200k)
Ordinary dividends: $6,180 (reported on 20.0% of returns)
Here:
$6,180
State:
$10,013
(% of AGI for various income ranges: 48.8% for AGIs below $25k, 145.0% for AGIs $50k-75k, 820.0% for AGIs $100k-200k)
Net capital gain/loss in AGI: +$17,810 (reported on 20.0% of returns)
Here:
+$17,810
State:
+$40,092
(% of AGI for various income ranges: 106.2% for AGIs $25k-50k, 2826.7% for AGIs $100k-200k)
Profit/loss from business: +$15,100 (reported on 12.0% of returns)
Here:
+$15,100
State:
+$18,312
(% of AGI for various income ranges: 147.5% for AGIs below $25k, 200.0% for AGIs $25k-50k, 1570.0% for AGIs $75k-100k)
Taxable individual retirement arrangement distribution: $30,940 (reported on 10.0% of returns)
98351:
$30,940
Washington:
$24,221
(% of AGI for various income ranges: 697.5% for AGIs $25k-50k, 1648.3% for AGIs $100k-200k)
Total itemized deductions: $28,350 (reported on 12.0% of returns)
Here:
$28,350
State:
$39,068
(% of AGI for various income ranges: 783.8% for AGIs $25k-50k, 1790.0% for AGIs $100k-200k)
Charity contributions: $2,500 (reported on 8.0% of returns)
Here:
$2,500
State:
$15,331
(% of AGI for various income ranges: 166.7% for AGIs $100k-200k)
Taxes paid: $6,900 (reported on 12.0% of returns)
98351:
$6,900
State:
$7,774
(% of AGI for various income ranges: 172.5% for AGIs $25k-50k, 460.0% for AGIs $100k-200k)
Earned income credit: $2,425 (reported on 8.0% of returns)
Here:
$2,425
State:
$2,020
(% of AGI for various income ranges: 121.2% for AGIs below $25k)
Percentage of individuals using paid preparers for their 2020 taxes: 92.0%
Here:
92%
State:
93%
(% for various income ranges: 92.3% for AGIs below $25k, 90.0% for AGIs $25k-50k, 100.0% for AGIs $50k-75k, 100.0% for AGIs $75k-100k, 88.9% for AGIs $100k-200k, 66.7% for AGIs over 200k)
Averages for the 2012 tax year for zip code 98351, filed in 2013:
Average Adjusted Gross Income (AGI) in 2012: $60,466 (Individual Income Tax Returns)
Here:
$60,466
State:
$69,533
Salary/wage: $54,143 (reported on 65.7% of returns)
Here:
$54,143
State:
$57,267
(% of AGI for various income ranges: 52.2% for AGIs below $25k, 54.6% for AGIs $25k-50k, 68.7% for AGIs $50k-75k, 60.7% for AGIs $75k-100k, 56.6% for AGIs $100k-200k)
Taxable interest for individuals: $767 (reported on 42.9% of returns)
This zip code:
$767
Washington:
$1,816
(% of AGI for various income ranges: 0.4% for AGIs below $25k, 0.6% for AGIs $25k-50k, 1.1% for AGIs $50k-75k, 0.5% for AGIs $100k-200k)
Ordinary dividends: $3,250 (reported on 22.9% of returns)
Here:
$3,250
State:
$8,163
(% of AGI for various income ranges: 3.9% for AGIs below $25k, 1.2% for AGIs $50k-75k, 1.7% for AGIs $100k-200k)
Net capital gain/loss in AGI: +$483 (reported on 17.1% of returns)
Here:
+$483
State:
+$21,568
(% of AGI for various income ranges: 0.6% for AGIs $100k-200k)
Profit/loss from business: +$11,460 (reported on 14.3% of returns)
Here:
+$11,460
State:
+$16,521
Taxable individual retirement arrangement distribution: $23,217 (reported on 17.1% of returns)
98351:
$23,217
Washington:
$18,648
Total itemized deductions: $20,513 (23% of AGI, reported on 42.9% of returns)
Here:
$20,513
State:
$23,872
Here:
23.0% of AGI
State:
18.2% of AGI
(% of AGI for various income ranges: 16.9% for AGIs $25k-50k, 16.5% for AGIs $50k-75k, 16.0% for AGIs $75k-100k, 14.8% for AGIs $100k-200k)
Charity contributions: $2,430 (reported on 28.6% of returns)
Here:
$2,430
State:
$4,465
(% of AGI for various income ranges: 2.4% for AGIs below $25k, 1.5% for AGIs $50k-75k, 0.7% for AGIs $75k-100k, 1.3% for AGIs $100k-200k)
Taxes paid: $6,707 (reported on 40.0% of returns)
98351:
$6,707
State:
$6,400
(% of AGI for various income ranges: 4.7% for AGIs $25k-50k, 4.2% for AGIs $50k-75k, 4.0% for AGIs $75k-100k, 5.3% for AGIs $100k-200k)
Earned income credit: $1,800 (reported on 11.4% of returns)
Here:
$1,800
State:
$2,073
(% of AGI for various income ranges: 4.9% for AGIs below $25k)
Percentage of individuals using paid preparers for their 2012 taxes: 45.7%
Here:
46%
State:
43%
(% for various income ranges: 30.0% for AGIs below $25k, 50.0% for AGIs $25k-50k, 83.3% for AGIs $50k-75k, 66.7% for AGIs $100k-200k)
Averages for the 2004 tax year for zip code 98351, filed in 2005:
Average Adjusted Gross Income (AGI) in 2004: $57,615 (Individual Income Tax Returns)
Here:
$57,615
State:
$54,331
Salary/wage: $43,902 (reported on 69.3% of returns)
Here:
$43,902
State:
$45,761
(% of AGI for various income ranges: 81.6% for AGIs below $10k, 43.9% for AGIs $10k-25k, 61.6% for AGIs $25k-50k, 70.7% for AGIs $50k-75k, 71.8% for AGIs $75k-100k, 37.6% for AGIs over 100k)
Taxable interest for individuals: $1,855 (reported on 56.0% of returns)
This zip code:
$1,855
Washington:
$2,110
(% of AGI for various income ranges: 2.5% for AGIs below $10k, 3.5% for AGIs $10k-25k, 1.5% for AGIs $25k-50k, 0.6% for AGIs $50k-75k, 0.2% for AGIs $75k-100k, 2.6% for AGIs over 100k)
Taxable dividends: $3,917 (reported on 31.1% of returns)
Here:
$3,917
State:
$5,879
(% of AGI for various income ranges: 4.6% for AGIs $10k-25k, 0.8% for AGIs $25k-50k, 0.5% for AGIs $50k-75k, 0.5% for AGIs $75k-100k, 3.4% for AGIs over 100k)
Net capital gain/loss: +$26,077 (reported on 25.2% of returns)
Here:
+$26,077
State:
+$15,835
(% of AGI for various income ranges: 2.0% for AGIs $10k-25k, 0.5% for AGIs $25k-50k, -0.6% for AGIs $50k-75k, 24.5% for AGIs over 100k)
Profit/loss from business: +$4,765 (reported on 11.0% of returns)
Here:
+$4,765
State:
+$13,994
Total itemized deductions: $21,238 (24% of AGI, reported on 42.1% of returns)
Here:
$21,238
State:
$19,669
Here:
23.9% of AGI
State:
20.7% of AGI
(% of AGI for various income ranges: 20.5% for AGIs $10k-25k, 17.1% for AGIs $25k-50k, 17.3% for AGIs $50k-75k, 16.7% for AGIs $75k-100k, 13.8% for AGIs over 100k)
Charity contributions deductions: $2,575 (3% of AGI, reported on 36.6% of returns)
Here:
$2,575
State:
$3,569
Here:
2.6% of AGI
State:
3.5% of AGI
(% of AGI for various income ranges: 3.3% for AGIs below $10k, 1.7% for AGIs $25k-50k, 0.9% for AGIs $50k-75k, 2.5% for AGIs $75k-100k, 1.8% for AGIs over 100k)
Total tax: $8,624 (reported on 76.7% of returns)
98351:
$8,624
State:
$9,065
(% of AGI for various income ranges: 0.8% for AGIs below $10k, 3.4% for AGIs $10k-25k, 6.2% for AGIs $25k-50k, 8.2% for AGIs $50k-75k, 10.0% for AGIs $75k-100k, 16.2% for AGIs over 100k)
Earned income credit: $1,680 (reported on 8.1% of returns)
Here:
$1,680
State:
$1,607
Percentage of individuals using paid preparers for their 2004 taxes: 55.0%
Here:
55%
State:
49%
(% for various income ranges: 40.7% for AGIs below $10k, 54.0% for AGIs $10k-25k, 61.1% for AGIs $25k-50k, 57.4% for AGIs $50k-75k, 42.9% for AGIs $75k-100k, 71.1% for AGIs over 100k)
Household received Food Stamps/SNAP in the past 12 months: 64 Household did not receive Food Stamps/SNAP in the past 12 months: 485
Women who did not have a birth in the past 12 months: 94 (80 now married, 13 unmarried)
Housing units in zip code 98351 with a mortgage: 321 Median monthly owner costs for units with a mortgage: $1,732 Median monthly owner costs for units without a mortgage: $796
Residents with income below the poverty level in 2022:
This zip code:
7.5%
Whole state:
10.0%
Residents with income below 50% of the poverty level in 2022:
This zip code:
6.3%
Whole state:
4.6%
Median number of rooms in houses and condos:
Here:
6.0
State:
6.5
Notable locations in this zip code not listed on our city pages
Notable locations in zip code 98351: Drayton Light (A), McDermott Point Lighthouse (B), Longbranch Improvement Club Marina (C), Pierce County Fire Protection District 16 Station 4 (D). Display/hide their locations on the map
Size of family households: 266 2-persons, 55 3-persons, 46 5-persons
Size of nonfamily households: 116 1-person, 69 2-persons
127 married couples with children.
0 single-parent households ().
98.9% of residents of 98351 zip code speak English at home.
0.8% of residents speak Spanish at home (100% very well).
1.6% of residents speak Asian or Pacific Island language at home (100% well).
Foreign born population: 64 (5.7%) (45.7% of them are naturalized citizens)
This zip code:
5.7%
Whole state:
15.3%
41%Liberia
27%Malaysia
17%Serbia
33%Irish
12%Yugoslavian
9%Polish
7%European
6%Nigerian
5%English
4%German
Year of entry for the foreign-born population
202010 or later
162000 to 2009
01990 to 1999
27Before 1990
81.7%Electricity
14.7%Bottled, tank, or LP gas
2.1%Utility gas
1.9%Wood
Population in 1990: 733. Population change in the 1990s: +332 (+45.3%).
Place of birth for U.S.-born residents:
This state: 625
Northeast: 85
Midwest: 124
South: 80
West: 149
62% of the 98351 zip code residents lived in the same house 5 years ago. Out of people who lived in different houses, 43% lived in this county. Out of people who lived in different counties, 50% lived in Washington.
99% of the 98351 zip code residents lived in the same house 1 year ago. Out of people who lived in different houses, 169% moved from different county within same state.
Private vs. public school enrollment:
Students in private schools in grades 1 to 8 (elementary and middle school):
Here:
0.0%
Washington:
12.4%
Top industries in this zip code by the number of employees in 2005:
Health Care and Social Assistance: Child and Youth Services (10-19 employees: 1 establishment)
Other Services (except Public Administration): Religious Organizations (10-19: 1)
Real Estate and Rental and Leasing: Lessors of Residential Buildings and Dwellings (5-9: 1)
Administrative and Support and Waste Management and Remediation Services: Carpet and Upholstery Cleaning Services (5-9: 1)
Real Estate and Rental and Leasing: Offices of Real Estate Appraisers (1-4: 1)
Construction: Residential Remodelers (1-4: 1)
Construction: Painting and Wall Covering Contractors (1-4: 1)
Wholesale Trade: Wholesale Trade Agents and Brokers (1-4: 1)
Fatal accident statistics in 2011:
Fatal accident count: 1
Vehicles involved in fatal accidents: 1
Fatal accidents caused by drunken drivers: 0
Fatalities: 1
Persons involved in fatal accidents: 1
Pedestrians involved in fatal accidents: 0
Home Mortgage Disclosure Act Aggregated Statistics For Year 2009 (Based on 2 partial tracts)
A) FHA, FSA/RHS & VA Home Purchase Loans
B) Conventional Home Purchase Loans
C) Refinancings
D) Home Improvement Loans
F) Non-occupant Loans on < 5 Family Dwellings (A B C & D)
G) Loans On Manufactured Home Dwelling (A B C & D)
Number
Average Value
Number
Average Value
Number
Average Value
Number
Average Value
Number
Average Value
Number
Average Value
LOANS ORIGINATED
12
$189,138
11
$251,545
56
$211,830
2
$125,410
14
$222,444
10
$152,671
APPLICATIONS APPROVED, NOT ACCEPTED
0
$0
2
$191,720
6
$211,778
1
$14,120
2
$155,190
1
$133,540
APPLICATIONS DENIED
1
$105,300
2
$167,775
26
$240,464
3
$76,547
5
$248,732
5
$176,034
APPLICATIONS WITHDRAWN
0
$0
2
$216,130
13
$240,074
1
$686,140
2
$310,530
2
$179,595
FILES CLOSED FOR INCOMPLETENESS
0
$0
0
$0
2
$236,085
0
$0
0
$0
0
$0
Aggregated Statistics For Year 2008 (Based on 2 partial tracts)
A) FHA, FSA/RHS & VA Home Purchase Loans
B) Conventional Home Purchase Loans
C) Refinancings
D) Home Improvement Loans
F) Non-occupant Loans on < 5 Family Dwellings (A B C & D)
G) Loans On Manufactured Home Dwelling (A B C & D)
Number
Average Value
Number
Average Value
Number
Average Value
Number
Average Value
Number
Average Value
Number
Average Value
LOANS ORIGINATED
8
$195,290
16
$251,394
41
$220,680
3
$73,680
11
$218,695
12
$180,695
APPLICATIONS APPROVED, NOT ACCEPTED
0
$0
2
$392,190
10
$208,791
1
$148,280
3
$256,857
2
$151,350
APPLICATIONS DENIED
2
$280,135
5
$245,108
29
$248,988
6
$127,558
4
$180,822
5
$174,622
APPLICATIONS WITHDRAWN
1
$299,940
3
$218,993
16
$196,921
1
$18,420
3
$198,013
4
$147,975
FILES CLOSED FOR INCOMPLETENESS
0
$0
1
$220,730
4
$225,722
1
$149,200
1
$288,580
0
$0
Aggregated Statistics For Year 2007 (Based on 2 partial tracts)
A) FHA, FSA/RHS & VA Home Purchase Loans
B) Conventional Home Purchase Loans
C) Refinancings
D) Home Improvement Loans
F) Non-occupant Loans on < 5 Family Dwellings (A B C & D)
G) Loans On Manufactured Home Dwelling (A B C & D)
Number
Average Value
Number
Average Value
Number
Average Value
Number
Average Value
Number
Average Value
Number
Average Value
LOANS ORIGINATED
7
$180,999
38
$223,213
61
$211,780
6
$126,075
20
$262,009
21
$159,040
APPLICATIONS APPROVED, NOT ACCEPTED
0
$0
6
$263,048
8
$177,906
0
$0
4
$298,250
1
$140,300
APPLICATIONS DENIED
3
$187,270
15
$179,349
42
$220,331
11
$111,915
6
$172,483
16
$133,123
APPLICATIONS WITHDRAWN
1
$99,470
7
$264,196
17
$210,476
3
$179,083
2
$291,035
3
$151,250
FILES CLOSED FOR INCOMPLETENESS
0
$0
3
$140,913
8
$194,945
0
$0
2
$91,025
1
$85,650
Aggregated Statistics For Year 2006 (Based on 2 partial tracts)
A) FHA, FSA/RHS & VA Home Purchase Loans
B) Conventional Home Purchase Loans
C) Refinancings
D) Home Improvement Loans
F) Non-occupant Loans on < 5 Family Dwellings (A B C & D)
G) Loans On Manufactured Home Dwelling (A B C & D)
Number
Average Value
Number
Average Value
Number
Average Value
Number
Average Value
Number
Average Value
Number
Average Value
LOANS ORIGINATED
7
$185,164
55
$169,269
63
$187,884
9
$102,709
25
$168,801
18
$146,866
APPLICATIONS APPROVED, NOT ACCEPTED
2
$116,815
9
$157,320
12
$231,145
1
$24,560
3
$169,157
5
$129,860
APPLICATIONS DENIED
2
$181,435
15
$162,301
34
$200,001
8
$98,240
5
$142,264
11
$116,800
APPLICATIONS WITHDRAWN
1
$254,500
6
$166,138
27
$208,680
2
$126,945
4
$139,455
4
$120,112
FILES CLOSED FOR INCOMPLETENESS
1
$128,630
2
$197,250
6
$172,585
0
$0
1
$123,410
1
$157,800
Aggregated Statistics For Year 2005 (Based on 2 partial tracts)
A) FHA, FSA/RHS & VA Home Purchase Loans
B) Conventional Home Purchase Loans
C) Refinancings
D) Home Improvement Loans
F) Non-occupant Loans on < 5 Family Dwellings (A B C & D)
G) Loans On Manufactured Home Dwelling (A B C & D)
Number
Average Value
Number
Average Value
Number
Average Value
Number
Average Value
Number
Average Value
Number
Average Value
LOANS ORIGINATED
11
$157,994
49
$161,532
60
$163,043
7
$99,204
21
$167,608
21
$129,042
APPLICATIONS APPROVED, NOT ACCEPTED
2
$104,685
10
$147,974
10
$147,391
2
$97,165
2
$188,960
4
$137,842
APPLICATIONS DENIED
1
$207,530
14
$147,119
38
$143,167
5
$80,126
4
$165,628
10
$110,520
APPLICATIONS WITHDRAWN
1
$200,780
8
$155,074
28
$156,471
3
$163,630
5
$122,984
4
$142,832
FILES CLOSED FOR INCOMPLETENESS
0
$0
3
$141,630
8
$165,242
1
$32,230
0
$0
1
$175,910
Aggregated Statistics For Year 2004 (Based on 2 partial tracts)
A) FHA, FSA/RHS & VA Home Purchase Loans
B) Conventional Home Purchase Loans
C) Refinancings
D) Home Improvement Loans
F) Non-occupant Loans on < 5 Family Dwellings (A B C & D)
G) Loans On Manufactured Home Dwelling (A B C & D)
Number
Average Value
Number
Average Value
Number
Average Value
Number
Average Value
Number
Average Value
Number
Average Value
LOANS ORIGINATED
9
$135,558
53
$139,349
64
$144,966
4
$67,848
23
$138,017
18
$115,756
APPLICATIONS APPROVED, NOT ACCEPTED
2
$133,085
6
$156,622
13
$171,731
1
$89,340
2
$91,025
3
$155,240
APPLICATIONS DENIED
2
$99,775
12
$119,551
38
$146,916
8
$65,353
6
$138,508
9
$118,537
APPLICATIONS WITHDRAWN
1
$133,850
8
$171,959
27
$126,700
3
$60,070
2
$148,280
5
$104,502
FILES CLOSED FOR INCOMPLETENESS
0
$0
2
$138,150
6
$145,058
1
$32,850
1
$98,850
1
$72,450
Aggregated Statistics For Year 2003 (Based on 2 partial tracts)
A) FHA, FSA/RHS & VA Home Purchase Loans
B) Conventional Home Purchase Loans
C) Refinancings
D) Home Improvement Loans
F) Non-occupant Loans on < 5 Family Dwellings (A B C & D)
Number
Average Value
Number
Average Value
Number
Average Value
Number
Average Value
Number
Average Value
LOANS ORIGINATED
6
$125,358
30
$126,955
102
$135,574
2
$28,860
28
$129,126
APPLICATIONS APPROVED, NOT ACCEPTED
1
$139,990
4
$208,838
14
$119,160
1
$23,020
2
$92,865
APPLICATIONS DENIED
0
$0
10
$154,114
29
$132,963
3
$45,540
4
$139,455
APPLICATIONS WITHDRAWN
0
$0
5
$172,412
30
$144,167
1
$9,210
4
$107,450
FILES CLOSED FOR INCOMPLETENESS
0
$0
2
$186,040
3
$140,300
0
$0
1
$89,030
Aggregated Statistics For Year 1999 (Based on 1 partial tract)
A) FHA, FSA/RHS & VA Home Purchase Loans
B) Conventional Home Purchase Loans
C) Refinancings
D) Home Improvement Loans
F) Non-occupant Loans on < 5 Family Dwellings (A B C & D)


 Nearest zip codes: 98349, 98388, 98303, 98516, 98394, 98506.