Estimated zip code population in 2022: 1,259 Zip code population in 2010: 1,107 Zip code population in 2000: 786
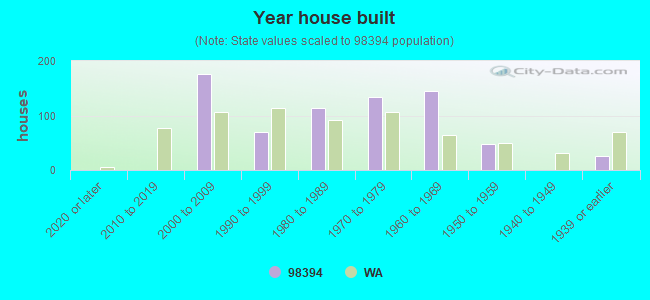
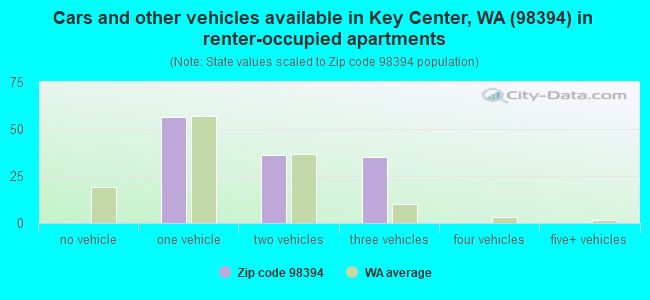
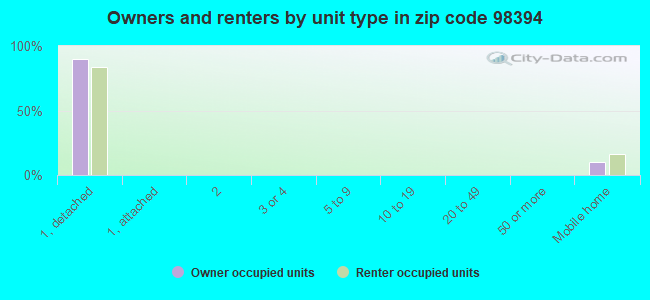
Houses and condos: 739 Renter-occupied apartments: 129
% of renters here:
24%
State:
36%
March 2022 cost of living index in zip code 98394: 94.6 (less than average, U.S. average is 100)
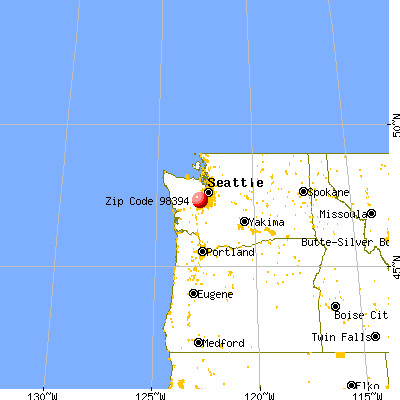
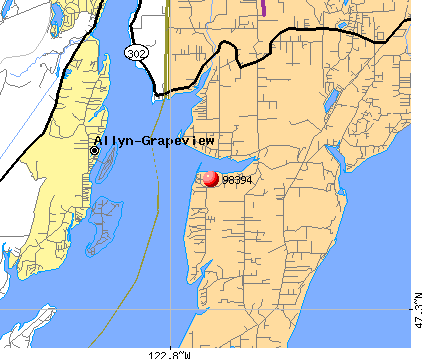
Land area: 5.5 sq. mi. Water area: 1.0 sq. mi.
Population density: 227 people per square mile
(very low).
OSM Map
General Map
Google Map
MSN Map
OSM Map
General Map
Google Map
MSN Map
OSM Map
General Map
Google Map
MSN Map
OSM Map
General Map
Google Map
MSN Map
Please wait while loading the map...
Real estate property taxes paid for housing units in 2022:
This zip code:
0.7% ($4,103)
Washington:
0.8% ($4,283)
Median real estate property taxes paid for housing units with mortgages in 2022: $4,098 (0.7%) Median real estate property taxes paid for housing units with no mortgage in 2022: $5,390 (1.0%)
Business Search- 14 Million verified businesses
Males: 547
(43.5%)
Females: 712
(56.5%)
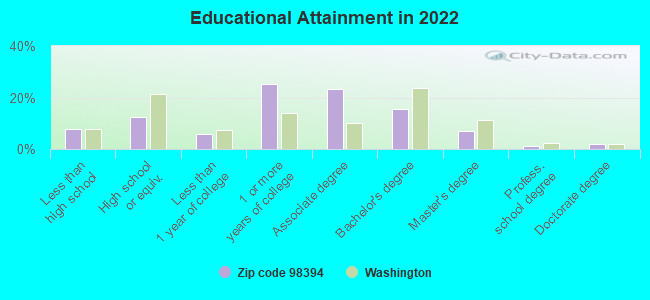
For population 25 years and over in 98394:
High school or higher: 91.2%
Bachelor's degree or higher: 25.4%
Graduate or professional degree: 10.0%
Unemployed: 4.7%
Mean travel time to work (commute): 34.0 minutes
For population 15 years and over in 98394:
Never married: 32.0%
Now married: 44.1%
Separated: 2.8%
Widowed: 2.1%
Divorced: 19.1%
Zip code 98394 compared to state average:
Median household income significantly below state average.
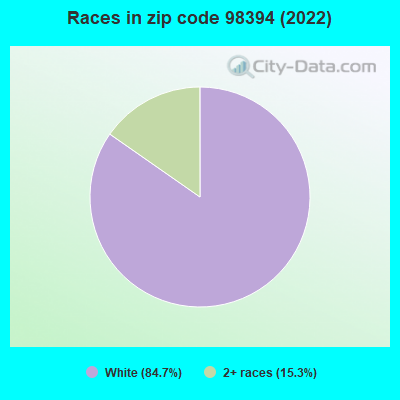
Black race population percentage significantly below state average.
Hispanic race population percentage significantly below state average.
Median age above state average.
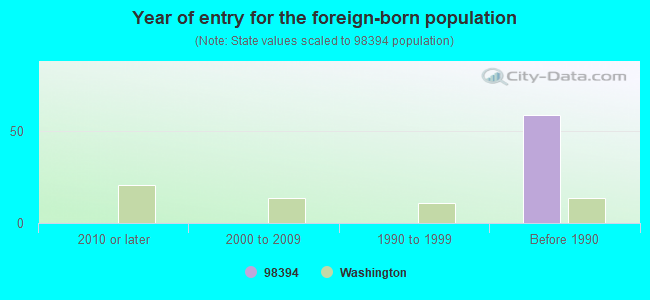
Foreign-born population percentage significantly below state average.
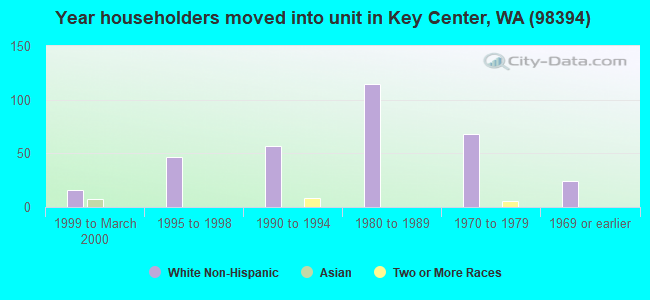
Length of stay since moving in significantly above state average.
Percentage of population with a bachelor's degree or higher below state average.
Estimated median house/condo value in 2022: $547,966
98394:
$547,966
Washington:
$569,500
Median resident age:
This zip code:
44.7 years
Washington median age:
38.4 years
Average household size:
This zip code:
2.3 people
Washington:
2.5 people
Averages for the 2020 tax year for zip code 98394, filed in 2021:
Average Adjusted Gross Income (AGI) in 2020: $92,978 (Individual Income Tax Returns)
Here:
$92,978
State:
$99,264
Salary/wage: $74,738 (reported on 73.7% of returns)
Here:
$74,738
State:
$80,347
(% of AGI for various income ranges: 1040.7% for AGIs below $25k, 3282.9% for AGIs $25k-50k, 5755.0% for AGIs $50k-75k, 8910.0% for AGIs $75k-100k, 16543.8% for AGIs $100k-200k, 75035.0% for AGIs over 200k)
Taxable interest for individuals: $1,184 (reported on 38.4% of returns)
This zip code:
$1,184
Washington:
$2,077
(% of AGI for various income ranges: 23.6% for AGIs below $25k, 22.1% for AGIs $25k-50k, 68.0% for AGIs $50k-75k, 108.6% for AGIs $75k-100k, 86.9% for AGIs $100k-200k, 645.0% for AGIs over 200k)
Ordinary dividends: $6,138 (reported on 26.3% of returns)
Here:
$6,138
State:
$10,013
(% of AGI for various income ranges: 72.1% for AGIs below $25k, 111.4% for AGIs $25k-50k, 79.0% for AGIs $50k-75k, 250.0% for AGIs $75k-100k, 341.5% for AGIs $100k-200k, 3205.0% for AGIs over 200k)
Net capital gain/loss in AGI: +$28,960 (reported on 25.3% of returns)
Here:
+$28,960
State:
+$40,092
(% of AGI for various income ranges: 43.6% for AGIs below $25k, 1.4% for AGIs $25k-50k, 254.3% for AGIs $75k-100k, 730.8% for AGIs $100k-200k, 30260.0% for AGIs over 200k)
Profit/loss from business: +$16,520 (reported on 15.2% of returns)
Here:
+$16,520
State:
+$18,312
(% of AGI for various income ranges: 249.3% for AGIs below $25k, 169.3% for AGIs $25k-50k, 506.0% for AGIs $50k-75k, 1066.2% for AGIs $100k-200k)
Taxable individual retirement arrangement distribution: $22,029 (reported on 14.1% of returns)
98394:
$22,029
Washington:
$24,221
(% of AGI for various income ranges: 107.9% for AGIs below $25k, 204.3% for AGIs $25k-50k, 552.0% for AGIs $50k-75k, 1611.5% for AGIs $100k-200k)
Total itemized deductions: $34,108 (reported on 13.1% of returns)
Here:
$34,108
State:
$39,068
(% of AGI for various income ranges: 1394.0% for AGIs $50k-75k, 1117.7% for AGIs $100k-200k, 7935.0% for AGIs over 200k)
Charity contributions: $7,400 (reported on 10.1% of returns)
Here:
$7,400
State:
$15,331
(% of AGI for various income ranges: 136.0% for AGIs $50k-75k, 233.1% for AGIs $100k-200k, 1505.0% for AGIs over 200k)
Taxes paid: $8,031 (reported on 13.1% of returns)
98394:
$8,031
State:
$7,774
(% of AGI for various income ranges: 339.0% for AGIs $50k-75k, 301.5% for AGIs $100k-200k, 1565.0% for AGIs over 200k)
Earned income credit: $1,757 (reported on 7.1% of returns)
Here:
$1,757
State:
$2,020
(% of AGI for various income ranges: 53.6% for AGIs below $25k, 34.3% for AGIs $25k-50k)
Percentage of individuals using paid preparers for their 2020 taxes: 90.9%
Here:
91%
State:
93%
(% for various income ranges: 83.3% for AGIs below $25k, 94.7% for AGIs $25k-50k, 92.9% for AGIs $50k-75k, 91.7% for AGIs $75k-100k, 95.5% for AGIs $100k-200k, 87.5% for AGIs over 200k)
Averages for the 2012 tax year for zip code 98394, filed in 2013:
Average Adjusted Gross Income (AGI) in 2012: $67,549 (Individual Income Tax Returns)
Here:
$67,549
State:
$69,533
Salary/wage: $56,576 (reported on 74.1% of returns)
Here:
$56,576
State:
$57,267
(% of AGI for various income ranges: 56.2% for AGIs below $25k, 71.8% for AGIs $25k-50k, 64.6% for AGIs $50k-75k, 73.4% for AGIs $75k-100k, 99.8% for AGIs $100k-200k)
Taxable interest for individuals: $1,032 (reported on 40.0% of returns)
This zip code:
$1,032
Washington:
$1,816
(% of AGI for various income ranges: 2.2% for AGIs below $25k, 1.1% for AGIs $25k-50k, 0.6% for AGIs $50k-75k, 0.2% for AGIs $75k-100k, 0.8% for AGIs $100k-200k)
Ordinary dividends: $5,371 (reported on 24.7% of returns)
Here:
$5,371
State:
$8,163
(% of AGI for various income ranges: 3.0% for AGIs below $25k, 1.5% for AGIs $25k-50k, 2.7% for AGIs $50k-75k, 1.1% for AGIs $75k-100k, 3.5% for AGIs $100k-200k)
Net capital gain/loss in AGI: +$8,000 (reported on 16.5% of returns)
Here:
+$8,000
State:
+$21,568
(% of AGI for various income ranges: 6.9% for AGIs $100k-200k)
Profit/loss from business: +$9,307 (reported on 17.6% of returns)
Here:
+$9,307
State:
+$16,521
(% of AGI for various income ranges: 10.5% for AGIs below $25k, 4.3% for AGIs $25k-50k, 5.5% for AGIs $50k-75k, 1.5% for AGIs $100k-200k)
Taxable individual retirement arrangement distribution: $18,660 (reported on 11.8% of returns)
98394:
$18,660
Washington:
$18,648
(% of AGI for various income ranges: 9.3% for AGIs below $25k, 5.8% for AGIs $50k-75k, 6.3% for AGIs $100k-200k)
Total itemized deductions: $22,003 (22% of AGI, reported on 43.5% of returns)
Here:
$22,003
State:
$23,872
Here:
21.7% of AGI
State:
18.2% of AGI
(% of AGI for various income ranges: 19.6% for AGIs below $25k, 14.9% for AGIs $25k-50k, 13.9% for AGIs $50k-75k, 13.4% for AGIs $75k-100k, 17.9% for AGIs $100k-200k, 8.3% for AGIs over 200k)
Charity contributions: $2,726 (reported on 31.8% of returns)
Here:
$2,726
State:
$4,465
(% of AGI for various income ranges: 0.8% for AGIs below $25k, 0.9% for AGIs $25k-50k, 1.8% for AGIs $50k-75k, 1.3% for AGIs $75k-100k, 1.5% for AGIs $100k-200k, 0.9% for AGIs over 200k)
Taxes paid: $6,239 (reported on 42.4% of returns)
98394:
$6,239
State:
$6,400
(% of AGI for various income ranges: 3.6% for AGIs below $25k, 3.9% for AGIs $25k-50k, 3.9% for AGIs $50k-75k, 3.4% for AGIs $75k-100k, 4.5% for AGIs $100k-200k, 3.6% for AGIs over 200k)
Earned income credit: $1,830 (reported on 11.8% of returns)
Here:
$1,830
State:
$2,073
(% of AGI for various income ranges: 4.0% for AGIs below $25k, 0.8% for AGIs $25k-50k)
Percentage of individuals using paid preparers for their 2012 taxes: 40.0%
Here:
40%
State:
43%
(% for various income ranges: 34.6% for AGIs below $25k, 36.8% for AGIs $25k-50k, 40.0% for AGIs $50k-75k, 40.0% for AGIs $75k-100k, 61.5% for AGIs $100k-200k)
Averages for the 2004 tax year for zip code 98394, filed in 2005:
Average Adjusted Gross Income (AGI) in 2004: $51,904 (Individual Income Tax Returns)
Here:
$51,904
State:
$54,331
Salary/wage: $45,280 (reported on 78.4% of returns)
Here:
$45,280
State:
$45,761
(% of AGI for various income ranges: 132.0% for AGIs below $10k, 64.3% for AGIs $10k-25k, 78.5% for AGIs $25k-50k, 71.3% for AGIs $50k-75k, 73.9% for AGIs $75k-100k, 60.0% for AGIs over 100k)
Taxable interest for individuals: $1,763 (reported on 50.5% of returns)
This zip code:
$1,763
Washington:
$2,110
(% of AGI for various income ranges: 14.8% for AGIs below $10k, 2.9% for AGIs $10k-25k, 0.7% for AGIs $25k-50k, 1.8% for AGIs $50k-75k, 1.2% for AGIs $75k-100k, 1.8% for AGIs over 100k)
Taxable dividends: $3,419 (reported on 28.3% of returns)
Here:
$3,419
State:
$5,879
(% of AGI for various income ranges: 4.6% for AGIs below $10k, 2.0% for AGIs $10k-25k, 0.7% for AGIs $25k-50k, 1.7% for AGIs $50k-75k, 2.5% for AGIs $75k-100k, 2.1% for AGIs over 100k)
Net capital gain/loss: +$7,657 (reported on 23.6% of returns)
Here:
+$7,657
State:
+$15,835
(% of AGI for various income ranges: -10.4% for AGIs below $10k, 0.8% for AGIs $10k-25k, 1.0% for AGIs $25k-50k, 0.8% for AGIs $50k-75k, 1.8% for AGIs $75k-100k, 7.4% for AGIs over 100k)
Profit/loss from business: +$11,264 (reported on 20.9% of returns)
Here:
+$11,264
State:
+$13,994
(% of AGI for various income ranges: 25.4% for AGIs below $10k, 7.6% for AGIs $10k-25k, 5.8% for AGIs $25k-50k, 2.7% for AGIs $50k-75k, 5.5% for AGIs $75k-100k, 3.6% for AGIs over 100k)
Total itemized deductions: $19,555 (25% of AGI, reported on 42.7% of returns)
Here:
$19,555
State:
$19,669
Here:
25.1% of AGI
State:
20.7% of AGI
(% of AGI for various income ranges: 19.4% for AGIs $10k-25k, 18.5% for AGIs $25k-50k, 18.2% for AGIs $50k-75k, 15.3% for AGIs $75k-100k, 14.0% for AGIs over 100k)
Charity contributions deductions: $2,462 (3% of AGI, reported on 35.8% of returns)
Here:
$2,462
State:
$3,569
Here:
2.9% of AGI
State:
3.5% of AGI
(% of AGI for various income ranges: 2.3% for AGIs $10k-25k, 1.5% for AGIs $25k-50k, 1.8% for AGIs $50k-75k, 1.4% for AGIs $75k-100k, 1.8% for AGIs over 100k)
Total tax: $8,478 (reported on 76.4% of returns)
98394:
$8,478
State:
$9,065
(% of AGI for various income ranges: 6.0% for AGIs below $10k, 4.9% for AGIs $10k-25k, 6.1% for AGIs $25k-50k, 8.6% for AGIs $50k-75k, 10.9% for AGIs $75k-100k, 19.4% for AGIs over 100k)
Earned income credit: $1,440 (reported on 11.7% of returns)
Here:
$1,440
State:
$1,607
Percentage of individuals using paid preparers for their 2004 taxes: 45.4%
Here:
45%
State:
49%
(% for various income ranges: 39.2% for AGIs below $10k, 42.3% for AGIs $10k-25k, 42.9% for AGIs $25k-50k, 41.5% for AGIs $50k-75k, 56.0% for AGIs $75k-100k, 65.6% for AGIs over 100k)
Size of family households: 143 2-persons, 94 3-persons, 74 4-persons, 27 5-persons
Size of nonfamily households: 169 1-person, 30 2-persons
59 married couples with children.
186 single-parent households (186 women).
95.7% of residents of 98394 zip code speak English at home.
3.9% of residents speak Asian or Pacific Island language at home (100% very well).
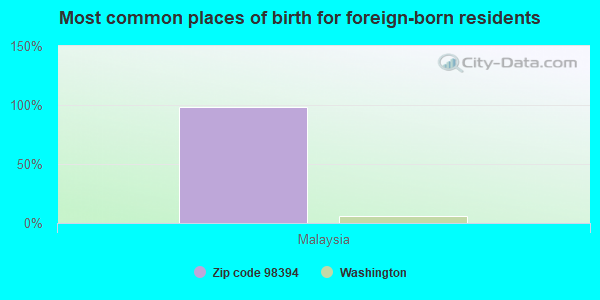
Foreign born population: 54 (4.3%) (100.0% of them are naturalized citizens)
This zip code:
4.3%
Whole state:
15.3%
98%Malaysia
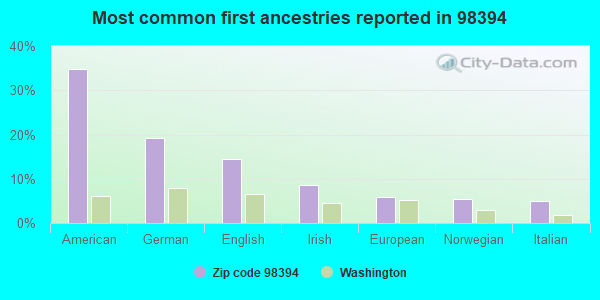
35%American
19%German
14%English
9%Irish
6%European
5%Norwegian
5%Italian
Year of entry for the foreign-born population
02010 or later
02000 to 2009
01990 to 1999
59Before 1990
Facilities with environmental interests located in this zip code:
7 MI E OF 144 KEY PENINSULA (S24 T22N R1W NE1/4 in VAUGHN, WA)
Conditionally Exempt Small Quantity Generators, less than 100 kg/month of hazardous waste (Resource Conservation and Recovery Act (tracking hazardous waste)) STATE MASTER (Washington State Department of Ecology's Facility/Site identification system) - HAZWASTE-WAD988506390, CESQG Business SIC classification: NONCLASSIFIABLE ESTABLISHMENTS Organizations: WA ECY (CONTACT/ HAZARDOUS WASTE)
, SHARI HARRIS DUNNING (CONTACT/OPERATOR)
Housing units lacking complete kitchen facilities: 6.2%
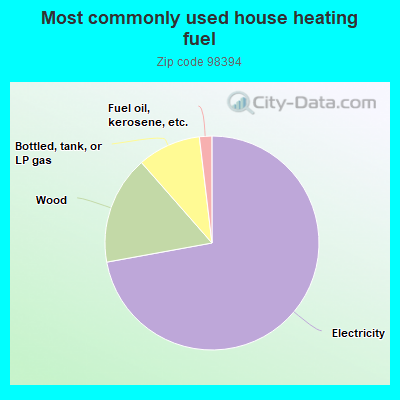
72.5%Electricity
16.5%Wood
9.6%Bottled, tank, or LP gas
1.9%Fuel oil, kerosene, etc.
Population in 1990: 804.
Place of birth for U.S.-born residents:
This state: 858
Northeast: 17
Midwest: 55
South: 152
West: 104
66% of the 98394 zip code residents lived in the same house 5 years ago. Out of people who lived in different houses, 92% lived in this county. Out of people who lived in different counties, 50% lived in Washington.
99% of the 98394 zip code residents lived in the same house 1 year ago. Out of people who lived in different houses, 142% moved from this county.
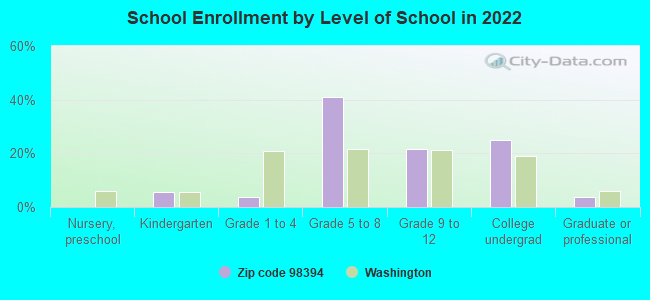
Private vs. public school enrollment:
Students in private schools in grades 1 to 8 (elementary and middle school):
Here:
0.0%
Washington:
12.4%
Students in private schools in grades 9 to 12 (high school):
Here:
0.0%
Washington:
9.2%
Students in private undergraduate colleges: 45
Here:
59.4%
Washington:
16.5%
Occupation by median earnings in the past 12 months ($)
71,808Sales and related occupations
67,048Legal occupations
57,799Construction and extraction occupations
Top industries in this zip code by the number of employees in 2005:
Construction: New Single-Family Housing Construction (except Operative Builders) (20-49 employees: 1 establishment)
Accommodation and Food Services: Full-Service Restaurants (10-19: 1)
Construction: Poured Concrete Foundation and Structure Contractors (5-9: 1, 1-4: 3)
Health Care and Social Assistance: Services for the Elderly and Persons with Disabilities (5-9: 1)
Construction: Site Preparation Contractors (5-9: 1)
Wholesale Trade: Construction and Mining (except Oil Well) Machinery and Equipment Merchant Wholesalers (5-9: 1)
Other Services (except Public Administration): Civic and Social Organizations (5-9: 1)
Other Services (except Public Administration): Professional Organizations (5-9: 1)
Construction: Electrical Contractors (5-9: 1)
Home Mortgage Disclosure Act Aggregated Statistics For Year 2009 (Based on 4 partial tracts)
A) FHA, FSA/RHS & VA Home Purchase Loans
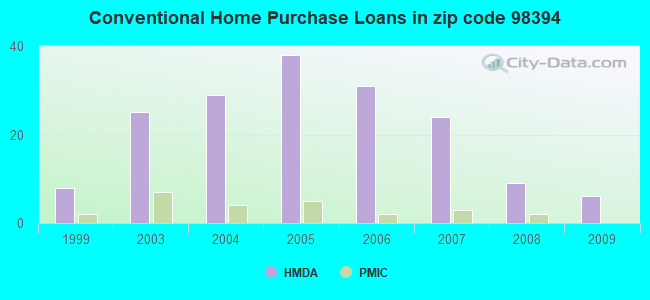
B) Conventional Home Purchase Loans
C) Refinancings
D) Home Improvement Loans
F) Non-occupant Loans on < 5 Family Dwellings (A B C & D)
G) Loans On Manufactured Home Dwelling (A B C & D)
Number
Average Value
Number
Average Value
Number
Average Value
Number
Average Value
Number
Average Value
Number
Average Value
LOANS ORIGINATED
7
$259,141
6
$222,488
49
$231,984
3
$105,077
6
$246,437
7
$171,050
APPLICATIONS APPROVED, NOT ACCEPTED
0
$0
1
$188,340
4
$248,192
0
$0
1
$238,210
1
$139,950
APPLICATIONS DENIED
0
$0
3
$271,773
22
$234,829
2
$77,400
2
$217,310
4
$178,178
APPLICATIONS WITHDRAWN
0
$0
1
$222,370
14
$270,479
1
$137,330
2
$223,850
1
$208,510
FILES CLOSED FOR INCOMPLETENESS
0
$0
0
$0
5
$219,768
0
$0
0
$0
0
$0
Aggregated Statistics For Year 2008 (Based on 4 partial tracts)
A) FHA, FSA/RHS & VA Home Purchase Loans
B) Conventional Home Purchase Loans
C) Refinancings
D) Home Improvement Loans
F) Non-occupant Loans on < 5 Family Dwellings (A B C & D)
G) Loans On Manufactured Home Dwelling (A B C & D)
Number
Average Value
Number
Average Value
Number
Average Value
Number
Average Value
Number
Average Value
Number
Average Value
LOANS ORIGINATED
6
$236,347
9
$243,713
41
$242,076
5
$169,660
6
$242,923
8
$173,249
APPLICATIONS APPROVED, NOT ACCEPTED
1
$123,310
2
$263,615
7
$285,910
1
$76,790
1
$322,130
1
$183,410
APPLICATIONS DENIED
2
$229,940
4
$261,223
24
$258,668
6
$153,590
3
$203,810
5
$177,550
APPLICATIONS WITHDRAWN
1
$299,470
1
$382,400
10
$261,622
1
$123,840
1
$218,450
2
$197,900
FILES CLOSED FOR INCOMPLETENESS
0
$0
1
$181,370
3
$274,780
1
$209,040
0
$0
1
$208,930
Aggregated Statistics For Year 2007 (Based on 4 partial tracts)
A) FHA, FSA/RHS & VA Home Purchase Loans
B) Conventional Home Purchase Loans
C) Refinancings
D) Home Improvement Loans
F) Non-occupant Loans on < 5 Family Dwellings (A B C & D)
G) Loans On Manufactured Home Dwelling (A B C & D)
Number
Average Value
Number
Average Value
Number
Average Value
Number
Average Value
Number
Average Value
Number
Average Value
LOANS ORIGINATED
4
$219,728
24
$254,541
49
$222,065
7
$117,157
12
$257,367
12
$168,210
APPLICATIONS APPROVED, NOT ACCEPTED
0
$0
5
$236,872
11
$235,833
1
$119,900
1
$236,870
2
$165,530
APPLICATIONS DENIED
2
$161,530
8
$255,115
33
$231,956
8
$103,528
4
$261,730
8
$144,490
APPLICATIONS WITHDRAWN
0
$0
2
$288,590
12
$221,872
2
$204,295
1
$238,150
2
$197,965
FILES CLOSED FOR INCOMPLETENESS
0
$0
1
$132,080
5
$333,736
0
$0
0
$0
0
$0
Aggregated Statistics For Year 2006 (Based on 4 partial tracts)
A) FHA, FSA/RHS & VA Home Purchase Loans
B) Conventional Home Purchase Loans
C) Refinancings
D) Home Improvement Loans
F) Non-occupant Loans on < 5 Family Dwellings (A B C & D)
G) Loans On Manufactured Home Dwelling (A B C & D)
Number
Average Value
Number
Average Value
Number
Average Value
Number
Average Value
Number
Average Value
Number
Average Value
LOANS ORIGINATED
4
$198,160
31
$176,624
47
$204,798
8
$105,490
12
$199,401
10
$146,972
APPLICATIONS APPROVED, NOT ACCEPTED
0
$0
4
$227,948
8
$233,200
2
$59,955
2
$199,535
2
$115,155
APPLICATIONS DENIED
1
$198,110
7
$187,079
33
$185,207
7
$94,913
2
$197,535
7
$148,239
APPLICATIONS WITHDRAWN
1
$74,960
3
$113,663
20
$218,288
2
$189,190
1
$269,610
2
$109,455
FILES CLOSED FOR INCOMPLETENESS
0
$0
1
$252,660
3
$268,157
0
$0
1
$151,980
0
$0
Aggregated Statistics For Year 2005 (Based on 4 partial tracts)
A) FHA, FSA/RHS & VA Home Purchase Loans
B) Conventional Home Purchase Loans
C) Refinancings
D) Home Improvement Loans
F) Non-occupant Loans on < 5 Family Dwellings (A B C & D)
G) Loans On Manufactured Home Dwelling (A B C & D)
Number
Average Value
Number
Average Value
Number
Average Value
Number
Average Value
Number
Average Value
Number
Average Value
LOANS ORIGINATED
4
$170,780
38
$180,985
63
$185,934
8
$79,200
12
$179,014
14
$127,274
APPLICATIONS APPROVED, NOT ACCEPTED
1
$138,980
6
$204,340
7
$145,437
1
$136,190
3
$196,467
3
$97,960
APPLICATIONS DENIED
1
$88,090
9
$157,890
31
$205,525
7
$70,836
3
$135,367
7
$124,144
APPLICATIONS WITHDRAWN
0
$0
7
$143,743
24
$168,940
3
$87,000
2
$249,785
4
$110,538
FILES CLOSED FOR INCOMPLETENESS
0
$0
2
$162,810
5
$162,158
0
$0
1
$142,300
1
$159,940
Aggregated Statistics For Year 2004 (Based on 4 partial tracts)
A) FHA, FSA/RHS & VA Home Purchase Loans
B) Conventional Home Purchase Loans
C) Refinancings
D) Home Improvement Loans
F) Non-occupant Loans on < 5 Family Dwellings (A B C & D)
G) Loans On Manufactured Home Dwelling (A B C & D)
Number
Average Value
Number
Average Value
Number
Average Value
Number
Average Value
Number
Average Value
Number
Average Value
LOANS ORIGINATED
5
$154,118
29
$189,795
49
$168,552
5
$74,648
8
$192,096
11
$119,758
APPLICATIONS APPROVED, NOT ACCEPTED
1
$73,190
4
$112,842
14
$146,057
1
$116,900
2
$108,225
4
$118,060
APPLICATIONS DENIED
0
$0
9
$181,849
37
$144,950
7
$60,120
3
$166,967
10
$97,325
APPLICATIONS WITHDRAWN
0
$0
3
$164,363
22
$153,147
1
$40,420
2
$125,720
4
$112,518
FILES CLOSED FOR INCOMPLETENESS
0
$0
1
$99,130
7
$159,347
0
$0
0
$0
1
$127,130
Aggregated Statistics For Year 2003 (Based on 4 partial tracts)
A) FHA, FSA/RHS & VA Home Purchase Loans
B) Conventional Home Purchase Loans
C) Refinancings
D) Home Improvement Loans
F) Non-occupant Loans on < 5 Family Dwellings (A B C & D)
Number
Average Value
Number
Average Value
Number
Average Value
Number
Average Value
Number
Average Value
LOANS ORIGINATED
6
$124,775
25
$147,112
90
$157,009
4
$51,268
10
$131,895
APPLICATIONS APPROVED, NOT ACCEPTED
1
$81,030
4
$165,408
10
$160,313
0
$0
1
$82,740
APPLICATIONS DENIED
1
$71,920
6
$136,863
25
$151,469
3
$61,933
1
$216,400
APPLICATIONS WITHDRAWN
0
$0
3
$141,317
21
$142,260
2
$48,250
1
$79,280
FILES CLOSED FOR INCOMPLETENESS
0
$0
1
$138,360
4
$140,378
0
$0
0
$0
Aggregated Statistics For Year 1999 (Based on 2 partial tracts)
A) FHA, FSA/RHS & VA Home Purchase Loans
B) Conventional Home Purchase Loans
C) Refinancings
D) Home Improvement Loans
F) Non-occupant Loans on < 5 Family Dwellings (A B C & D)


 Nearest zip codes: 98349, 98329, 98524, 98351, 98388, 98546.