Estimated zip code population in 2022: 1,745 Zip code population in 2010: 2,330 Zip code population in 2000: 2,684
Houses and condos: 587 Renter-occupied apartments: 179
% of renters here:
35%
State:
36%
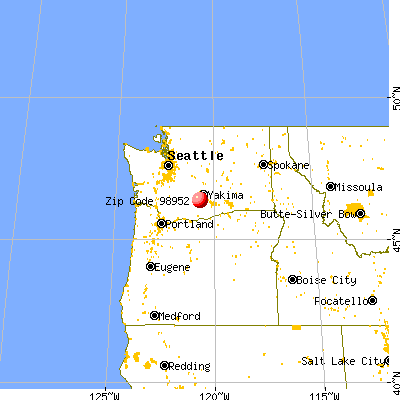
March 2022 cost of living index in zip code 98952: 84.3 (less than average, U.S. average is 100)
Land area: 205.9 sq. mi. Water area: 0.1 sq. mi.
Population density: 8 people per square mile
(very low).
OSM Map
General Map
Google Map
MSN Map
OSM Map
General Map
Google Map
MSN Map
OSM Map
General Map
Google Map
MSN Map
OSM Map
General Map
Google Map
MSN Map
Please wait while loading the map...
Real estate property taxes paid for housing units in 2022:
This zip code:
1.5% ($1,736)
Washington:
0.8% ($4,283)
Median real estate property taxes paid for housing units with mortgages in 2022: $1,869 (0.7%) Median real estate property taxes paid for housing units with no mortgage in 2022: $1,225 (1.2%)
Business Search- 14 Million verified businesses
Males: 937
(53.7%)
Females: 808
(46.3%)
For population 25 years and over in 98952:
High school or higher: 69.9%
Bachelor's degree or higher: 14.9%
Graduate or professional degree: 8.6%
Unemployed: 13.9%
Mean travel time to work (commute): 16.1 minutes
For population 15 years and over in 98952:
Never married: 49.4%
Now married: 36.6%
Separated: 3.1%
Widowed: 3.1%
Divorced: 7.7%
Zip code 98952 compared to state average:
Median household income below state average.
Median house value significantly below state average.
Unemployed percentage significantly above state average.
Black race population percentage significantly below state average.
Median age below state average.
Foreign-born population percentage below state average.
Length of stay since moving in significantly above state average.
Percentage of population with a bachelor's degree or higher significantly below state average.
Averages for the 2020 tax year for zip code 98952, filed in 2021:
Average Adjusted Gross Income (AGI) in 2020: $33,736 (Individual Income Tax Returns)
Here:
$33,736
State:
$99,264
Salary/wage: $34,378 (reported on 77.9% of returns)
Here:
$34,378
State:
$80,347
(% of AGI for various income ranges: 1002.4% for AGIs below $25k, 3538.6% for AGIs $25k-50k, 5988.9% for AGIs $50k-75k, 6910.0% for AGIs $75k-100k, 16135.0% for AGIs $100k-200k)
Taxable interest for individuals: $100 (reported on 9.1% of returns)
This zip code:
$100
Washington:
$2,077
(% of AGI for various income ranges: 1.2% for AGIs below $25k, 4.4% for AGIs $50k-75k)
Profit/loss from business: +$1,150 (reported on 2.6% of returns)
Here:
+$1,150
State:
+$18,312
(% of AGI for various income ranges: 9.2% for AGIs below $25k)
Earned income credit: $2,371 (reported on 27.3% of returns)
Here:
$2,371
State:
$2,020
(% of AGI for various income ranges: 103.6% for AGIs below $25k, 113.8% for AGIs $25k-50k)
Percentage of individuals using paid preparers for their 2020 taxes: 93.5%
Here:
94%
State:
93%
(% for various income ranges: 94.1% for AGIs below $25k, 96.0% for AGIs $25k-50k, 90.9% for AGIs $50k-75k, 100.0% for AGIs $75k-100k, 75.0% for AGIs $100k-200k)
Averages for the 2012 tax year for zip code 98952, filed in 2013:
Average Adjusted Gross Income (AGI) in 2012: $29,771 (Individual Income Tax Returns)
Here:
$29,771
State:
$69,533
Salary/wage: $30,514 (reported on 77.1% of returns)
Here:
$30,514
State:
$57,267
(% of AGI for various income ranges: 78.4% for AGIs below $25k, 86.8% for AGIs $25k-50k, 85.5% for AGIs $50k-75k, 80.7% for AGIs $75k-100k, 54.4% for AGIs $100k-200k)
Taxable interest for individuals: $314 (reported on 8.4% of returns)
This zip code:
$314
Washington:
$1,816
Net capital gain/loss in AGI: +$1,850 (reported on 2.4% of returns)
Here:
+$1,850
State:
+$21,568
Profit/loss from business: +$1,833 (reported on 3.6% of returns)
Here:
+$1,833
State:
+$16,521
Total itemized deductions: $21,450 (18% of AGI, reported on 2.4% of returns)
Here:
$21,450
State:
$23,872
Here:
18.4% of AGI
State:
18.2% of AGI
(% of AGI for various income ranges: 4.8% for AGIs $25k-50k)
Taxes paid: $2,700 (reported on 3.6% of returns)
98952:
$2,700
State:
$6,400
Earned income credit: $2,262 (reported on 28.9% of returns)
Here:
$2,262
State:
$2,073
(% of AGI for various income ranges: 8.5% for AGIs below $25k, 2.1% for AGIs $25k-50k)
Percentage of individuals using paid preparers for their 2012 taxes: 62.7%
Here:
63%
State:
43%
(% for various income ranges: 62.8% for AGIs below $25k, 64.0% for AGIs $25k-50k, 77.8% for AGIs $50k-75k, 66.7% for AGIs $100k-200k)
Averages for the 2004 tax year for zip code 98952, filed in 2005:
Average Adjusted Gross Income (AGI) in 2004: $27,950 (Individual Income Tax Returns)
Here:
$27,950
State:
$54,331
Salary/wage: $27,024 (reported on 91.7% of returns)
Here:
$27,024
State:
$45,761
(% of AGI for various income ranges: 108.7% for AGIs below $10k, 89.6% for AGIs $10k-25k, 93.8% for AGIs $25k-50k, 88.7% for AGIs $50k-75k, 150.1% for AGIs $75k-100k)
Taxable interest for individuals: $380 (reported on 14.7% of returns)
This zip code:
$380
Washington:
$2,110
(% of AGI for various income ranges: 0.6% for AGIs below $10k, 0.2% for AGIs $10k-25k, 0.2% for AGIs $25k-50k, 0.2% for AGIs $50k-75k)
Taxable dividends: $276 (reported on 3.9% of returns)
Here:
$276
State:
$5,879
Net capital gain/loss: +$95 (reported on 2.8% of returns)
Here:
+$95
State:
+$15,835
Profit/loss from business: +$1,286 (reported on 4.7% of returns)
Here:
+$1,286
State:
+$13,994
Total itemized deductions: $14,677 (22% of AGI, reported on 4.2% of returns)
Here:
$14,677
State:
$19,669
Here:
22.2% of AGI
State:
20.7% of AGI
Charity contributions deductions: $1,000 (1% of AGI, reported on 2.0% of returns)
Here:
$1,000
State:
$3,569
Here:
1.4% of AGI
State:
3.5% of AGI
Total tax: $3,870 (reported on 50.2% of returns)
98952:
$3,870
State:
$9,065
(% of AGI for various income ranges: 1.9% for AGIs below $10k, 2.3% for AGIs $10k-25k, 4.9% for AGIs $25k-50k, 7.9% for AGIs $50k-75k, 9.5% for AGIs $75k-100k, 22.3% for AGIs over 100k)
Earned income credit: $1,697 (reported on 35.8% of returns)
Here:
$1,697
State:
$1,607
Percentage of individuals using paid preparers for their 2004 taxes: 70.3%
Here:
70%
State:
49%
(% for various income ranges: 65.9% for AGIs below $10k, 72.3% for AGIs $10k-25k, 72.3% for AGIs $25k-50k, 66.7% for AGIs $50k-75k, 61.9% for AGIs $75k-100k, 100.0% for AGIs over 100k)
Household received Food Stamps/SNAP in the past 12 months: 247 Household did not receive Food Stamps/SNAP in the past 12 months: 264
Women who had a birth in the past 12 months: 32 (9 now married, 21 unmarried) Women who did not have a birth in the past 12 months: 338 (65 now married, 276 unmarried)
Housing units in zip code 98952 with a mortgage: 81 Median monthly owner costs for units with a mortgage: $1,443 Median monthly owner costs for units without a mortgage: $222
Residents with income below the poverty level in 2022:
This zip code:
33.2%
Whole state:
10.0%
Residents with income below 50% of the poverty level in 2022:
This zip code:
14.8%
Whole state:
4.6%
Median number of rooms in houses and condos:
Here:
5.8
State:
6.5
Median number of rooms in apartments:
Here:
5.4
State:
3.9
Notable locations in this zip code not listed on our city pages
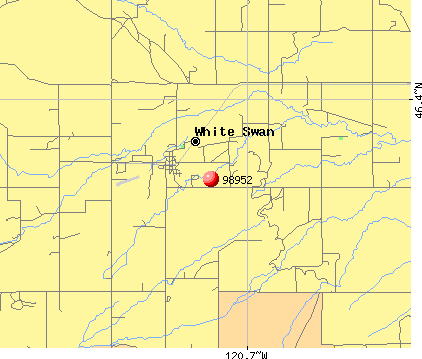
Notable locations in zip code 98952: White Swan Substation (A), Mill Creek Guard Station (B), Wild Horse Corral (C), White Swan Ambulance (D), Yakima County Fire District 5 White Swan Station 1 (E). Display/hide their locations on the map
Creeks: Patemas Creek (A), Rattlesnake Creek (B), Wahtum Creek (C), Hunt Creek (D), Mill Creek (E), Simcoe Creek (F), South Medicine Creek (G), Agency Creek (H). Display/hide their locations on the map
62 married couples with children.
214 single-parent households (100 men, 114 women).
82.6% of residents of 98952 zip code speak English at home.
15.8% of residents speak Spanish at home (27% very well, 19% well, 13% not well, 41% not at all).
0.4% of residents speak other Indo-European language at home (100% very well).
1.6% of residents speak other language at home (100% very well).
Foreign born population: 157 (9.0%) (10.0% of them are naturalized citizens)
This zip code:
9.0%
Whole state:
15.3%
99%Honduras
1%German
1%Canadian
1%Scottish
0%Greek
0%Irish
0%French
0%Swedish
Year of entry for the foreign-born population
802010 or later
122000 to 2009
321990 to 1999
38Before 1990
Housing units lacking complete plumbing facilities: 10.3% Housing units lacking complete kitchen facilities: 6.5%
67.2%Electricity
27.6%Wood
3.3%Bottled, tank, or LP gas
2.2%Solar energy
Population in 1990: 1,941. Population change in the 1990s: +743 (+38.3%).
Place of birth for U.S.-born residents:
This state: 1,367
Northeast: 6
Midwest: 11
South: 11
West: 185
55% of the 98952 zip code residents lived in the same house 5 years ago. Out of people who lived in different houses, 64% lived in this county. Out of people who lived in different counties, 50% lived in Washington.
97% of the 98952 zip code residents lived in the same house 1 year ago. Out of people who lived in different houses, 118% moved from this county.
Private vs. public school enrollment:
Students in private schools in grades 1 to 8 (elementary and middle school): 22
Here:
9.2%
Washington:
12.4%
Students in private schools in grades 9 to 12 (high school): 13
Here:
13.6%
Washington:
9.2%
Students in private undergraduate colleges:
Here:
0.0%
Washington:
16.5%
Occupation by median earnings in the past 12 months ($)
63,414Construction and extraction occupations
58,485Education, training, and library occupations
50,370Building and grounds cleaning and maintenance occupations
49,323Management occupations
47,533Office and administrative support occupations
33,509Production occupations
Top industries in this zip code by the number of employees in 2005:
Accommodation and Food Services: Limited-Service Restaurants (20-49 employees: 1 establishment)
Educational Services: Junior Colleges (10-19: 1)
Health Care and Social Assistance: Other Individual and Family Services (5-9: 1)
Wholesale Trade: Other Chemical and Allied Products Merchant Wholesalers (5-9: 1)
Other Services (except Public Administration): Religious Organizations (1-4: 1)
Wholesale Trade: Refrigeration Equipment and Supplies Merchant Wholesalers (1-4: 1)
People in group quarters in 2010:
3 people in group homes intended for adults
People in group quarters in 2000:
178 people in job corps and vocational training facilities
Fatal accident statistics in 2014:
Fatal accident count: 1
Vehicles involved in fatal accidents: 1
Fatal accidents caused by drunken drivers: 1
Fatalities: 1
Persons involved in fatal accidents: 1
Pedestrians involved in fatal accidents: 0
Fatal accident statistics in 2013:
Fatal accident count: 1
Vehicles involved in fatal accidents: 2
Fatal accidents caused by drunken drivers: 1
Fatalities: 1
Persons involved in fatal accidents: 1
Pedestrians involved in fatal accidents: 0
Home Mortgage Disclosure Act Aggregated Statistics For Year 2009 (Based on 2 partial tracts)
A) FHA, FSA/RHS & VA Home Purchase Loans
B) Conventional Home Purchase Loans
C) Refinancings
D) Home Improvement Loans
F) Non-occupant Loans on < 5 Family Dwellings (A B C & D)
G) Loans On Manufactured Home Dwelling (A B C & D)
Number
Average Value
Number
Average Value
Number
Average Value
Number
Average Value
Number
Average Value
Number
Average Value
LOANS ORIGINATED
4
$117,465
3
$146,370
15
$139,974
2
$104,550
0
$0
3
$130,517
APPLICATIONS APPROVED, NOT ACCEPTED
1
$77,080
0
$0
5
$160,310
1
$84,050
0
$0
0
$0
APPLICATIONS DENIED
1
$63,140
3
$122,180
14
$155,712
2
$53,505
2
$92,250
3
$101,543
APPLICATIONS WITHDRAWN
1
$130,790
1
$150,880
8
$151,802
0
$0
0
$0
2
$115,620
FILES CLOSED FOR INCOMPLETENESS
0
$0
0
$0
2
$209,715
0
$0
0
$0
0
$0
Aggregated Statistics For Year 2008 (Based on 2 partial tracts)
A) FHA, FSA/RHS & VA Home Purchase Loans
B) Conventional Home Purchase Loans
C) Refinancings
D) Home Improvement Loans
F) Non-occupant Loans on < 5 Family Dwellings (A B C & D)
G) Loans On Manufactured Home Dwelling (A B C & D)
Number
Average Value
Number
Average Value
Number
Average Value
Number
Average Value
Number
Average Value
Number
Average Value
LOANS ORIGINATED
3
$152,657
4
$150,572
11
$127,286
4
$42,640
1
$179,990
4
$127,715
APPLICATIONS APPROVED, NOT ACCEPTED
0
$0
0
$0
3
$187,233
0
$0
0
$0
1
$177,940
APPLICATIONS DENIED
2
$110,085
3
$192,427
25
$133,939
6
$74,210
0
$0
5
$95,038
APPLICATIONS WITHDRAWN
0
$0
0
$0
9
$132,886
1
$34,850
1
$84,050
2
$88,765
FILES CLOSED FOR INCOMPLETENESS
0
$0
0
$0
2
$137,145
0
$0
0
$0
0
$0
Aggregated Statistics For Year 2007 (Based on 2 partial tracts)
A) FHA, FSA/RHS & VA Home Purchase Loans
B) Conventional Home Purchase Loans
C) Refinancings
D) Home Improvement Loans
F) Non-occupant Loans on < 5 Family Dwellings (A B C & D)
G) Loans On Manufactured Home Dwelling (A B C & D)
Number
Average Value
Number
Average Value
Number
Average Value
Number
Average Value
Number
Average Value
Number
Average Value
LOANS ORIGINATED
3
$140,903
16
$131,405
13
$113,696
5
$35,260
4
$94,608
6
$118,490
APPLICATIONS APPROVED, NOT ACCEPTED
0
$0
4
$188,190
4
$107,010
0
$0
0
$0
2
$168,920
APPLICATIONS DENIED
2
$127,510
5
$114,964
33
$107,594
5
$68,060
4
$81,180
9
$96,897
APPLICATIONS WITHDRAWN
0
$0
2
$145,960
8
$157,748
2
$31,775
1
$181,630
0
$0
FILES CLOSED FOR INCOMPLETENESS
0
$0
0
$0
3
$160,310
0
$0
0
$0
0
$0
Aggregated Statistics For Year 2006 (Based on 2 partial tracts)
A) FHA, FSA/RHS & VA Home Purchase Loans
B) Conventional Home Purchase Loans
C) Refinancings
D) Home Improvement Loans
F) Non-occupant Loans on < 5 Family Dwellings (A B C & D)
G) Loans On Manufactured Home Dwelling (A B C & D)
Number
Average Value
Number
Average Value
Number
Average Value
Number
Average Value
Number
Average Value
Number
Average Value
LOANS ORIGINATED
2
$108,445
13
$95,908
16
$124,845
4
$49,098
1
$137,760
5
$82,574
APPLICATIONS APPROVED, NOT ACCEPTED
0
$0
2
$95,735
5
$97,088
0
$0
0
$0
1
$59,040
APPLICATIONS DENIED
0
$0
7
$112,399
32
$106,728
9
$46,512
1
$135,710
11
$96,611
APPLICATIONS WITHDRAWN
0
$0
3
$137,487
14
$122,004
1
$46,330
2
$116,440
2
$99,220
FILES CLOSED FOR INCOMPLETENESS
1
$86,510
1
$271,420
5
$119,474
1
$76,670
0
$0
1
$129,970
Aggregated Statistics For Year 2005 (Based on 2 partial tracts)
A) FHA, FSA/RHS & VA Home Purchase Loans
B) Conventional Home Purchase Loans
C) Refinancings
D) Home Improvement Loans
F) Non-occupant Loans on < 5 Family Dwellings (A B C & D)
G) Loans On Manufactured Home Dwelling (A B C & D)
Number
Average Value
Number
Average Value
Number
Average Value
Number
Average Value
Number
Average Value
Number
Average Value
LOANS ORIGINATED
3
$111,520
13
$85,280
14
$91,401
2
$53,710
2
$104,550
7
$93,304
APPLICATIONS APPROVED, NOT ACCEPTED
1
$159,080
3
$123,000
7
$108,884
0
$0
1
$52,480
1
$123,820
APPLICATIONS DENIED
2
$79,950
8
$84,665
36
$106,156
6
$60,543
4
$106,088
11
$100,785
APPLICATIONS WITHDRAWN
0
$0
3
$89,380
17
$142,921
1
$100,860
0
$0
5
$120,458
FILES CLOSED FOR INCOMPLETENESS
0
$0
1
$94,300
1
$99,220
0
$0
0
$0
0
$0
Aggregated Statistics For Year 2004 (Based on 2 partial tracts)
A) FHA, FSA/RHS & VA Home Purchase Loans
B) Conventional Home Purchase Loans
C) Refinancings
D) Home Improvement Loans
F) Non-occupant Loans on < 5 Family Dwellings (A B C & D)
G) Loans On Manufactured Home Dwelling (A B C & D)
Number
Average Value
Number
Average Value
Number
Average Value
Number
Average Value
Number
Average Value
Number
Average Value
LOANS ORIGINATED
2
$129,560
15
$100,669
21
$97,150
5
$32,636
2
$84,665
5
$101,598
APPLICATIONS APPROVED, NOT ACCEPTED
0
$0
4
$90,508
4
$83,128
0
$0
0
$0
1
$81,180
APPLICATIONS DENIED
0
$0
9
$79,494
25
$96,793
5
$40,672
2
$59,245
7
$119,896
APPLICATIONS WITHDRAWN
1
$135,300
4
$75,235
14
$131,024
1
$125,050
2
$82,205
3
$116,577
FILES CLOSED FOR INCOMPLETENESS
0
$0
0
$0
3
$96,487
0
$0
0
$0
2
$115,005
Aggregated Statistics For Year 2003 (Based on 2 partial tracts)
A) FHA, FSA/RHS & VA Home Purchase Loans
B) Conventional Home Purchase Loans
C) Refinancings
D) Home Improvement Loans
F) Non-occupant Loans on < 5 Family Dwellings (A B C & D)
Number
Average Value
Number
Average Value
Number
Average Value
Number
Average Value
Number
Average Value
LOANS ORIGINATED
1
$129,560
11
$98,027
43
$106,419
1
$32,800
1
$75,030
APPLICATIONS APPROVED, NOT ACCEPTED
1
$122,180
4
$71,545
7
$111,286
1
$30,750
0
$0
APPLICATIONS DENIED
1
$77,900
10
$98,154
28
$100,728
2
$18,450
1
$41,410
APPLICATIONS WITHDRAWN
0
$0
1
$106,600
12
$123,410
0
$0
0
$0
FILES CLOSED FOR INCOMPLETENESS
0
$0
0
$0
2
$108,855
0
$0
0
$0
Aggregated Statistics For Year 2002 (Based on 2 partial tracts)
A) FHA, FSA/RHS & VA Home Purchase Loans
B) Conventional Home Purchase Loans
C) Refinancings
D) Home Improvement Loans
F) Non-occupant Loans on < 5 Family Dwellings (A B C & D)
Number
Average Value
Number
Average Value
Number
Average Value
Number
Average Value
Number
Average Value
LOANS ORIGINATED
3
$108,103
8
$88,252
26
$97,801
2
$21,935
2
$53,095
APPLICATIONS APPROVED, NOT ACCEPTED
1
$129,970
6
$120,882
7
$118,959
0
$0
0
$0
APPLICATIONS DENIED
2
$101,680
6
$79,882
23
$107,687
3
$35,670
2
$78,720
APPLICATIONS WITHDRAWN
0
$0
2
$115,825
12
$97,956
0
$0
0
$0
FILES CLOSED FOR INCOMPLETENESS
0
$0
0
$0
1
$127,100
0
$0
0
$0
Aggregated Statistics For Year 2001 (Based on 2 partial tracts)
A) FHA, FSA/RHS & VA Home Purchase Loans
B) Conventional Home Purchase Loans
C) Refinancings
D) Home Improvement Loans
F) Non-occupant Loans on < 5 Family Dwellings (A B C & D)
Number
Average Value
Number
Average Value
Number
Average Value
Number
Average Value
Number
Average Value
LOANS ORIGINATED
3
$87,603
12
$89,004
19
$88,128
3
$23,917
2
$69,700
APPLICATIONS APPROVED, NOT ACCEPTED
0
$0
3
$92,797
6
$74,073
1
$14,350
1
$68,060
APPLICATIONS DENIED
0
$0
10
$71,627
24
$81,624
5
$43,214
0
$0
APPLICATIONS WITHDRAWN
0
$0
5
$88,478
13
$87,992
0
$0
0
$0
FILES CLOSED FOR INCOMPLETENESS
0
$0
0
$0
2
$112,750
0
$0
0
$0
Aggregated Statistics For Year 2000 (Based on 2 partial tracts)
A) FHA, FSA/RHS & VA Home Purchase Loans
B) Conventional Home Purchase Loans
C) Refinancings
D) Home Improvement Loans
F) Non-occupant Loans on < 5 Family Dwellings (A B C & D)
Number
Average Value
Number
Average Value
Number
Average Value
Number
Average Value
Number
Average Value
LOANS ORIGINATED
2
$95,120
15
$77,353
13
$81,811
2
$44,895
2
$59,245
APPLICATIONS APPROVED, NOT ACCEPTED
0
$0
4
$92,762
2
$84,665
0
$0
0
$0
APPLICATIONS DENIED
1
$128,740
15
$98,892
15
$78,747
1
$76,260
2
$68,060
APPLICATIONS WITHDRAWN
1
$62,320
2
$51,250
4
$48,892
2
$38,745
0
$0
FILES CLOSED FOR INCOMPLETENESS
0
$0
1
$48,380
5
$92,086
0
$0
0
$0
Aggregated Statistics For Year 1999 (Based on 1 partial tract)
A) FHA, FSA/RHS & VA Home Purchase Loans
B) Conventional Home Purchase Loans
C) Refinancings
D) Home Improvement Loans
F) Non-occupant Loans on < 5 Family Dwellings (A B C & D)
Detailed PMIC statistics for the following Tracts:0026.00
2002 - 2018 National Fire Incident Reporting System (NFIRS) incidents
Based on the data from the years 2002 - 2018 the average number of fire incidents per year is 48. The highest number of reported fire incidents - 80 took place in 2009, and the least - 32 in 2016. The data has a declining trend.
When looking into fire subcategories, the most reports belonged to: Outside Fires (66.0%), and Structure Fires (21.2%).
Fire incident types reported to NFIRS in Zip Code 98952


 Nearest zip codes: 98933, 98908, 98951, 98923, 98903, 98939.


 Based on the data from the years 2002 - 2018 the average number of fire incidents per year is 48. The highest number of reported fire incidents - 80 took place in 2009, and the least - 32 in 2016. The data has a declining trend.
 When looking into fire subcategories, the most reports belonged to: Outside Fires (66.0%), and Structure Fires (21.2%).