Estimated zip code population in 2022: 14,063 Zip code population in 2010: 11,946 Zip code population in 2000: 9,163
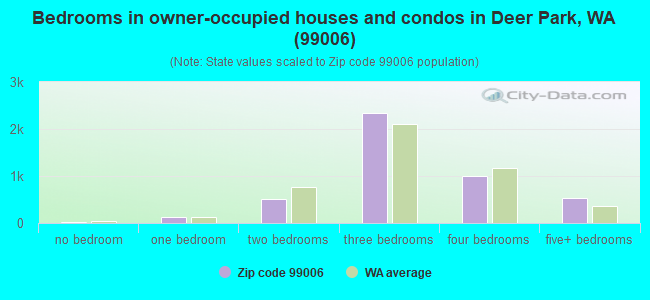
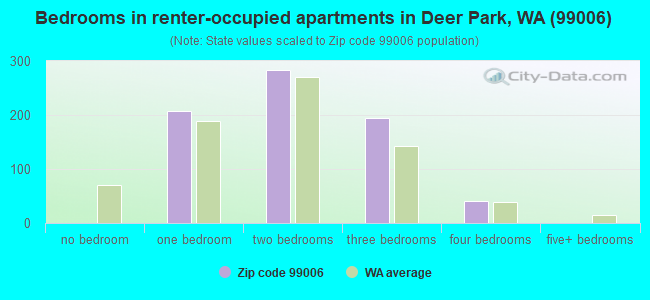
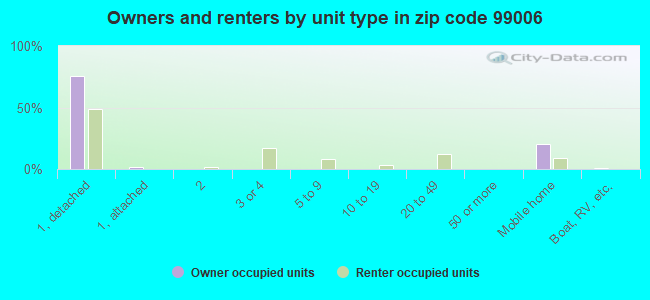
Houses and condos: 5,464 Renter-occupied apartments: 735
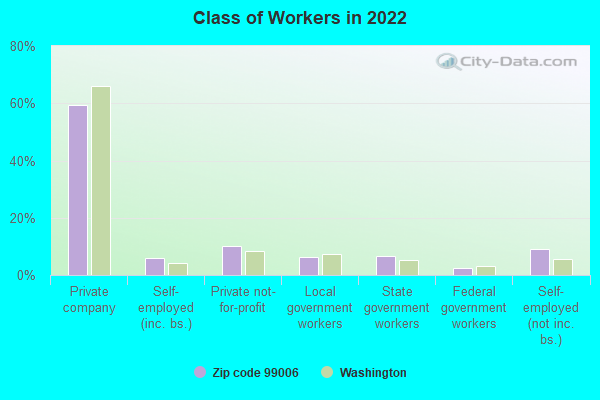
% of renters here:
14%
State:
36%
March 2022 cost of living index in zip code 99006: 89.3 (less than average, U.S. average is 100)
Land area: 183.6 sq. mi. Water area: 0.5 sq. mi.
Population density: 77 people per square mile
(very low).
OSM Map
General Map
Google Map
MSN Map
OSM Map
General Map
Google Map
MSN Map
OSM Map
General Map
Google Map
MSN Map
OSM Map
General Map
Google Map
MSN Map
Please wait while loading the map...
Real estate property taxes paid for housing units in 2022:
This zip code:
0.7% ($2,757)
Washington:
0.8% ($4,283)
Median real estate property taxes paid for housing units with mortgages in 2022: $2,762 (0.7%) Median real estate property taxes paid for housing units with no mortgage in 2022: $2,759 (0.8%)
Business Search- 14 Million verified businesses
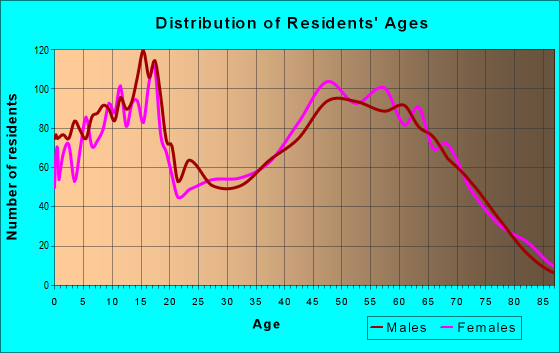
Males: 6,626
(47.1%)
Females: 7,436
(52.9%)
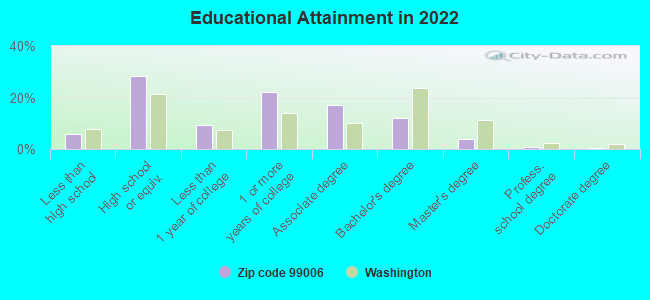
For population 25 years and over in 99006:
High school or higher: 92.4%
Bachelor's degree or higher: 16.9%
Graduate or professional degree: 5.0%
Unemployed: 5.8%
Mean travel time to work (commute): 31.5 minutes
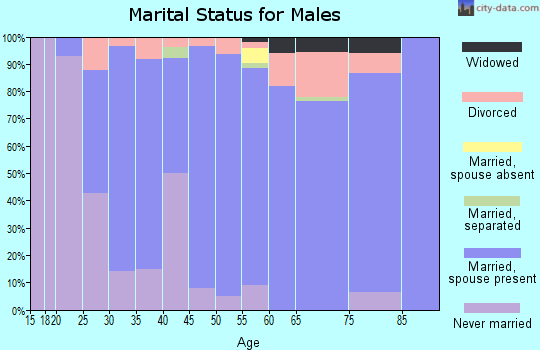
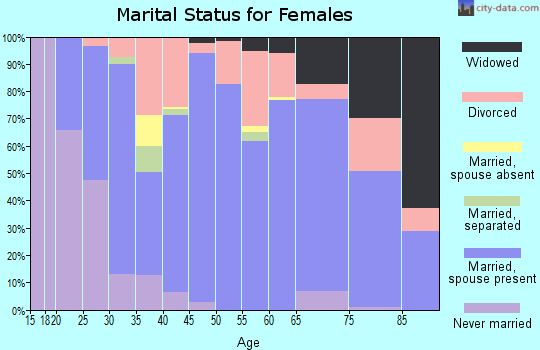
For population 15 years and over in 99006:
Never married: 19.5%
Now married: 62.2%
Separated: 1.1%
Widowed: 5.2%
Divorced: 11.9%
Zip code 99006 compared to state average:
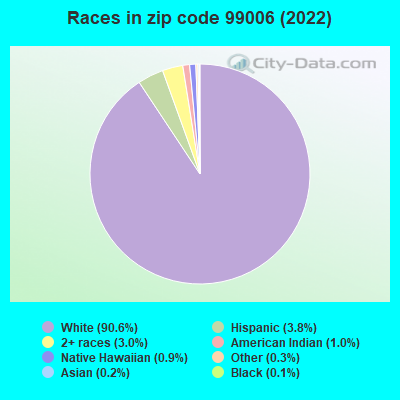
Black race population percentage significantly below state average.
Hispanic race population percentage significantly below state average.
Median age above state average.
Foreign-born population percentage significantly below state average.
Renting percentage significantly below state average.
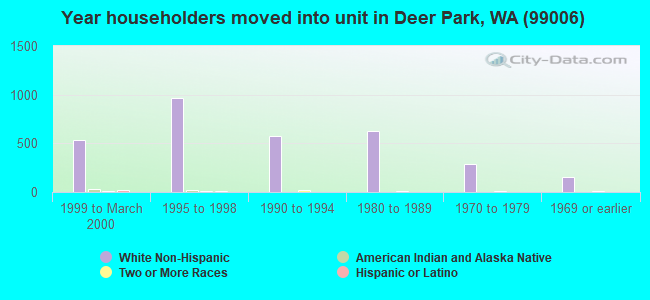
Length of stay since moving in significantly above state average.
Number of college students significantly below state average.
Percentage of population with a bachelor's degree or higher significantly below state average.
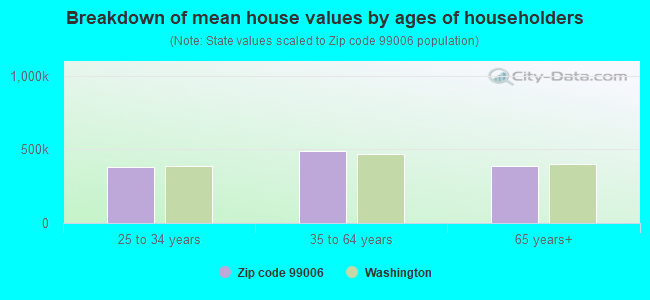
Estimated median house/condo value in 2022: $398,193
99006:
$398,193
Washington:
$569,500
According to our research of Washington and other state lists, there were 9 registered sex offenders living in 99006 zip code as of May 15, 2024. The ratio of all residents to sex offenders in zip code 99006 is 1,370 to 1. The ratio of registered sex offenders to all residents in this zip code is near the state average.
Median resident age:
This zip code:
43.6 years
Washington median age:
38.4 years
Average household size:
This zip code:
2.7 people
Washington:
2.5 people
Averages for the 2020 tax year for zip code 99006, filed in 2021:
Average Adjusted Gross Income (AGI) in 2020: $69,423 (Individual Income Tax Returns)
Here:
$69,423
State:
$99,264
Salary/wage: $57,433 (reported on 77.0% of returns)
Here:
$57,433
State:
$80,347
(% of AGI for various income ranges: 1129.8% for AGIs below $25k, 3220.7% for AGIs $25k-50k, 5971.5% for AGIs $50k-75k, 8947.3% for AGIs $75k-100k, 16158.6% for AGIs $100k-200k, 51015.7% for AGIs over 200k)
Taxable interest for individuals: $1,377 (reported on 38.4% of returns)
This zip code:
$1,377
Washington:
$2,077
(% of AGI for various income ranges: 23.8% for AGIs below $25k, 22.4% for AGIs $25k-50k, 51.1% for AGIs $50k-75k, 69.8% for AGIs $75k-100k, 174.5% for AGIs $100k-200k, 1357.1% for AGIs over 200k)
Ordinary dividends: $3,959 (reported on 15.6% of returns)
Here:
$3,959
State:
$10,013
(% of AGI for various income ranges: 19.1% for AGIs below $25k, 34.8% for AGIs $25k-50k, 57.5% for AGIs $50k-75k, 83.3% for AGIs $75k-100k, 215.9% for AGIs $100k-200k, 1482.9% for AGIs over 200k)
Net capital gain/loss in AGI: +$16,754 (reported on 16.1% of returns)
Here:
+$16,754
State:
+$40,092
(% of AGI for various income ranges: 15.1% for AGIs below $25k, 31.3% for AGIs $25k-50k, 109.2% for AGIs $50k-75k, 205.9% for AGIs $75k-100k, 821.4% for AGIs $100k-200k, 13468.6% for AGIs over 200k)
Profit/loss from business: +$12,891 (reported on 13.9% of returns)
Here:
+$12,891
State:
+$18,312
(% of AGI for various income ranges: 97.3% for AGIs below $25k, 162.1% for AGIs $25k-50k, 283.9% for AGIs $50k-75k, 297.5% for AGIs $75k-100k, 505.3% for AGIs $100k-200k, 1960.0% for AGIs over 200k)
Taxable individual retirement arrangement distribution: $16,990 (reported on 11.2% of returns)
99006:
$16,990
Washington:
$24,221
(% of AGI for various income ranges: 74.5% for AGIs below $25k, 134.0% for AGIs $25k-50k, 226.5% for AGIs $50k-75k, 323.5% for AGIs $75k-100k, 788.6% for AGIs $100k-200k, 1690.0% for AGIs over 200k)
Total itemized deductions: $33,656 (reported on 5.7% of returns)
Here:
$33,656
State:
$39,068
(% of AGI for various income ranges: 123.2% for AGIs $25k-50k, 239.9% for AGIs $50k-75k, 262.9% for AGIs $75k-100k, 681.6% for AGIs $100k-200k, 4564.3% for AGIs over 200k)
Charity contributions: $12,039 (reported on 4.4% of returns)
Here:
$12,039
State:
$15,331
(% of AGI for various income ranges: 7.2% for AGIs $25k-50k, 35.4% for AGIs $50k-75k, 61.2% for AGIs $75k-100k, 181.6% for AGIs $100k-200k, 2221.4% for AGIs over 200k)
Taxes paid: $6,433 (reported on 5.7% of returns)
99006:
$6,433
State:
$7,774
(% of AGI for various income ranges: 11.8% for AGIs $25k-50k, 40.7% for AGIs $50k-75k, 61.2% for AGIs $75k-100k, 151.1% for AGIs $100k-200k, 858.6% for AGIs over 200k)
Earned income credit: $2,186 (reported on 13.5% of returns)
Here:
$2,186
State:
$2,020
(% of AGI for various income ranges: 76.5% for AGIs below $25k, 74.5% for AGIs $25k-50k, 3.1% for AGIs $50k-75k)
Percentage of individuals using paid preparers for their 2020 taxes: 94.2%
Here:
94%
State:
93%
(% for various income ranges: 93.6% for AGIs below $25k, 94.8% for AGIs $25k-50k, 94.1% for AGIs $50k-75k, 93.3% for AGIs $75k-100k, 94.5% for AGIs $100k-200k, 95.2% for AGIs over 200k)
Averages for the 2012 tax year for zip code 99006, filed in 2013:
Average Adjusted Gross Income (AGI) in 2012: $53,704 (Individual Income Tax Returns)
Here:
$53,704
State:
$69,533
Salary/wage: $42,654 (reported on 78.9% of returns)
Here:
$42,654
State:
$57,267
(% of AGI for various income ranges: 69.0% for AGIs below $25k, 71.1% for AGIs $25k-50k, 72.5% for AGIs $50k-75k, 73.5% for AGIs $75k-100k, 72.6% for AGIs $100k-200k, 14.1% for AGIs over 200k)
Taxable interest for individuals: $1,473 (reported on 34.9% of returns)
This zip code:
$1,473
Washington:
$1,816
(% of AGI for various income ranges: 1.3% for AGIs below $25k, 1.0% for AGIs $25k-50k, 0.8% for AGIs $50k-75k, 0.5% for AGIs $75k-100k, 1.3% for AGIs $100k-200k, 1.1% for AGIs over 200k)
Ordinary dividends: $3,994 (reported on 15.8% of returns)
Here:
$3,994
State:
$8,163
(% of AGI for various income ranges: 1.9% for AGIs below $25k, 1.2% for AGIs $25k-50k, 0.6% for AGIs $50k-75k, 0.7% for AGIs $75k-100k, 1.3% for AGIs $100k-200k, 1.9% for AGIs over 200k)
Net capital gain/loss in AGI: +$5,748 (reported on 14.8% of returns)
Here:
+$5,748
State:
+$21,568
(% of AGI for various income ranges: 0.4% for AGIs $25k-50k, 0.6% for AGIs $50k-75k, 0.8% for AGIs $75k-100k, 2.0% for AGIs $100k-200k, 5.4% for AGIs over 200k)
Profit/loss from business: +$9,177 (reported on 14.0% of returns)
Here:
+$9,177
State:
+$16,521
(% of AGI for various income ranges: 5.9% for AGIs below $25k, 3.5% for AGIs $25k-50k, 2.6% for AGIs $50k-75k, 1.7% for AGIs $75k-100k, 2.3% for AGIs $100k-200k)
Taxable individual retirement arrangement distribution: $16,484 (reported on 11.2% of returns)
99006:
$16,484
Washington:
$18,648
(% of AGI for various income ranges: 3.5% for AGIs below $25k, 2.8% for AGIs $25k-50k, 3.2% for AGIs $50k-75k, 3.9% for AGIs $75k-100k, 6.4% for AGIs $100k-200k)
Total itemized deductions: $19,550 (22% of AGI, reported on 30.2% of returns)
Here:
$19,550
State:
$23,872
Here:
22.4% of AGI
State:
18.2% of AGI
(% of AGI for various income ranges: 11.2% for AGIs below $25k, 11.5% for AGIs $25k-50k, 11.9% for AGIs $50k-75k, 12.5% for AGIs $75k-100k, 13.3% for AGIs $100k-200k, 4.7% for AGIs over 200k)
Charity contributions: $3,368 (reported on 22.1% of returns)
Here:
$3,368
State:
$4,465
(% of AGI for various income ranges: 0.9% for AGIs below $25k, 1.0% for AGIs $25k-50k, 1.5% for AGIs $50k-75k, 1.6% for AGIs $75k-100k, 1.9% for AGIs $100k-200k, 1.0% for AGIs over 200k)
Taxes paid: $4,766 (reported on 30.0% of returns)
99006:
$4,766
State:
$6,400
(% of AGI for various income ranges: 2.1% for AGIs below $25k, 2.4% for AGIs $25k-50k, 2.7% for AGIs $50k-75k, 3.2% for AGIs $75k-100k, 3.5% for AGIs $100k-200k, 1.6% for AGIs over 200k)
Earned income credit: $2,164 (reported on 18.7% of returns)
Here:
$2,164
State:
$2,073
(% of AGI for various income ranges: 6.2% for AGIs below $25k, 1.3% for AGIs $25k-50k)
Percentage of individuals using paid preparers for their 2012 taxes: 47.3%
Here:
47%
State:
43%
(% for various income ranges: 41.3% for AGIs below $25k, 47.5% for AGIs $25k-50k, 51.1% for AGIs $50k-75k, 46.3% for AGIs $75k-100k, 58.1% for AGIs $100k-200k, 100.0% for AGIs over 200k)
Averages for the 2004 tax year for zip code 99006, filed in 2005:
Average Adjusted Gross Income (AGI) in 2004: $37,301 (Individual Income Tax Returns)
Here:
$37,301
State:
$54,331
Salary/wage: $34,288 (reported on 82.5% of returns)
Here:
$34,288
State:
$45,761
(% of AGI for various income ranges: 157.0% for AGIs below $10k, 75.4% for AGIs $10k-25k, 76.1% for AGIs $25k-50k, 80.3% for AGIs $50k-75k, 81.7% for AGIs $75k-100k, 57.0% for AGIs over 100k)
Taxable interest for individuals: $1,412 (reported on 44.2% of returns)
This zip code:
$1,412
Washington:
$2,110
(% of AGI for various income ranges: 8.7% for AGIs below $10k, 2.2% for AGIs $10k-25k, 1.4% for AGIs $25k-50k, 1.0% for AGIs $50k-75k, 1.2% for AGIs $75k-100k, 2.6% for AGIs over 100k)
Taxable dividends: $2,295 (reported on 17.6% of returns)
Here:
$2,295
State:
$5,879
(% of AGI for various income ranges: 3.2% for AGIs below $10k, 1.1% for AGIs $10k-25k, 0.7% for AGIs $25k-50k, 0.6% for AGIs $50k-75k, 0.8% for AGIs $75k-100k, 2.5% for AGIs over 100k)
Net capital gain/loss: +$6,763 (reported on 18.2% of returns)
Here:
+$6,763
State:
+$15,835
(% of AGI for various income ranges: -2.6% for AGIs below $10k, 0.9% for AGIs $10k-25k, 1.4% for AGIs $25k-50k, 1.5% for AGIs $50k-75k, 1.9% for AGIs $75k-100k, 12.4% for AGIs over 100k)
Profit/loss from business: +$8,101 (reported on 16.0% of returns)
Here:
+$8,101
State:
+$13,994
(% of AGI for various income ranges: -6.9% for AGIs below $10k, 5.1% for AGIs $10k-25k, 3.7% for AGIs $25k-50k, 2.7% for AGIs $50k-75k, 0.4% for AGIs $75k-100k, 6.6% for AGIs over 100k)
IRA payment deduction: $2,838 (reported on 3.6% of returns)
99006:
$2,838
Washington:
$3,001
(% of AGI for various income ranges: 0.5% for AGIs $10k-25k, 0.3% for AGIs $25k-50k, 0.3% for AGIs $50k-75k, 0.3% for AGIs $75k-100k, 0.2% for AGIs over 100k)
Self-employed pension: $13,667 (reported on 0.4% of returns)
Here:
$13,667
Washington:
$14,244
Total itemized deductions: $16,117 (26% of AGI, reported on 27.8% of returns)
Here:
$16,117
State:
$19,669
Here:
25.9% of AGI
State:
20.7% of AGI
(% of AGI for various income ranges: 18.1% for AGIs below $10k, 7.9% for AGIs $10k-25k, 12.0% for AGIs $25k-50k, 12.7% for AGIs $50k-75k, 13.5% for AGIs $75k-100k, 12.1% for AGIs over 100k)
Charity contributions deductions: $2,686 (4% of AGI, reported on 22.1% of returns)
Here:
$2,686
State:
$3,569
Here:
4.1% of AGI
State:
3.5% of AGI
(% of AGI for various income ranges: 0.8% for AGIs below $10k, 0.9% for AGIs $10k-25k, 1.2% for AGIs $25k-50k, 1.6% for AGIs $50k-75k, 2.0% for AGIs $75k-100k, 2.4% for AGIs over 100k)
Total tax: $4,360 (reported on 73.6% of returns)
99006:
$4,360
State:
$9,065
(% of AGI for various income ranges: 4.2% for AGIs below $10k, 4.1% for AGIs $10k-25k, 6.1% for AGIs $25k-50k, 7.7% for AGIs $50k-75k, 10.1% for AGIs $75k-100k, 16.1% for AGIs over 100k)
Earned income credit: $1,712 (reported on 16.2% of returns)
Here:
$1,712
State:
$1,607
Percentage of individuals using paid preparers for their 2004 taxes: 51.0%
Here:
51%
State:
49%
(% for various income ranges: 42.0% for AGIs below $10k, 50.0% for AGIs $10k-25k, 53.6% for AGIs $25k-50k, 52.1% for AGIs $50k-75k, 55.6% for AGIs $75k-100k, 70.4% for AGIs over 100k)
Likely homosexual households (counted as self-reported same-sex unmarried-partner households)
Lesbian couples: 0.9% of all households
Gay men: 0.0% of all households
Household received Food Stamps/SNAP in the past 12 months: 936 Household did not receive Food Stamps/SNAP in the past 12 months: 4,334
Women who had a birth in the past 12 months: 140 (138 now married, 5 unmarried) Women who did not have a birth in the past 12 months: 2,429 (1,429 now married, 989 unmarried)
Housing units in zip code 99006 with a mortgage: 2,489 (155 second mortgage, 145 both second mortgage and home equity loan) Houses without a mortgage: 55
Median monthly owner costs for units with a mortgage: $1,571 Median monthly owner costs for units without a mortgage: $560
Residents with income below the poverty level in 2022:
This zip code:
14.4%
Whole state:
10.0%
Residents with income below 50% of the poverty level in 2022:
This zip code:
6.2%
Whole state:
4.6%
Median number of rooms in houses and condos:
Here:
6.4
State:
6.5
Median number of rooms in apartments:
Here:
4.3
State:
3.9
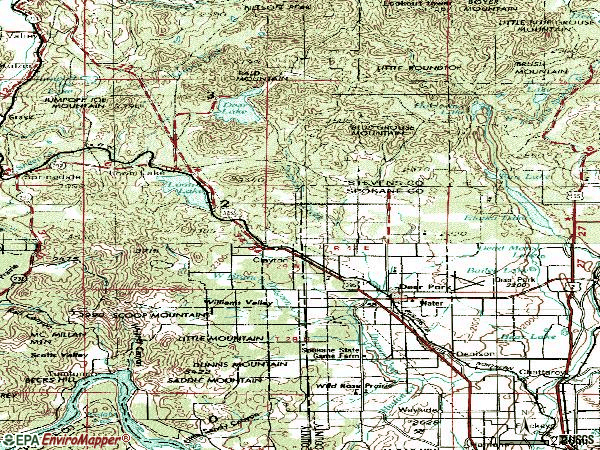
Notable locations in this zip code not listed on our city pages
Notable locations in zip code 99006: Spokane State Game Farm (A), Camp Reed (B), Keystone Corners (C), Twin Mountain Fire Station (D), Tri-County Fairgrounds (E), Wild Rose (F), Deer Park Ambulance (G), Spokane County Fire District 4 Station 41 Deer Park (H), Spokane County Fire District 4 Station 45 Wild Rose (I), Stevens County Fire District 1 Station 3 Twin Mountains (J), Flying Firemen Facility (K). Display/hide their locations on the map
Churches in zip code 99006 include: Assembly of God Tri - County Christian Center (A), Faith Lutheran Church (B), Christ Church of Deer Park (C), Deer Park Church of Nazarene (D), Deer Park First Baptist Church (E), Deer Park United Methodist Church (F), Grace Evangelical Free Church (G), Kingdom Hall of Jehovahs Witnesses (H), Open Door Congregational Church (I). Display/hide their locations on the map
Cemeteries: Kelly Cemetery (1), Tumtum Cemetery (2), Wild Rose Cemetery (3), Williams Valley Hillside Cemetery (4), Woodland Cemetery (5), Zion Hill Cemetery (6). Display/hide their locations on the map
Lakes and reservoirs: Little Trout Lake (A), Bailey Lake (B), Red Lake (C), Black Lake (D), Dead Mans Lake (E), Fan Lake (F), Horseshoe Lake (G), Blue Lake (H). Display/hide their locations on the map
Creeks: Buck Creek (A), Hemlock Creek (B), West Branch Dragoon Creek (C), Ecks Creek (D), Frog Creek (E), Huston Creek (F), Mud Creek (G), Spring Creek (H), Wethey Creek (I). Display/hide their locations on the map
In group quarters: 44 (-1 institutionalized population)
Size of family households: 1,885 2-persons, 497 3-persons, 562 4-persons, 499 5-persons, 154 6-persons, 117 7-or-more-persons
Size of nonfamily households: 1,323 1-person, 189 2-persons, 25 4-persons
2,358 married couples with children.
409 single-parent households (49 men, 360 women).
94.7% of residents of 99006 zip code speak English at home.
2.6% of residents speak Spanish at home (73% very well, 15% well, 12% not well).
0.9% of residents speak other Indo-European language at home (63% very well, 29% well, 8% not well).
1.2% of residents speak Asian or Pacific Island language at home (46% very well, 54% well).
0.2% of residents speak other language at home (100% very well).
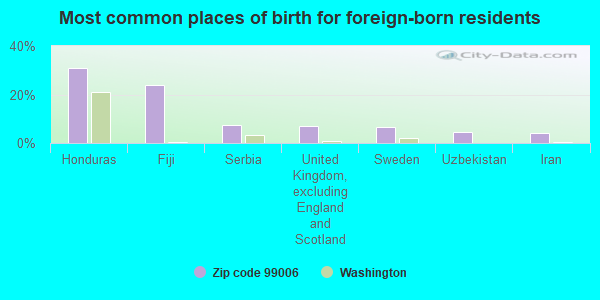
Foreign born population: 324 (2.3%) (33.8% of them are naturalized citizens)
This zip code:
2.3%
Whole state:
15.3%
31%Honduras
24%Fiji
7%Serbia
7%United Kingdom, excluding England and Scotland
7%Sweden
5%Uzbekistan
4%Iran
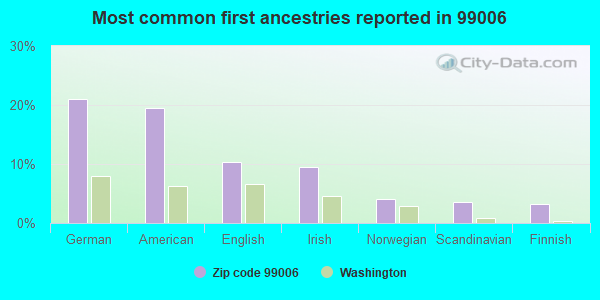
21%German
20%American
10%English
10%Irish
4%Norwegian
4%Scandinavian
3%Finnish
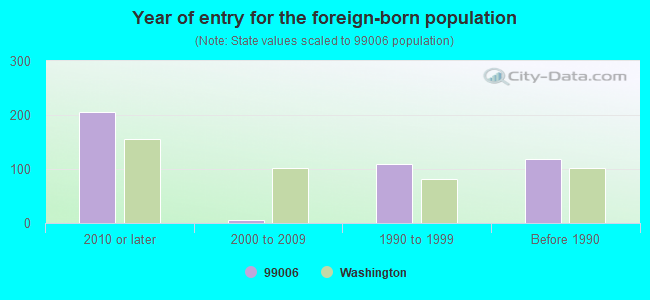
Year of entry for the foreign-born population
2062010 or later
62000 to 2009
1091990 to 1999
119Before 1990
Facilities with environmental interests located in this zip code:
ARCADIA ELEMENTARY (1120 E D ST in DEER PARK, WA)
(National Center for Education Statistics) - STATE ID-2173 Organizations: DEER PARK SCHOOL DIST 414 (SCHOOL DISTRICT)
COLBYS GREENHOUSE (31023 N STAGHORN RD in DEER PARK, WA)
COMPLIANCE ACTIVITY (Tracking inspections of insecticide, fungicide, and rodenticide, and toxic substances)
Housing units lacking complete plumbing facilities: 1.0% Housing units lacking complete kitchen facilities: 0.3%
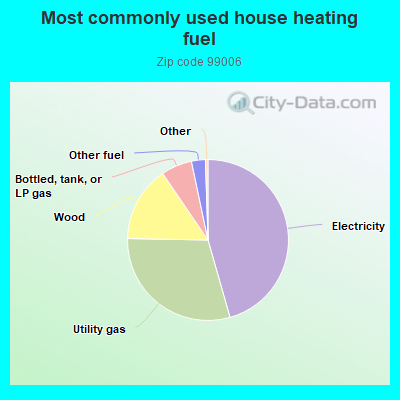
45.6%Electricity
29.7%Utility gas
15.2%Wood
6.2%Bottled, tank, or LP gas
2.8%Other fuel
Population in 1990: 7,287. Population change in the 1990s: +1,876 (+25.7%).
Place of birth for U.S.-born residents:
This state: 8,674
Northeast: 281
Midwest: 908
South: 622
West: 3,078
57% of the 99006 zip code residents lived in the same house 5 years ago. Out of people who lived in different houses, 59% lived in this county. Out of people who lived in different counties, 50% lived in Washington.
94% of the 99006 zip code residents lived in the same house 1 year ago. Out of people who lived in different houses, 66% moved from this county. Out of people who lived in different houses, 10% moved from different county within same state. Out of people who lived in different houses, 33% moved from different state.
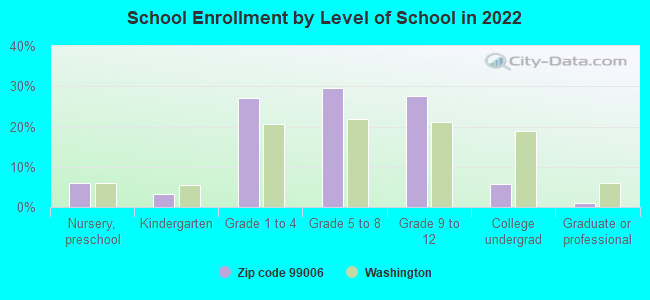
Private vs. public school enrollment:
Students in private schools in grades 1 to 8 (elementary and middle school): 168
Here:
11.3%
Washington:
12.4%
Students in private schools in grades 9 to 12 (high school): 77
Here:
10.7%
Washington:
9.2%
Students in private undergraduate colleges: 10
Here:
7.1%
Washington:
16.5%
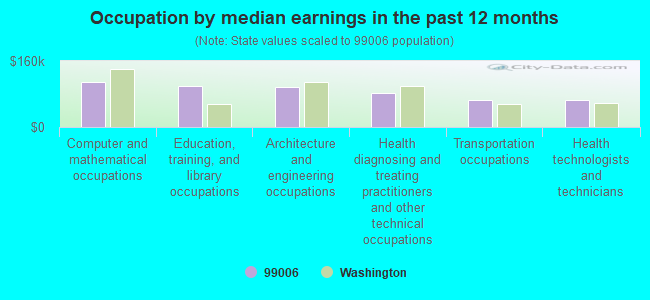
Occupation by median earnings in the past 12 months ($)
109,096Computer and mathematical occupations
98,446Education, training, and library occupations
96,287Architecture and engineering occupations
81,469Health diagnosing and treating practitioners and other technical occupations
66,441Transportation occupations
65,867Health technologists and technicians
Companies with federal contracts located in this zip code (DEER PARK, WA):
HARRIS & BAUM (3211 E ELOIKA LAKE RD; small business) : $762,495 in 22 contractsfrom 2001 to 2005
Contracts for Maintenance, Repair or Alteration of Real Property -- Maintenance Buildings, Miscellaneous Maintenance and Repair Shop Specialized Equipment, Prefabricated and Portable Buildings, Aircraft Maintenance and Repair Shop Specialized Equipment, and moreby U.S. Coast Guard, Navy, Army, Food and Drug Administration, and others Signed by year:2000: $0; 2001: $58,890; 2002: $131,050; 2003: $147,078; 2004: $143,991; 2005: $281,486; 2006: $0.
Biggest contracts:
$99,653 with U.S. Coast Guard for Maintenance, Repair or Alteration of Real Property -- Maintenance Buildings. Taking place in AK. Signed on 2004-01-16. Completion date: 2004-03-01.
$92,700 with Navy for Miscellaneous Maintenance and Repair Shop Specialized Equipment. Signed on 2005-09-12. Completion date: 2006-01-12.
$81,800 with Army for Prefabricated and Portable Buildings. Taking place in CA. Signed on 2005-03-16. Completion date: 2005-06-13.
$77,862 with Navy for Aircraft Maintenance and Repair Shop Specialized Equipment. Signed on 2003-01-21. Completion date: 2003-04-21.
NORTHERN HARDWOOD CO INC (617 N COLUMBIA; small business) : $462,616 in 9 contractsfrom 1999 to 2006
Contracts for Maintenance, Repair or Alteration of Real Property -- Recreational Buildings, Construction of Structures and Facilities -- Miscellaneous Buildings by Army Signed by year:2000: $0; 2001: $0; 2002: $113,377; 2003: $115,761; 2004: $0; 2005: $0; 2006: $118,520.
Biggest contracts:
$118,520 with Army for Maintenance, Repair or Alteration of Real Property -- Recreational Buildings. Signed on 2006-05-08. Completion date: 2006-05-02.
$114,958, same as above.Signed on 1999-12-07. Completion date: 2004-09-30.
$82,353 with Army for Construction of Structures and Facilities -- Miscellaneous Buildings. Signed on 2003-09-11. Completion date: 2004-09-30.
$79,184, same as above.Signed on 2002-10-04. Completion date: 2004-09-30.
BAUM & ASSOCIATES INC (3211 E. ELOIKA LAKE RD.; small business)
$38,812 with Navy for Miscellaneous Ship and Marine Equipment. Signed on 1999-12-15. Completion date: 2000-01-20.
SECREST, KATHLEEN (5475 GLEN GROVE-STALEY RD; small business) : $8,400 in 2 contractsin 2004
$4,200 with Army for Arts/Graphics Services. Signed on 2004-09-13. Completion date: 2004-01-12.
$4,200 with U.S. Army Corps of Engineers - civil program financing only for Arts/Graphics Services. Signed on 2004-09-13. Completion date: 2004-01-12.
D.ERIC JAMES (113 N MAIN; small business) 18 employees, $450000 revenue.
$1,500 with Forest Service for Real Property Appraisals Services (SIC 6531). Taking place in OR. Signed on 2000-09-15. Completion date: 2000-09-15.
Top industries in this zip code by the number of employees in 2005:
2002 - 2018 National Fire Incident Reporting System (NFIRS) incidents
Based on the data from the years 2002 - 2018 the average number of fires per year is 34. The highest number of reported fire incidents - 78 took place in 2018, and the least - 3 in 2003. The data has an increasing trend.
When looking into fire subcategories, the most incidents belonged to: Outside Fires (51.7%), and Structure Fires (28.9%).
Fire incident types reported to NFIRS in Zip Code 99006
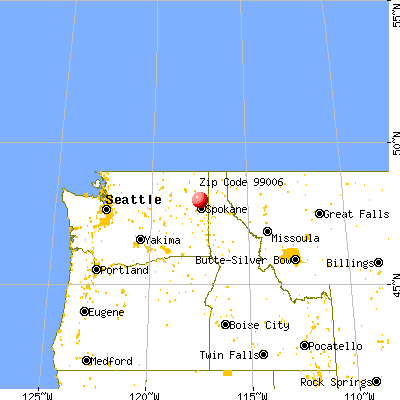


 Nearest zip codes: 99110, 99148, 99005, 99208, 99026, 99003.


 Based on the data from the years 2002 - 2018 the average number of fires per year is 34. The highest number of reported fire incidents - 78 took place in 2018, and the least - 3 in 2003. The data has an increasing trend.
 When looking into fire subcategories, the most incidents belonged to: Outside Fires (51.7%), and Structure Fires (28.9%).