Greeley, Colorado Submit your own pictures of this city and show them to the world
OSM Map
General Map
Google Map
MSN Map
OSM Map
General Map
Google Map
MSN Map
OSM Map
General Map
Google Map
MSN Map
OSM Map
General Map
Google Map
MSN Map
Please wait while loading the map...
Population in 2022: 109,209 (100% urban, 0% rural). Population change since 2000: +42.0%Males: 54,314 Females: 54,895
March 2022 cost of living index in Greeley: 101.7 (near average, U.S. average is 100) Percentage of residents living in poverty in 2022: 15.4%for White Non-Hispanic residents , 36.2% for Black residents , 20.6% for Hispanic or Latino residents , 22.0% for American Indian residents , 18.3% for other race residents , 14.3% for two or more races residents )
Profiles of local businesses
Business Search - 14 Million verified businesses
Data:
Median household income ($)
Median household income (% change since 2000)
Household income diversity
Ratio of average income to average house value (%)
Ratio of average income to average rent
Median household income ($) - White
Median household income ($) - Black or African American
Median household income ($) - Asian
Median household income ($) - Hispanic or Latino
Median household income ($) - American Indian and Alaska Native
Median household income ($) - Multirace
Median household income ($) - Other Race
Median household income for houses/condos with a mortgage ($)
Median household income for apartments without a mortgage ($)
Races - White alone (%)
Races - White alone (% change since 2000)
Races - Black alone (%)
Races - Black alone (% change since 2000)
Races - American Indian alone (%)
Races - American Indian alone (% change since 2000)
Races - Asian alone (%)
Races - Asian alone (% change since 2000)
Races - Hispanic (%)
Races - Hispanic (% change since 2000)
Races - Native Hawaiian and Other Pacific Islander alone (%)
Races - Native Hawaiian and Other Pacific Islander alone (% change since 2000)
Races - Two or more races (%)
Races - Two or more races (% change since 2000)
Races - Other race alone (%)
Races - Other race alone (% change since 2000)
Racial diversity
Unemployment (%)
Unemployment (% change since 2000)
Unemployment (%) - White
Unemployment (%) - Black or African American
Unemployment (%) - Asian
Unemployment (%) - Hispanic or Latino
Unemployment (%) - American Indian and Alaska Native
Unemployment (%) - Multirace
Unemployment (%) - Other Race
Population density (people per square mile)
Population - Males (%)
Population - Females (%)
Population - Males (%) - White
Population - Males (%) - Black or African American
Population - Males (%) - Asian
Population - Males (%) - Hispanic or Latino
Population - Males (%) - American Indian and Alaska Native
Population - Males (%) - Multirace
Population - Males (%) - Other Race
Population - Females (%) - White
Population - Females (%) - Black or African American
Population - Females (%) - Asian
Population - Females (%) - Hispanic or Latino
Population - Females (%) - American Indian and Alaska Native
Population - Females (%) - Multirace
Population - Females (%) - Other Race
Coronavirus confirmed cases (Jun 15, 2024)
Deaths caused by coronavirus (Jun 15, 2024)
Coronavirus confirmed cases (per 100k population) (Jun 15, 2024)
Deaths caused by coronavirus (per 100k population) (Jun 15, 2024)
Daily increase in number of cases (Jun 15, 2024)
Weekly increase in number of cases (Jun 15, 2024)
Cases doubled (in days) (Jun 15, 2024)
Hospitalized patients (Apr 18, 2022)
Negative test results (Apr 18, 2022)
Total test results (Apr 18, 2022)
COVID Vaccine doses distributed (per 100k population) (Sep 19, 2023)
COVID Vaccine doses administered (per 100k population) (Sep 19, 2023)
COVID Vaccine doses distributed (Sep 19, 2023)
COVID Vaccine doses administered (Sep 19, 2023)
Likely homosexual households (%)
Likely homosexual households (% change since 2000)
Likely homosexual households - Lesbian couples (%)
Likely homosexual households - Lesbian couples (% change since 2000)
Likely homosexual households - Gay men (%)
Likely homosexual households - Gay men (% change since 2000)
Cost of living index
Median gross rent ($)
Median contract rent ($)
Median monthly housing costs ($)
Median house or condo value ($)
Median house or condo value ($ change since 2000)
Mean house or condo value by units in structure - 1, detached ($)
Mean house or condo value by units in structure - 1, attached ($)
Mean house or condo value by units in structure - 2 ($)
Mean house or condo value by units in structure by units in structure - 3 or 4 ($)
Mean house or condo value by units in structure - 5 or more ($)
Mean house or condo value by units in structure - Boat, RV, van, etc. ($)
Mean house or condo value by units in structure - Mobile home ($)
Median house or condo value ($) - White
Median house or condo value ($) - Black or African American
Median house or condo value ($) - Asian
Median house or condo value ($) - Hispanic or Latino
Median house or condo value ($) - American Indian and Alaska Native
Median house or condo value ($) - Multirace
Median house or condo value ($) - Other Race
Median resident age
Resident age diversity
Median resident age - Males
Median resident age - Females
Median resident age - White
Median resident age - Black or African American
Median resident age - Asian
Median resident age - Hispanic or Latino
Median resident age - American Indian and Alaska Native
Median resident age - Multirace
Median resident age - Other Race
Median resident age - Males - White
Median resident age - Males - Black or African American
Median resident age - Males - Asian
Median resident age - Males - Hispanic or Latino
Median resident age - Males - American Indian and Alaska Native
Median resident age - Males - Multirace
Median resident age - Males - Other Race
Median resident age - Females - White
Median resident age - Females - Black or African American
Median resident age - Females - Asian
Median resident age - Females - Hispanic or Latino
Median resident age - Females - American Indian and Alaska Native
Median resident age - Females - Multirace
Median resident age - Females - Other Race
Commute - mean travel time to work (minutes)
Travel time to work - Less than 5 minutes (%)
Travel time to work - Less than 5 minutes (% change since 2000)
Travel time to work - 5 to 9 minutes (%)
Travel time to work - 5 to 9 minutes (% change since 2000)
Travel time to work - 10 to 19 minutes (%)
Travel time to work - 10 to 19 minutes (% change since 2000)
Travel time to work - 20 to 29 minutes (%)
Travel time to work - 20 to 29 minutes (% change since 2000)
Travel time to work - 30 to 39 minutes (%)
Travel time to work - 30 to 39 minutes (% change since 2000)
Travel time to work - 40 to 59 minutes (%)
Travel time to work - 40 to 59 minutes (% change since 2000)
Travel time to work - 60 to 89 minutes (%)
Travel time to work - 60 to 89 minutes (% change since 2000)
Travel time to work - 90 or more minutes (%)
Travel time to work - 90 or more minutes (% change since 2000)
Marital status - Never married (%)
Marital status - Now married (%)
Marital status - Separated (%)
Marital status - Widowed (%)
Marital status - Divorced (%)
Median family income ($)
Median family income (% change since 2000)
Median non-family income ($)
Median non-family income (% change since 2000)
Median per capita income ($)
Median per capita income (% change since 2000)
Median family income ($) - White
Median family income ($) - Black or African American
Median family income ($) - Asian
Median family income ($) - Hispanic or Latino
Median family income ($) - American Indian and Alaska Native
Median family income ($) - Multirace
Median family income ($) - Other Race
Median year house/condo built
Median year apartment built
Year house built - Built 2005 or later (%)
Year house built - Built 2000 to 2004 (%)
Year house built - Built 1990 to 1999 (%)
Year house built - Built 1980 to 1989 (%)
Year house built - Built 1970 to 1979 (%)
Year house built - Built 1960 to 1969 (%)
Year house built - Built 1950 to 1959 (%)
Year house built - Built 1940 to 1949 (%)
Year house built - Built 1939 or earlier (%)
Average household size
Household density (households per square mile)
Average household size - White
Average household size - Black or African American
Average household size - Asian
Average household size - Hispanic or Latino
Average household size - American Indian and Alaska Native
Average household size - Multirace
Average household size - Other Race
Occupied housing units (%)
Vacant housing units (%)
Owner occupied housing units (%)
Renter occupied housing units (%)
Vacancy status - For rent (%)
Vacancy status - For sale only (%)
Vacancy status - Rented or sold, not occupied (%)
Vacancy status - For seasonal, recreational, or occasional use (%)
Vacancy status - For migrant workers (%)
Vacancy status - Other vacant (%)
Residents with income below the poverty level (%)
Residents with income below 50% of the poverty level (%)
Children below poverty level (%)
Poor families by family type - Married-couple family (%)
Poor families by family type - Male, no wife present (%)
Poor families by family type - Female, no husband present (%)
Poverty status for native-born residents (%)
Poverty status for foreign-born residents (%)
Poverty among high school graduates not in families (%)
Poverty among people who did not graduate high school not in families (%)
Residents with income below the poverty level (%) - White
Residents with income below the poverty level (%) - Black or African American
Residents with income below the poverty level (%) - Asian
Residents with income below the poverty level (%) - Hispanic or Latino
Residents with income below the poverty level (%) - American Indian and Alaska Native
Residents with income below the poverty level (%) - Multirace
Residents with income below the poverty level (%) - Other Race
Air pollution - Air Quality Index (AQI)
Air pollution - CO
Air pollution - NO2
Air pollution - SO2
Air pollution - Ozone
Air pollution - PM10
Air pollution - PM25
Air pollution - Pb
Crime - Murders per 100,000 population
Crime - Rapes per 100,000 population
Crime - Robberies per 100,000 population
Crime - Assaults per 100,000 population
Crime - Burglaries per 100,000 population
Crime - Thefts per 100,000 population
Crime - Auto thefts per 100,000 population
Crime - Arson per 100,000 population
Crime - City-data.com crime index
Crime - Violent crime index
Crime - Property crime index
Crime - Murders per 100,000 population (5 year average)
Crime - Rapes per 100,000 population (5 year average)
Crime - Robberies per 100,000 population (5 year average)
Crime - Assaults per 100,000 population (5 year average)
Crime - Burglaries per 100,000 population (5 year average)
Crime - Thefts per 100,000 population (5 year average)
Crime - Auto thefts per 100,000 population (5 year average)
Crime - Arson per 100,000 population (5 year average)
Crime - City-data.com crime index (5 year average)
Crime - Violent crime index (5 year average)
Crime - Property crime index (5 year average)
1996 Presidential Elections Results (%) - Democratic Party (Clinton)
1996 Presidential Elections Results (%) - Republican Party (Dole)
1996 Presidential Elections Results (%) - Other
2000 Presidential Elections Results (%) - Democratic Party (Gore)
2000 Presidential Elections Results (%) - Republican Party (Bush)
2000 Presidential Elections Results (%) - Other
2004 Presidential Elections Results (%) - Democratic Party (Kerry)
2004 Presidential Elections Results (%) - Republican Party (Bush)
2004 Presidential Elections Results (%) - Other
2008 Presidential Elections Results (%) - Democratic Party (Obama)
2008 Presidential Elections Results (%) - Republican Party (McCain)
2008 Presidential Elections Results (%) - Other
2012 Presidential Elections Results (%) - Democratic Party (Obama)
2012 Presidential Elections Results (%) - Republican Party (Romney)
2012 Presidential Elections Results (%) - Other
2016 Presidential Elections Results (%) - Democratic Party (Clinton)
2016 Presidential Elections Results (%) - Republican Party (Trump)
2016 Presidential Elections Results (%) - Other
2020 Presidential Elections Results (%) - Democratic Party (Biden)
2020 Presidential Elections Results (%) - Republican Party (Trump)
2020 Presidential Elections Results (%) - Other
Ancestries Reported - Arab (%)
Ancestries Reported - Czech (%)
Ancestries Reported - Danish (%)
Ancestries Reported - Dutch (%)
Ancestries Reported - English (%)
Ancestries Reported - French (%)
Ancestries Reported - French Canadian (%)
Ancestries Reported - German (%)
Ancestries Reported - Greek (%)
Ancestries Reported - Hungarian (%)
Ancestries Reported - Irish (%)
Ancestries Reported - Italian (%)
Ancestries Reported - Lithuanian (%)
Ancestries Reported - Norwegian (%)
Ancestries Reported - Polish (%)
Ancestries Reported - Portuguese (%)
Ancestries Reported - Russian (%)
Ancestries Reported - Scotch-Irish (%)
Ancestries Reported - Scottish (%)
Ancestries Reported - Slovak (%)
Ancestries Reported - Subsaharan African (%)
Ancestries Reported - Swedish (%)
Ancestries Reported - Swiss (%)
Ancestries Reported - Ukrainian (%)
Ancestries Reported - United States (%)
Ancestries Reported - Welsh (%)
Ancestries Reported - West Indian (%)
Ancestries Reported - Other (%)
Educational Attainment - No schooling completed (%)
Educational Attainment - Less than high school (%)
Educational Attainment - High school or equivalent (%)
Educational Attainment - Less than 1 year of college (%)
Educational Attainment - 1 or more years of college (%)
Educational Attainment - Associate degree (%)
Educational Attainment - Bachelor's degree (%)
Educational Attainment - Master's degree (%)
Educational Attainment - Professional school degree (%)
Educational Attainment - Doctorate degree (%)
School Enrollment - Nursery, preschool (%)
School Enrollment - Kindergarten (%)
School Enrollment - Grade 1 to 4 (%)
School Enrollment - Grade 5 to 8 (%)
School Enrollment - Grade 9 to 12 (%)
School Enrollment - College undergrad (%)
School Enrollment - Graduate or professional (%)
School Enrollment - Not enrolled in school (%)
School enrollment - Public schools (%)
School enrollment - Private schools (%)
School enrollment - Not enrolled (%)
Median number of rooms in houses and condos
Median number of rooms in apartments
Housing units lacking complete plumbing facilities (%)
Housing units lacking complete kitchen facilities (%)
Density of houses
Urban houses (%)
Rural houses (%)
Households with people 60 years and over (%)
Households with people 65 years and over (%)
Households with people 75 years and over (%)
Households with one or more nonrelatives (%)
Households with no nonrelatives (%)
Population in households (%)
Family households (%)
Nonfamily households (%)
Population in families (%)
Family households with own children (%)
Median number of bedrooms in owner occupied houses
Mean number of bedrooms in owner occupied houses
Median number of bedrooms in renter occupied houses
Mean number of bedrooms in renter occupied houses
Median number of vehichles in owner occupied houses
Mean number of vehichles in owner occupied houses
Median number of vehichles in renter occupied houses
Mean number of vehichles in renter occupied houses
Mortgage status - with mortgage (%)
Mortgage status - with second mortgage (%)
Mortgage status - with home equity loan (%)
Mortgage status - with both second mortgage and home equity loan (%)
Mortgage status - without a mortgage (%)
Average family size
Average family size - White
Average family size - Black or African American
Average family size - Asian
Average family size - Hispanic or Latino
Average family size - American Indian and Alaska Native
Average family size - Multirace
Average family size - Other Race
Geographical mobility - Same house 1 year ago (%)
Geographical mobility - Moved within same county (%)
Geographical mobility - Moved from different county within same state (%)
Geographical mobility - Moved from different state (%)
Geographical mobility - Moved from abroad (%)
Place of birth - Born in state of residence (%)
Place of birth - Born in other state (%)
Place of birth - Native, outside of US (%)
Place of birth - Foreign born (%)
Housing units in structures - 1, detached (%)
Housing units in structures - 1, attached (%)
Housing units in structures - 2 (%)
Housing units in structures - 3 or 4 (%)
Housing units in structures - 5 to 9 (%)
Housing units in structures - 10 to 19 (%)
Housing units in structures - 20 to 49 (%)
Housing units in structures - 50 or more (%)
Housing units in structures - Mobile home (%)
Housing units in structures - Boat, RV, van, etc. (%)
House/condo owner moved in on average (years ago)
Renter moved in on average (years ago)
Year householder moved into unit - Moved in 1999 to March 2000 (%)
Year householder moved into unit - Moved in 1995 to 1998 (%)
Year householder moved into unit - Moved in 1990 to 1994 (%)
Year householder moved into unit - Moved in 1980 to 1989 (%)
Year householder moved into unit - Moved in 1970 to 1979 (%)
Year householder moved into unit - Moved in 1969 or earlier (%)
Means of transportation to work - Drove car alone (%)
Means of transportation to work - Carpooled (%)
Means of transportation to work - Public transportation (%)
Means of transportation to work - Bus or trolley bus (%)
Means of transportation to work - Streetcar or trolley car (%)
Means of transportation to work - Subway or elevated (%)
Means of transportation to work - Railroad (%)
Means of transportation to work - Ferryboat (%)
Means of transportation to work - Taxicab (%)
Means of transportation to work - Motorcycle (%)
Means of transportation to work - Bicycle (%)
Means of transportation to work - Walked (%)
Means of transportation to work - Other means (%)
Working at home (%)
Industry diversity
Most Common Industries - Agriculture, forestry, fishing and hunting, and mining (%)
Most Common Industries - Agriculture, forestry, fishing and hunting (%)
Most Common Industries - Mining, quarrying, and oil and gas extraction (%)
Most Common Industries - Construction (%)
Most Common Industries - Manufacturing (%)
Most Common Industries - Wholesale trade (%)
Most Common Industries - Retail trade (%)
Most Common Industries - Transportation and warehousing, and utilities (%)
Most Common Industries - Transportation and warehousing (%)
Most Common Industries - Utilities (%)
Most Common Industries - Information (%)
Most Common Industries - Finance and insurance, and real estate and rental and leasing (%)
Most Common Industries - Finance and insurance (%)
Most Common Industries - Real estate and rental and leasing (%)
Most Common Industries - Professional, scientific, and management, and administrative and waste management services (%)
Most Common Industries - Professional, scientific, and technical services (%)
Most Common Industries - Management of companies and enterprises (%)
Most Common Industries - Administrative and support and waste management services (%)
Most Common Industries - Educational services, and health care and social assistance (%)
Most Common Industries - Educational services (%)
Most Common Industries - Health care and social assistance (%)
Most Common Industries - Arts, entertainment, and recreation, and accommodation and food services (%)
Most Common Industries - Arts, entertainment, and recreation (%)
Most Common Industries - Accommodation and food services (%)
Most Common Industries - Other services, except public administration (%)
Most Common Industries - Public administration (%)
Occupation diversity
Most Common Occupations - Management, business, science, and arts occupations (%)
Most Common Occupations - Management, business, and financial occupations (%)
Most Common Occupations - Management occupations (%)
Most Common Occupations - Business and financial operations occupations (%)
Most Common Occupations - Computer, engineering, and science occupations (%)
Most Common Occupations - Computer and mathematical occupations (%)
Most Common Occupations - Architecture and engineering occupations (%)
Most Common Occupations - Life, physical, and social science occupations (%)
Most Common Occupations - Education, legal, community service, arts, and media occupations (%)
Most Common Occupations - Community and social service occupations (%)
Most Common Occupations - Legal occupations (%)
Most Common Occupations - Education, training, and library occupations (%)
Most Common Occupations - Arts, design, entertainment, sports, and media occupations (%)
Most Common Occupations - Healthcare practitioners and technical occupations (%)
Most Common Occupations - Health diagnosing and treating practitioners and other technical occupations (%)
Most Common Occupations - Health technologists and technicians (%)
Most Common Occupations - Service occupations (%)
Most Common Occupations - Healthcare support occupations (%)
Most Common Occupations - Protective service occupations (%)
Most Common Occupations - Fire fighting and prevention, and other protective service workers including supervisors (%)
Most Common Occupations - Law enforcement workers including supervisors (%)
Most Common Occupations - Food preparation and serving related occupations (%)
Most Common Occupations - Building and grounds cleaning and maintenance occupations (%)
Most Common Occupations - Personal care and service occupations (%)
Most Common Occupations - Sales and office occupations (%)
Most Common Occupations - Sales and related occupations (%)
Most Common Occupations - Office and administrative support occupations (%)
Most Common Occupations - Natural resources, construction, and maintenance occupations (%)
Most Common Occupations - Farming, fishing, and forestry occupations (%)
Most Common Occupations - Construction and extraction occupations (%)
Most Common Occupations - Installation, maintenance, and repair occupations (%)
Most Common Occupations - Production, transportation, and material moving occupations (%)
Most Common Occupations - Production occupations (%)
Most Common Occupations - Transportation occupations (%)
Most Common Occupations - Material moving occupations (%)
People in Group quarters - Institutionalized population (%)
People in Group quarters - Correctional institutions (%)
People in Group quarters - Federal prisons and detention centers (%)
People in Group quarters - Halfway houses (%)
People in Group quarters - Local jails and other confinement facilities (including police lockups) (%)
People in Group quarters - Military disciplinary barracks (%)
People in Group quarters - State prisons (%)
People in Group quarters - Other types of correctional institutions (%)
People in Group quarters - Nursing homes (%)
People in Group quarters - Hospitals/wards, hospices, and schools for the handicapped (%)
People in Group quarters - Hospitals/wards and hospices for chronically ill (%)
People in Group quarters - Hospices or homes for chronically ill (%)
People in Group quarters - Military hospitals or wards for chronically ill (%)
People in Group quarters - Other hospitals or wards for chronically ill (%)
People in Group quarters - Hospitals or wards for drug/alcohol abuse (%)
People in Group quarters - Mental (Psychiatric) hospitals or wards (%)
People in Group quarters - Schools, hospitals, or wards for the mentally retarded (%)
People in Group quarters - Schools, hospitals, or wards for the physically handicapped (%)
People in Group quarters - Institutions for the deaf (%)
People in Group quarters - Institutions for the blind (%)
People in Group quarters - Orthopedic wards and institutions for the physically handicapped (%)
People in Group quarters - Wards in general hospitals for patients who have no usual home elsewhere (%)
People in Group quarters - Wards in military hospitals for patients who have no usual home elsewhere (%)
People in Group quarters - Juvenile institutions (%)
People in Group quarters - Long-term care (%)
People in Group quarters - Homes for abused, dependent, and neglected children (%)
People in Group quarters - Residential treatment centers for emotionally disturbed children (%)
People in Group quarters - Training schools for juvenile delinquents (%)
People in Group quarters - Short-term care, detention or diagnostic centers for delinquent children (%)
People in Group quarters - Type of juvenile institution unknown (%)
People in Group quarters - Noninstitutionalized population (%)
People in Group quarters - College dormitories (includes college quarters off campus) (%)
People in Group quarters - Military quarters (%)
People in Group quarters - On base (%)
People in Group quarters - Barracks, unaccompanied personnel housing (UPH), (Enlisted/Officer), ;and similar group living quarters for military personnel (%)
People in Group quarters - Transient quarters for temporary residents (%)
People in Group quarters - Military ships (%)
People in Group quarters - Group homes (%)
People in Group quarters - Homes or halfway houses for drug/alcohol abuse (%)
People in Group quarters - Homes for the mentally ill (%)
People in Group quarters - Homes for the mentally retarded (%)
People in Group quarters - Homes for the physically handicapped (%)
People in Group quarters - Other group homes (%)
People in Group quarters - Religious group quarters (%)
People in Group quarters - Dormitories (%)
People in Group quarters - Agriculture workers' dormitories on farms (%)
People in Group quarters - Job Corps and vocational training facilities (%)
People in Group quarters - Other workers' dormitories (%)
People in Group quarters - Crews of maritime vessels (%)
People in Group quarters - Other nonhousehold living situations (%)
People in Group quarters - Other noninstitutional group quarters (%)
Residents speaking English at home (%)
Residents speaking English at home - Born in the United States (%)
Residents speaking English at home - Native, born elsewhere (%)
Residents speaking English at home - Foreign born (%)
Residents speaking Spanish at home (%)
Residents speaking Spanish at home - Born in the United States (%)
Residents speaking Spanish at home - Native, born elsewhere (%)
Residents speaking Spanish at home - Foreign born (%)
Residents speaking other language at home (%)
Residents speaking other language at home - Born in the United States (%)
Residents speaking other language at home - Native, born elsewhere (%)
Residents speaking other language at home - Foreign born (%)
Class of Workers - Employee of private company (%)
Class of Workers - Self-employed in own incorporated business (%)
Class of Workers - Private not-for-profit wage and salary workers (%)
Class of Workers - Local government workers (%)
Class of Workers - State government workers (%)
Class of Workers - Federal government workers (%)
Class of Workers - Self-employed workers in own not incorporated business and Unpaid family workers (%)
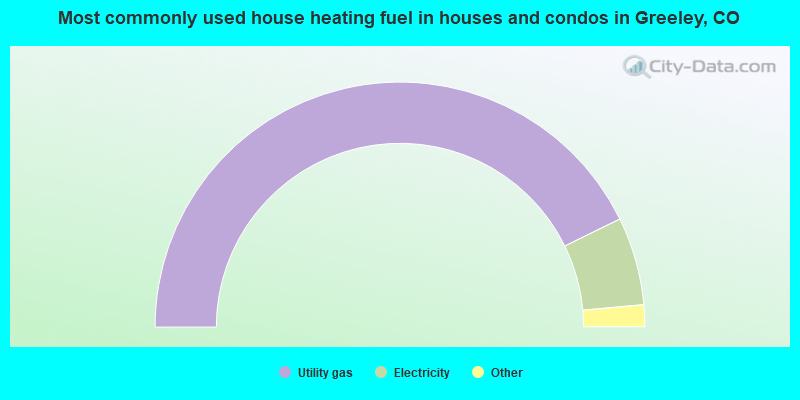
House heating fuel used in houses and condos - Utility gas (%)
House heating fuel used in houses and condos - Bottled, tank, or LP gas (%)
House heating fuel used in houses and condos - Electricity (%)
House heating fuel used in houses and condos - Fuel oil, kerosene, etc. (%)
House heating fuel used in houses and condos - Coal or coke (%)
House heating fuel used in houses and condos - Wood (%)
House heating fuel used in houses and condos - Solar energy (%)
House heating fuel used in houses and condos - Other fuel (%)
House heating fuel used in houses and condos - No fuel used (%)
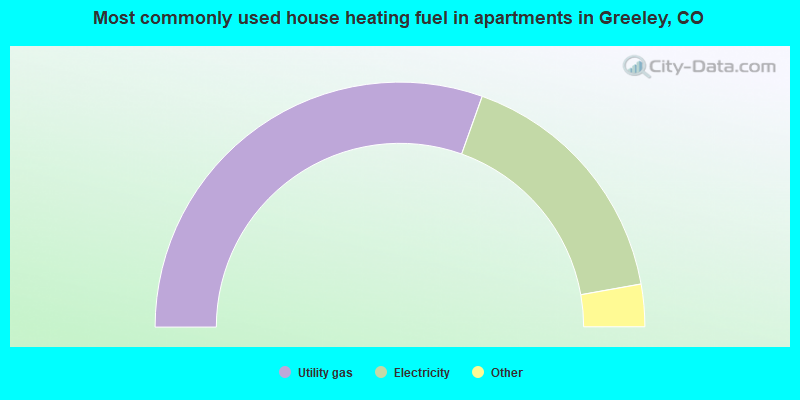
House heating fuel used in apartments - Utility gas (%)
House heating fuel used in apartments - Bottled, tank, or LP gas (%)
House heating fuel used in apartments - Electricity (%)
House heating fuel used in apartments - Fuel oil, kerosene, etc. (%)
House heating fuel used in apartments - Coal or coke (%)
House heating fuel used in apartments - Wood (%)
House heating fuel used in apartments - Solar energy (%)
House heating fuel used in apartments - Other fuel (%)
House heating fuel used in apartments - No fuel used (%)
Armed forces status - In Armed Forces (%)
Armed forces status - Civilian (%)
Armed forces status - Civilian - Veteran (%)
Armed forces status - Civilian - Nonveteran (%)
Fatal accidents locations in years 2005-2021
Fatal accidents locations in 2005
Fatal accidents locations in 2006
Fatal accidents locations in 2007
Fatal accidents locations in 2008
Fatal accidents locations in 2009
Fatal accidents locations in 2010
Fatal accidents locations in 2011
Fatal accidents locations in 2012
Fatal accidents locations in 2013
Fatal accidents locations in 2014
Fatal accidents locations in 2015
Fatal accidents locations in 2016
Fatal accidents locations in 2017
Fatal accidents locations in 2018
Fatal accidents locations in 2019
Fatal accidents locations in 2020
Fatal accidents locations in 2021
Alcohol use - People drinking some alcohol every month (%)
Alcohol use - People not drinking at all (%)
Alcohol use - Average days/month drinking alcohol
Alcohol use - Average drinks/week
Alcohol use - Average days/year people drink much
Audiometry - Average condition of hearing (%)
Audiometry - People that can hear a whisper from across a quiet room (%)
Audiometry - People that can hear normal voice from across a quiet room (%)
Audiometry - Ears ringing, roaring, buzzing (%)
Audiometry - Had a job exposure to loud noise (%)
Audiometry - Had off-work exposure to loud noise (%)
Blood Pressure & Cholesterol - Has high blood pressure (%)
Blood Pressure & Cholesterol - Checking blood pressure at home (%)
Blood Pressure & Cholesterol - Frequently checking blood cholesterol (%)
Blood Pressure & Cholesterol - Has high cholesterol level (%)
Consumer Behavior - Money monthly spent on food at supermarket/grocery store
Consumer Behavior - Money monthly spent on food at other stores
Consumer Behavior - Money monthly spent on eating out
Consumer Behavior - Money monthly spent on carryout/delivered foods
Consumer Behavior - Income spent on food at supermarket/grocery store (%)
Consumer Behavior - Income spent on food at other stores (%)
Consumer Behavior - Income spent on eating out (%)
Consumer Behavior - Income spent on carryout/delivered foods (%)
Current Health Status - General health condition (%)
Current Health Status - Blood donors (%)
Current Health Status - Has blood ever tested for HIV virus (%)
Current Health Status - Left-handed people (%)
Dermatology - People using sunscreen (%)
Diabetes - Diabetics (%)
Diabetes - Had a blood test for high blood sugar (%)
Diabetes - People taking insulin (%)
Diet Behavior & Nutrition - Diet health (%)
Diet Behavior & Nutrition - Milk product consumption (# of products/month)
Diet Behavior & Nutrition - Meals not home prepared (#/week)
Diet Behavior & Nutrition - Meals from fast food or pizza place (#/week)
Diet Behavior & Nutrition - Ready-to-eat foods (#/month)
Diet Behavior & Nutrition - Frozen meals/pizza (#/month)
Drug Use - People that ever used marijuana or hashish (%)
Drug Use - Ever used hard drugs (%)
Drug Use - Ever used any form of cocaine (%)
Drug Use - Ever used heroin (%)
Drug Use - Ever used methamphetamine (%)
Health Insurance - People covered by health insurance (%)
Kidney Conditions-Urology - Avg. # of times urinating at night
Medical Conditions - People with asthma (%)
Medical Conditions - People with anemia (%)
Medical Conditions - People with psoriasis (%)
Medical Conditions - People with overweight (%)
Medical Conditions - Elderly people having difficulties in thinking or remembering (%)
Medical Conditions - People who ever received blood transfusion (%)
Medical Conditions - People having trouble seeing even with glass/contacts (%)
Medical Conditions - People with arthritis (%)
Medical Conditions - People with gout (%)
Medical Conditions - People with congestive heart failure (%)
Medical Conditions - People with coronary heart disease (%)
Medical Conditions - People with angina pectoris (%)
Medical Conditions - People who ever had heart attack (%)
Medical Conditions - People who ever had stroke (%)
Medical Conditions - People with emphysema (%)
Medical Conditions - People with thyroid problem (%)
Medical Conditions - People with chronic bronchitis (%)
Medical Conditions - People with any liver condition (%)
Medical Conditions - People who ever had cancer or malignancy (%)
Mental Health - People who have little interest in doing things (%)
Mental Health - People feeling down, depressed, or hopeless (%)
Mental Health - People who have trouble sleeping or sleeping too much (%)
Mental Health - People feeling tired or having little energy (%)
Mental Health - People with poor appetite or overeating (%)
Mental Health - People feeling bad about themself (%)
Mental Health - People who have trouble concentrating on things (%)
Mental Health - People moving or speaking slowly or too fast (%)
Mental Health - People having thoughts they would be better off dead (%)
Oral Health - Average years since last visit a dentist
Oral Health - People embarrassed because of mouth (%)
Oral Health - People with gum disease (%)
Oral Health - General health of teeth and gums (%)
Oral Health - Average days a week using dental floss/device
Oral Health - Average days a week using mouthwash for dental problem
Oral Health - Average number of teeth
Pesticide Use - Households using pesticides to control insects (%)
Pesticide Use - Households using pesticides to kill weeds (%)
Physical Activity - People doing vigorous-intensity work activities (%)
Physical Activity - People doing moderate-intensity work activities (%)
Physical Activity - People walking or bicycling (%)
Physical Activity - People doing vigorous-intensity recreational activities (%)
Physical Activity - People doing moderate-intensity recreational activities (%)
Physical Activity - Average hours a day doing sedentary activities
Physical Activity - Average hours a day watching TV or videos
Physical Activity - Average hours a day using computer
Physical Functioning - People having limitations keeping them from working (%)
Physical Functioning - People limited in amount of work they can do (%)
Physical Functioning - People that need special equipment to walk (%)
Physical Functioning - People experiencing confusion/memory problems (%)
Physical Functioning - People requiring special healthcare equipment (%)
Prescription Medications - Average number of prescription medicines taking
Preventive Aspirin Use - Adults 40+ taking low-dose aspirin (%)
Reproductive Health - Vaginal deliveries (%)
Reproductive Health - Cesarean deliveries (%)
Reproductive Health - Deliveries resulted in a live birth (%)
Reproductive Health - Pregnancies resulted in a delivery (%)
Reproductive Health - Women breastfeeding newborns (%)
Reproductive Health - Women that had a hysterectomy (%)
Reproductive Health - Women that had both ovaries removed (%)
Reproductive Health - Women that have ever taken birth control pills (%)
Reproductive Health - Women taking birth control pills (%)
Reproductive Health - Women that have ever used Depo-Provera or injectables (%)
Reproductive Health - Women that have ever used female hormones (%)
Sexual Behavior - People 18+ that ever had sex (vaginal, anal, or oral) (%)
Sexual Behavior - Males 18+ that ever had vaginal sex with a woman (%)
Sexual Behavior - Males 18+ that ever performed oral sex on a woman (%)
Sexual Behavior - Males 18+ that ever had anal sex with a woman (%)
Sexual Behavior - Males 18+ that ever had any sex with a man (%)
Sexual Behavior - Females 18+ that ever had vaginal sex with a man (%)
Sexual Behavior - Females 18+ that ever performed oral sex on a man (%)
Sexual Behavior - Females 18+ that ever had anal sex with a man (%)
Sexual Behavior - Females 18+ that ever had any kind of sex with a woman (%)
Sexual Behavior - Average age people first had sex
Sexual Behavior - Average number of female sex partners in lifetime (males 18+)
Sexual Behavior - Average number of female vaginal sex partners in lifetime (males 18+)
Sexual Behavior - Average age people first performed oral sex on a woman (18+)
Sexual Behavior - Average number of woman performed oral sex on in lifetime (18+)
Sexual Behavior - Average number of male sex partners in lifetime (males 18+)
Sexual Behavior - Average number of male anal sex partners in lifetime (males 18+)
Sexual Behavior - Average age people first performed oral sex on a man (18+)
Sexual Behavior - Average number of male oral sex partners in lifetime (18+)
Sexual Behavior - People using protection when performing oral sex (%)
Sexual Behavior - Average number of times people have vaginal or anal sex a year
Sexual Behavior - People having sex without condom (%)
Sexual Behavior - Average number of male sex partners in lifetime (females 18+)
Sexual Behavior - Average number of male vaginal sex partners in lifetime (females 18+)
Sexual Behavior - Average number of female sex partners in lifetime (females 18+)
Sexual Behavior - Circumcised males 18+ (%)
Sleep Disorders - Average hours sleeping at night
Sleep Disorders - People that has trouble sleeping (%)
Smoking-Cigarette Use - People smoking cigarettes (%)
Taste & Smell - People 40+ having problems with smell (%)
Taste & Smell - People 40+ having problems with taste (%)
Taste & Smell - People 40+ that ever had wisdom teeth removed (%)
Taste & Smell - People 40+ that ever had tonsils teeth removed (%)
Taste & Smell - People 40+ that ever had a loss of consciousness because of a head injury (%)
Taste & Smell - People 40+ that ever had a broken nose or other serious injury to face or skull (%)
Taste & Smell - People 40+ that ever had two or more sinus infections (%)
Weight - Average height (inches)
Weight - Average weight (pounds)
Weight - Average BMI
Weight - People that are obese (%)
Weight - People that ever were obese (%)
Weight - People trying to lose weight (%)
61,047 55.9% White alone 40,291 36.9% Hispanic 2,862 2.6% Black alone 2,633 2.4% Two or more races 811 0.7% American Indian alone 811 0.7% Asian alone 748 0.7% Other race alone
The City-Data.com crime index weighs serious crimes and violent crimes more heavily. Higher means more crime, U.S. average is 246.1. It adjusts for the number of visitors and daily workers commuting into cities.
- means the value is smaller than the state average.
- means the value is about the same as the state average.
- means the value is bigger than the state average.
- means the value is much bigger than the state average.
Crime rate in Greeley detailed stats: murders, rapes, robberies, assaults, burglaries, thefts, arson Officers per 1,000 residents here:
1.35Colorado average:
2.14
Latest news from Greeley, CO collected exclusively by city-data.com from local newspapers, TV, and radio stations
Ancestries: German (10.7%), American (5.9%), English (4.1%), European (3.6%), Irish (3.0%), Italian (1.7%).
Current Local Time:
Incorporated on 11/15/1885
Land area: 29.9 square miles.
Population density: 3,652 people per square mile (average).
13,492 residents are foreign born (9.6% Latin America , 1.2% Africa ).
This city:
11.8%Colorado:
9.5%
Median real estate property taxes paid for housing units with mortgages in 2022: $1,624 (0.4%)Median real estate property taxes paid for housing units with no mortgage in 2022: $1,661 (0.4%)
Nearest city with pop. 200,000+: West Adams, CO (40.0 miles
Nearest city with pop. 1,000,000+: Phoenix, AZ
Nearest cities:
Latitude: 40.42 N, Longitude: 104.72 W
Greeley nicknames or aliases (official or unofficial):
James Michener's Home in the West, Sayyid Qutb's Sodom and GomorrahDaytime population change due to commuting: +2,802 (+2.6%)Workers who live and work in this city: 29,009 (54.2%)
Greeley tourist attractions:
Single-family new house construction building permits:
2022: 345 buildings , average cost: $307,3002021: 315 buildings , average cost: $301,2002020: 85 buildings , average cost: $246,4002019: 170 buildings , average cost: $252,5002018: 348 buildings , average cost: $235,1002017: 120 buildings , average cost: $240,7002016: 263 buildings , average cost: $208,4002015: 513 buildings , average cost: $160,0002014: 361 buildings , average cost: $163,1002013: 203 buildings , average cost: $147,7002012: 56 buildings , average cost: $156,0002011: 40 buildings , average cost: $150,2002010: 85 buildings , average cost: $142,7002009: 46 buildings , average cost: $140,7002008: 90 buildings , average cost: $138,3002007: 168 buildings , average cost: $160,4002006: 352 buildings , average cost: $157,6002005: 793 buildings , average cost: $147,1002004: 735 buildings , average cost: $147,4002003: 793 buildings , average cost: $140,8002002: 812 buildings , average cost: $125,8002001: 683 buildings , average cost: $122,8002000: 682 buildings , average cost: $113,8001999: 717 buildings , average cost: $106,5001998: 537 buildings , average cost: $112,4001997: 490 buildings , average cost: $101,000Unemployment in December 2023:
Population change in the 1990s: +16,368 (+27.0%).
Most common occupations in Greeley, CO (%)
Both Males Females
Cooks and food preparation workers (8.0%)
Building and grounds cleaning and maintenance occupations (4.3%)
Other management occupations, except farmers and farm managers (4.2%)
Driver/sales workers and truck drivers (2.7%)
Other office and administrative support workers, including supervisors (2.6%)
Laborers and material movers, hand (2.5%)
Material recording, scheduling, dispatching, and distributing workers (2.5%)
Cooks and food preparation workers (7.7%)
Building and grounds cleaning and maintenance occupations (5.0%)
Driver/sales workers and truck drivers (4.6%)
Other management occupations, except farmers and farm managers (4.4%)
Electrical equipment mechanics and other installation, maintenance, and repair workers, including supervisors (3.9%)
Other production occupations, including supervisors (3.3%)
Material recording, scheduling, dispatching, and distributing workers (3.3%)
Cooks and food preparation workers (8.5%)
Other office and administrative support workers, including supervisors (5.1%)
Nursing, psychiatric, and home health aides (4.3%)
Information and record clerks, except customer service representatives (4.2%)
Secretaries and administrative assistants (4.0%)
Other management occupations, except farmers and farm managers (4.0%)
Cashiers (3.8%)
Tornado activity:
Greeley-area historical tornado activity is above Colorado state average. It is 31% greater than the overall U.S. average.
On 5/15/1952, a category F3 (max. wind speeds 158-206 mph) tornado 10.0 miles away from the Greeley city center injured 5 people and caused between $5000 and $50,000 in damages.
On 5/22/2008, a category F3 tornado 12.9 miles away from the city center killed one person and injured 78 people and caused $147 million in damages.
Earthquake activity:
Greeley-area historical earthquake activity is significantly above Colorado state average. It is 620% greater than the overall U.S. average. On 8/18/1959 at 06:37:13, a magnitude 7.7 (7.7 UK, Class: Major, Intensity: VIII - XII) earthquake occurred 416.8 miles away from the city center, causing $26,000,000 total damage On 10/18/1984 at 15:30:23, a magnitude 5.5 (5.4 MB, 5.1 MS, 5.5 ML, Class: Moderate, Intensity: VI - VII) earthquake occurred 143.8 miles away from the city center On 10/28/1983 at 14:06:06, a magnitude 7.3 (6.2 MB, 7.3 MS, 7.0 MW) earthquake occurred 528.9 miles away from Greeley center, causing 2 deaths ( 2 shaking deaths) and 3 injuries, causing $15,000,000 total damage On 8/23/2011 at 05:46:18, a magnitude 5.3 (5.3 MW, Depth: 2.5 mi) earthquake occurred 231.9 miles away from Greeley center On 3/28/1975 at 02:31:05, a magnitude 6.2 (6.1 MB, 6.0 MS, 6.2 ML, Class: Strong, Intensity: VII - IX) earthquake occurred 418.0 miles away from Greeley center On 2/3/1995 at 15:26:10, a magnitude 5.3 (5.3 MB, 4.6 MS, Depth: 0.6 mi) earthquake occurred 268.0 miles away from the city center Magnitude types: body-wave magnitude (MB), local magnitude (ML), surface-wave magnitude (MS), moment magnitude (MW) Natural disasters: The number of natural disasters in Weld County (15) is near the US average (15).Major Disasters (Presidential) Declared: 11Emergencies Declared: 3Storms: 8, Floods: 7, Landslides: 3, Mudslides: 3, Tornadoes: 2, Fire: 1, Flash Flood: 1, Heavy Rain: 1, Hurricane: 1, Snow: 1, Snowstorm: 1, Other: 2 (Note: some incidents may be assigned to more than one category). Main business address for: UAP HOLDING CORP AGRICULTURE CHEMICALS ).
Hospitals in Greeley: HOSPICE AND PALLIATIVE CARE OF NORTHERN COLORADO (2726 WEST 11TH STREET ROAD) NORTH COLORADO MEDICAL CENTER (Voluntary non-profit - Private, 1801 16TH STREET) Nursing Homes in Greeley: CENTENNIAL HEALTH CARE CENTER (1637 29TH AVENUE PLACE) FAIRACRES MANOR, INC. (1700 18TH AVENUE) GOOD SAMARITAN SOCIETY - BONELL COMMUNITY (708 22ND STREET) GRACE POINTE CONTINUING CARE SR CAMPUS SKILLED NUR (1919 68TH AVENUE) KENTON MANOR (850 27TH AVENUE) LIFE CARE CENTER OF GREELEY (4800 W 25TH STREET) Dialysis Facilities in Greeley: GREELEY DIALYSIS (FMC) (2343 W 27TH ST STE 503) Home Health Centers in Greeley: BANNER HOME CARE COLORADO (5628 W 19TH STREET SUITE 1) CARING HEARTS II, LLC (6801 WEST 20TH STREET #207) GREELEY CENTER FOR INDEPENDENCE INC (2780 28TH AVENUE) REHABILITATION AND VISITING NURSE ASSOCIATION (2105 CLUBHOUSE DRIVE) TOUCHSTONE HOME HEALTH LLC (5312 W 9TH STREET DRIVE SUITE 120) Airports and heliports located in Greeley: Greeley-Weld County Airport (GXY) Runways: , Itinerant Ops: 57,500, Local Ops: 84,500, Military Ops: 1,000)Easton/Valley View/ Airport (11V) Runways: , Air Taxi Ops: 10, Itinerant Ops: 667, Local Ops: 2,223)Ncmc Heliport (98CO) See details about Airports and heliports located in Greeley, CO Amtrak station near Greeley: 18 miles: LOVELAND (1027 E. EISENHOWER BLVD.) - Bus Station
Colleges/Universities in Greeley: University of Northern Colorado Full-time enrollment: 11,469; Location: Carter Hall - Rm 4000; Public; Website: www.unco.edu; Offers Doctor's degree )
Aims Community College Full-time enrollment: 3,598; Location: 5401 W. 20th St.; Public; Website: www.aims.edu)
Cheeks International Academy of Beauty Culture-Greeley Full-time enrollment: 46; Location: 2547b 11th Ave; Private, for-profit; Website: cheeksUSA.com)
Academy of Natural Therapy Inc Full-time enrollment: 42; Location: 625 8th Ave; Private, for-profit; Website: www.natural-therapy.com)
Other colleges/universities with over 2000 students near Greeley:
Colorado State University-Fort Collins (about 22 miles; Fort Collins, CO ; Full-time enrollment: 25,099)
Front Range Community College (about 40 miles; Westminster, CO ; FT enrollment: 14,756)
University of Colorado Boulder (about 41 miles; Boulder, CO ; FT enrollment: 28,328)
Regis University (about 47 miles; Denver, CO ; FT enrollment: 6,975)
Laramie County Community College (about 48 miles; Cheyenne, WY ; FT enrollment: 3,288)
Community College of Aurora (about 49 miles; Aurora, CO ; FT enrollment: 4,730)
University of Colorado Denver (about 49 miles; Denver, CO ; FT enrollment: 14,727)
Biggest public high schools in Greeley: GREELEY WEST HIGH SCHOOL Students: 1,503, Location: 2401 35TH AVENUE, Grades: 9-12)GREELEY CENTRAL HIGH SCHOOL Students: 1,373, Location: 1515 14TH AVENUE, Grades: 9-12)NORTHRIDGE HIGH SCHOOL Students: 1,205, Location: 100 71ST AVENUE, Grades: 9-12)FRONTIER CHARTER ACADEMY Students: 1,049, Location: 2560 WEST 29TH STREET, Grades: KG-12, Charter school )UNIVERSITY SCHOOLS Students: 1,022, Location: 6525 18TH STREET, Grades: KG-12, Charter school )JEFFERSON HIGH SCHOOL Students: 386, Location: 1315 4TH AVENUE, Grades: 9-12)UNION COLONY PREPARATORY SCHOOL Students: 356, Location: 2000 CLUBHOUSE DRIVE, Grades: 6-12, Charter school )CENTENNIAL BOCES HIGH SCHOOL Students: 37, Location: 2020 CLUBHOUSE DRIVE, Grades: 11-12)WEST RIDGE ACADEMY Location: 6200 WEST 20TH STREET, Grades: KG-9, Charter school )
ENGAGE ONLINE ACADEMY Location: 1424 13TH AVENUE, Grades: KG-12)
Private high school in Greeley: DAYSPRING CHRISTIAN ACADEMY Students: 369, Location: 3734 W 20TH ST, Grades: UG-12)
Biggest public elementary/middle schools in Greeley: HEATH MIDDLE SCHOOL Students: 800, Location: 2223 16TH STREET, Grades: 6-8)JOHN EVANS MIDDLE SCHOOL Students: 605, Location: 2900 15TH AVENUE, Grades: 6-8)MONFORT ELEMENTARY SCHOOL Students: 571, Location: 2101 47TH AVENUE, Grades: KG-6)MCAULIFFE ELEMENTARY SCHOOL Students: 553, Location: 600 51ST AVENUE, Grades: KG-5)BRENTWOOD MIDDLE SCHOOL Students: 536, Location: 2600 24TH AVENUE COURT, Grades: 6-8)FRANKLIN MIDDLE SCHOOL Students: 492, Location: 818 35TH AVENUE, Grades: 6-8)SHAWSHEEN ELEMENTARY SCHOOL Students: 477, Location: 4020 WEST 7TH STREET, Grades: KG-5)WINOGRAD K-8 ELEMENTARY SCHOOL Students: 462, Location: 320 NORTH 71ST AVENUE, Grades: KG-8)MAPLEWOOD ELEMENTARY SCHOOL Students: 403, Location: 1201 21ST AVENUE, Grades: KG-5)JACKSON ELEMENTARY SCHOOL Location: 2002 25TH STREET, Grades: KG-5)
Private elementary/middle schools in Greeley: ST MARY'S CATHOLIC SCHOOL Students: 185, Location: 2351 22ND AVE, Grades: KG-8)
ADVENTIST CHRISTIAN SCHOOL Students: 47, Location: 612 23RD AVE, Grades: KG-8)
TRINITY LUTHERAN SCHOOL Students: 47, Location: 3000 35TH AVE, Grades: PK-8)
See full list of schools located in Greeley Library in Greeley: HIGH PLAINS LIBRARY DISTRICT Operating income: $15,545,355; Location: 1939 61ST AVENUE; 702,032 books ; 3,830 e-books ; 38,991 audio materials ; 48,667 video materials ; 33 local licensed databases ; 27 state licensed databases ; 9 other licensed databases ; 587 print serial subscriptions )
User-submitted facts and corrections:
Private Schools: Dayspring Christian Academy - 300 students grades K-12 - 3734 W. 20th St., Greeley, CO 80634 (970)330-1151 added by Dennis
Notable locations in Greeley: (A) , Plain View School (B) , North Colorado Medical Evacuation (C) , Greeley Fire Department Station 5 (D) , Greeley Fire Department Station 4 (E) , Greeley Fire Department Station 3 (F) , Greeley Fire Department Station 2 (G) , Greeley Fire Department Station 7 (H) , Greeley Fire Department Station 1 (I) , Weld County Paramedic Services Station 1 (J) , Meeker Memorial Museum (K) . Display/hide their locations on the map
Main business address in Greeley: (A) . Display/hide its location on the map
Cemetery: (1) . Display/hide its location on the map
Reservoirs: (A) , Neuman Lake (B) , Neill Brothers Reservoir (C) , Cottonwood Lake (D) , West Greeley (E) . Display/hide their locations on the map
Parks in Greeley include: (1) , Glenmere Park (2) , Montview Park (3) , Lincoln Park (4) , Island Grove Park (5) , Luther Park (6) , Broadview Park (7) . Display/hide their locations on the map
Tourist attractions: (1) , Centennial Village Museum (1475 A Street) (2) , Selma's Store at Centennial Village (Cultural Attractions- Events- & Facilities; 14 Avenue & A Street) (3) , Greeley City Services - Appearance Dates- Court-City of Greeley (Cultural Attractions- Events- & Facilities; 701 10th Avenue) (4) , Greeley City Services - Court-City of Greeley (Cultural Attractions- Events- & Facilities; 919 7th Street) (5) , Meeker Home Museum (Cultural Attractions- Events- & Facilities; 1324 9th Avenue) (6) , Kic's Amusements (Amusement & Theme Parks; 6380 West 10th Street) (7) , Classic Lanes (Amusement & Theme Parks; 2454 8th Avenue) (8) , Beyond Belief Laser Storm Arcade (Amusement & Theme Parks; 2393 West 27th Street Suite 528) (9) . Display/hide their approximate locations on the map
Hotels: (1) , Best Western Regency Hotel (701 8th Street) (2) , Greeley Inn (721 13th Street) (3) , Business Homes of Greeley (1206 10th Street) (4) , Greeley Guest House LLC (5401 West 9th Street) (5) , Inn Towne Motel (1803 9th Street) (6) , Days Inn Greeley CO (5630 West 10th Street) (7) , First Class Motors (2501 West 10th Street) (8) , Country Inn-Suites Greeley (2501 West 29th Street) (9) . Display/hide their approximate locations on the map
Courts: (1) , Colorado State - Alternate Defense Counsel (822 7th Street) (2) . Display/hide their approximate locations on the map
Birthplace of: Johnny Lindell - Baseball player, Marilyn Musgrave - Politician, Scott Renfroe - Politician, Shane Carwin - Martial artist, Marguerite Roberts - Screenwriter, Polly Baca - Politician, Reed Doughty - Football player, Tom Runnells - Baseball player and coach, Jason Smith - College basketball player (Colorado State Rams), Jeff Eastin - Screenwriter.
Weld County has a predicted average indoor radon screening level greater than 4 pCi/L (pico curies per liter) - Highest Potential Drinking water stations with addresses in Greeley and their reported violations in the past:
GREELEY CITY OF (Population served: 91,109, Surface water):
Past monitoring violations:
Monitoring and Reporting (DBP) - Between JUL-2013 and SEP-2013, Contaminant: TTHM. Follow-up actions: St Public Notif requested (NOV-13-2013), St Violation/Reminder Notice (NOV-13-2013), St Compliance achieved (FEB-01-2014), St Public Notif received (MAR-27-2014)
Monitoring and Reporting (DBP) - Between JUL-2013 and SEP-2013, Contaminant: Total Haloacetic Acids (HAA5). Follow-up actions: St Public Notif requested (NOV-13-2013), St Violation/Reminder Notice (NOV-13-2013), St Public Notif received (MAR-27-2014), St Compliance achieved (JUN-05-2014)
Monitoring, Turbidity (Enhanced SWTR) - In JUL-2012, Contaminant: IESWTR. Follow-up actions: St Public Notif requested (SEP-07-2012), St Violation/Reminder Notice (SEP-07-2012), St Public Notif received (JUL-09-2013), St Compliance achieved (JUN-05-2014)
Population served: 6,481, Purch surface water):
Past health violations:
MCL, Acute (TCR) - In JUL-2011, Contaminant: Coliform. Follow-up actions: St Public Notif received (JUL-15-2011), St Public Notif requested (JUL-18-2011), St Violation/Reminder Notice (JUL-18-2011), St Compliance achieved (JAN-31-2012)
Average household size: This city:
2.6 peopleColorado:
2.5 people
Percentage of family households: This city:
63.6%Whole state:
63.9%
Percentage of households with unmarried partners: This city:
6.9%Whole state:
6.5%
Likely homosexual households (counted as self-reported same-sex unmarried-partner households)
Lesbian couples: 0.4% of all households Gay men: 0.3% of all households
People in group quarters in Greeley in 2010:
3,055 people in college/university student housing
627 people in nursing facilities/skilled-nursing facilities
549 people in local jails and other municipal confinement facilities
243 people in correctional facilities intended for juveniles
194 people in correctional residential facilities
56 people in other noninstitutional facilities
44 people in group homes intended for adults
41 people in emergency and transitional shelters (with sleeping facilities) for people experiencing homelessness
30 people in residential treatment centers for adults
14 people in residential treatment centers for juveniles (non-correctional)
People in group quarters in Greeley in 2000:
2,833 people in college dormitories (includes college quarters off campus)
658 people in nursing homes
262 people in other types of correctional institutions
256 people in local jails and other confinement facilities (including police lockups)
149 people in other noninstitutional group quarters
22 people in homes or halfway houses for drug/alcohol abuse
20 people in other group homes
16 people in homes for the mentally ill
4 people in homes for the mentally retarded
Banks with most branches in Greeley (2011 data):
Wells Fargo Bank, National Association: Westlake Branch, Centerplace And 47th Branch, Greeley Branch, Univ. Of Northern Colorado Branch, West Greeley Branch, Cottonwood Square Branch. Info updated 2011/04/05: Bank assets: $1,161,490.0 mil, Deposits: $905,653.0 mil, headquarters in Sioux Falls, SD, positive income , 6395 total offices , Holding Company: Wells Fargo & Company
JPMorgan Chase Bank, National Association: Greeley Commons Banking Ctr. Branch, West Greeley Branch, Greeley Downtown Branch. Info updated 2011/11/10: Bank assets: $1,811,678.0 mil, Deposits: $1,190,738.0 mil, headquarters in Columbus, OH, positive income , International Specialization, 5577 total offices , Holding Company: Jpmorgan Chase & Co.
U.S. Bank National Association: Northgate Village King Soopers, Centerplace Drive Safeway, Greeley Branch. Info updated 2012/01/30: Bank assets: $330,470.8 mil, Deposits: $236,091.5 mil, headquarters in Cincinnati, OH, positive income , 3121 total offices , Holding Company: U.S. Bancorp
Academy Bank, National Association: Greeley Branch at 3103 23rd Avenue, branch established on 2001/06/25; 47th Avenue Branch at 920 47th Avenue, branch established on 2005/03/15. Info updated 2008/06/10: Bank assets: $282.1 mil, Deposits: $218.0 mil, headquarters in Colorado Springs, CO, positive income , Commercial Lending Specialization, 54 total offices , Holding Company: Dickinson Financial Corporation Ii
Cache Bank and Trust: Downtown Greeley Branch at 924 11th Street, branch established on 2001/06/01; Cache Bank And Trust at 4601 West 20th Street, branch established on 1996/10/11. Info updated 2006/11/03: Bank assets: $167.3 mil, Deposits: $152.0 mil, local headquarters , positive income , Commercial Lending Specialization, 5 total offices
Guaranty Bank and Trust Company: Downtown Greeley at 930 11th Avenue, branch established on 1997/10/15; West Greeley Branch at 2700 47th Ave, branch established on 1994/12/13. Info updated 2010/12/21: Bank assets: $1,687.8 mil, Deposits: $1,331.8 mil, headquarters in Denver, CO, positive income , Commercial Lending Specialization, 34 total offices , Holding Company: Guaranty Bancorp
Bank Midwest, National Association: West Greeley Branch at 7251 West 20th Street, Building A, branch established on 2002/04/01; Greeley Branch at 3780 West 10th Street, branch established on 1896/01/01. Info updated 2012/03/19: Bank assets: $6,237.6 mil, Deposits: $5,064.6 mil, headquarters in Kansas City, MO, positive income , 138 total offices , Holding Company: Nbh Holdings Corp.
First National Bank of Omaha: West Greeley Branch at 920 54th Avenue, branch established on 1996/12/23; Union Colony Bank Branch at 1701 23rd Avenue, branch established on 1979/05/21. Info updated 2010/10/13: Bank assets: $13,433.1 mil, Deposits: $10,746.6 mil, headquarters in Omaha, NE, positive income , Commercial Lending Specialization, 102 total offices , Holding Company: Lauritzen Corporation
FirstBank: 47th And 10th Branch at 4322 West 9th Street, branch established on 2003/07/21; Firstbank Of Greeley Branch at 2901 -23rd Avenue, branch established on 2007/08/03. Info updated 2011/12/05: Bank assets: $11,597.1 mil, Deposits: $10,530.4 mil, headquarters in Lakewood, CO, positive income , Mortgage Lending Specialization, 130 total offices , Holding Company: Firstbank Holding Company
10 other banks with 10 local branches
For population 15 years and over in Greeley:
Never married: 36.4%Now married: 45.5%Separated: 1.8%Widowed: 4.4%Divorced: 11.8% For population 25 years and over in Greeley:
High school or higher: 84.7%Bachelor's degree or higher: 29.0%Graduate or professional degree: 10.9%Unemployed: 7.2%Mean travel time to work (commute): 24.7 minutes
Education Gini index (Inequality in education) Here:
14.8Colorado average:
11.1
Religion statistics for Greeley, CO (based on Weld County data)
Religion Adherents Congregations Catholic 34,138 14 Evangelical Protestant 23,467 133 Mainline Protestant 9,810 36 Other 5,365 21 Orthodox 35 1 None 180,010 -
Source: Clifford Grammich, Kirk Hadaway, Richard Houseal, Dale E.Jones, Alexei Krindatch, Richie Stanley and Richard H.Taylor. 2012. 2010 U.S.Religion Census: Religious Congregations & Membership Study. Association of Statisticians of American Religious Bodies. Jones, Dale E., et al. 2002. Congregations and Membership in the United States 2000. Nashville, TN: Glenmary Research Center. Graphs represent county-level data
Food Environment Statistics: Number of grocery stores : 25Weld County :
1.03 / 10,000 pop.Colorado :
1.50 / 10,000 pop.
Number of supercenters and club stores : 3This county :
0.12 / 10,000 pop.Colorado :
0.15 / 10,000 pop.
Number of convenience stores (no gas) : 1Weld County :
0.04 / 10,000 pop.State :
0.45 / 10,000 pop.
Number of convenience stores (with gas) : 68Weld County :
2.80 / 10,000 pop.State :
3.13 / 10,000 pop.
Number of full-service restaurants : 140This county :
5.77 / 10,000 pop.State :
8.99 / 10,000 pop.
Adult diabetes rate : This county :
5.3%Colorado :
5.3%
Adult obesity rate : Weld County :
23.0%Colorado :
18.4%
Low-income preschool obesity rate : Weld County :
11.5%Colorado :
9.6%
Health and Nutrition: Healthy diet rate : This city:
47.3%Colorado:
49.4%
Average overall health of teeth and gums : People feeling badly about themselves : This city:
21.5%State:
20.7%
People not drinking alcohol at all : This city:
10.3%Colorado:
9.7%
Average hours sleeping at night : Overweight people : Greeley:
31.6%Colorado:
33.3%
General health condition : This city:
55.7%Colorado:
57.3%
Average condition of hearing : More about Health and Nutrition of Greeley, CO Residents
Local government employment and payroll (March 2022)
Function
Full-time employees
Monthly full-time payroll
Average yearly full-time wage
Part-time employees
Monthly part-time payroll
Police Protection - Officers
133 $1,064,312 $96,028 12 $6,151 Firefighters
120 $975,362 $97,536 0 $0 Parks and Recreation
119 $803,350 $81,010 83 $84,175 Water Supply
110 $637,181 $69,511 8 $24,703 Streets and Highways
82 $550,607 $80,577 8 $26,660 Police - Other
81 $592,775 $87,819 5 $2,792 Transit
56 $232,469 $49,815 10 $16,065 Financial Administration
55 $353,212 $77,064 1 $2,668 Other Government Administration
47 $300,585 $76,745 1 $2,583 Natural Resources
45 $286,695 $76,452 0 $0 Judicial and Legal
23 $178,274 $93,013 1 $2,148 Sewerage
19 $110,984 $70,095 0 $0 Fire - Other
10 $91,435 $109,722 0 $0 Housing and Community Development (Local)
6 $48,400 $96,800 0 $0
Totals for Government
906 $6,225,639 $82,459 129 $167,945
Greeley government finances - Expenditure in 2021 (per resident):
Construction - Water Utilities: $32,509,000 ($297.68)
Sewerage: $17,301,000 ($158.42)Regular Highways: $15,603,000 ($142.87)General Public Buildings: $12,182,000 ($111.55)Parks and Recreation: $5,448,000 ($49.89)Local Fire Protection: $104,000 ($0.95)Transit Utilities: $68,000 ($0.62)Police Protection: $3,000 ($0.03)Current Operations - Police Protection: $27,776,000 ($254.34)
Parks and Recreation: $19,463,000 ($178.22)Local Fire Protection: $16,444,000 ($150.57)Water Utilities: $14,545,000 ($133.18)Central Staff Services: $11,664,000 ($106.80)Regular Highways: $11,460,000 ($104.94)Housing and Community Development: $9,023,000 ($82.62)Sewerage: $8,168,000 ($74.79)Financial Administration: $5,341,000 ($48.91)Transit Utilities: $4,371,000 ($40.02)General Public Buildings: $3,039,000 ($27.83)Judicial and Legal Services: $3,021,000 ($27.66)General - Other: $2,606,000 ($23.86)Protective Inspection and Regulation - Other: $1,151,000 ($10.54)Natural Resources - Other: $876,000 ($8.02)Miscellaneous Commercial Activities - Other: $644,000 ($5.90)Solid Waste Management: $268,000 ($2.45)Public Welfare, Vendor Payments for Other Purposes: $196,000 ($1.79)Health - Other: $53,000 ($0.49)Parking Facilities: $39,000 ($0.36)General - Interest on Debt: $2,479,000 ($22.70)
Intergovernmental to Local - Other - Police Protection: $130,000 ($1.19)
Other - Housing and Community Development: $114,000 ($1.04)Other - Parks and Recreation: $12,000 ($0.11)Other Capital Outlay - Transit Utilities: $2,456,000 ($22.49)
Water Utilities: $740,000 ($6.78)Local Fire Protection: $677,000 ($6.20)Sewerage: $394,000 ($3.61)Parks and Recreation: $347,000 ($3.18)Regular Highways: $95,000 ($0.87)General Public Building: $93,000 ($0.85)Financial Administration: $71,000 ($0.65)Police Protection: $45,000 ($0.41)Total Salaries and Wages: $65,894,000 ($603.38)
Water Utilities - Interest on Debt: $2,600,000 ($23.81)
Greeley government finances - Revenue in 2021 (per resident):
Charges - Sewerage: $21,454,000 ($196.45)
Parks and Recreation: $7,865,000 ($72.02)Regular Highways: $5,099,000 ($46.69)Other: $2,121,000 ($19.42)Miscellaneous Commercial Activities: $293,000 ($2.68)Parking Facilities: $85,000 ($0.78)Natural Resources - Other: $6,000 ($0.05)Federal Intergovernmental - Transit Utilities: $4,152,000 ($38.02)
Housing and Community Development: $1,374,000 ($12.58)Other: $249,000 ($2.28)Sewerage: $2,000 ($0.02)Local Intergovernmental - Other: $2,313,000 ($21.18)
Highways: $1,065,000 ($9.75)Transit Utilities: $12,000 ($0.11)Water Utilities: $11,000 ($0.10)Miscellaneous - Royalties: $6,702,000 ($61.37)
Interest Earnings: $2,165,000 ($19.82)Fines and Forfeits: $1,968,000 ($18.02)General Revenue - Other: $1,580,000 ($14.47)Rents: $1,279,000 ($11.71)Donations From Private Sources: $227,000 ($2.08)Special Assessments: $18,000 ($0.16)Revenue - Water Utilities: $42,556,000 ($389.67)
Transit Utilities: $960,000 ($8.79)State Intergovernmental - Highways: $7,991,000 ($73.17)
Other: $3,603,000 ($32.99)Sewerage: $330,000 ($3.02)General Local Government Support: $217,000 ($1.99)Transit Utilities: $134,000 ($1.23)Water Utilities: $28,000 ($0.26)Tax - General Sales and Gross Receipts: $99,814,000 ($913.97)
Property: $23,141,000 ($211.90)Public Utility License: $5,674,000 ($51.96)Occupation and Business License - Other: $3,798,000 ($34.78)Other Selective Sales: $761,000 ($6.97)Motor Vehicle License: $371,000 ($3.40)Alcoholic Beverage License: $249,000 ($2.28)Public Utilities Sales: $72,000 ($0.66)Other License: $17,000 ($0.16)
Greeley government finances - Debt in 2021 (per resident):
Long Term Debt - Beginning Outstanding - Unspecified Public Purpose: $155,172,000 ($1420.87)
Outstanding Unspecified Public Purpose: $143,616,000 ($1315.06)Beginning Outstanding - Public Debt for Private Purpose: $22,305,000 ($204.24)Outstanding Nonguaranteed - Industrial Revenue: $22,305,000 ($204.24)Retired Unspecified Public Purpose: $11,556,000 ($105.82)
Greeley government finances - Cash and Securities in 2021 (per resident):
Bond Funds - Cash and Securities: $35,985,000 ($329.51)
Other Funds - Cash and Securities: $249,077,000 ($2280.74)
Sinking Funds - Cash and Securities: $34,182,000 ($313.00)
Businesses in Greeley, CO
Name Count Name Count
7-Eleven 6 Lowe's 1 AT&T 4 Marriott 1 Ace Hardware 3 MasterBrand Cabinets 4 Advance Auto Parts 2 Maurices 1 Applebee's 1 Mazda 1 Arby's 1 McDonald's 4 AutoZone 2 New Balance 2 Bath & Body Works 1 Nike 8 Bed Bath & Beyond 1 Nissan 1 Blockbuster 2 Office Depot 1 Buffalo Wild Wings 1 OfficeMax 1 Burger King 3 Olive Garden 1 Carl\s Jr. 2 Panda Express 1 Chevrolet 1 Papa John's Pizza 2 Chipotle 1 Payless 2 Chuck E. Cheese's 1 Penske 1 Clarion 1 PetSmart 1 Cold Stone Creamery 1 Pizza Hut 2 Comfort Inn 1 Plato's Closet 1 Cricket Wireless 5 Qdoba Mexican Grill 2 Curves 2 Quiznos 2 Dairy Queen 3 RadioShack 2 Decora Cabinetry 1 Red Lobster 1 Discount Tire 1 Red Robin 1 Domino's Pizza 2 Rite Aid 1 DressBarn 1 SAS Shoes 1 Dressbarn 1 SONIC Drive-In 1 Famous Footwear 1 Safeway 3 FedEx 9 Sears 2 Finish Line 1 Spencer Gifts 1 Firestone Complete Auto Care 1 Starbucks 8 Foot Locker 1 Subaru 1 Ford 1 Subway 7 GNC 4 Super 8 1 GameStop 3 T-Mobile 7 H&R Block 2 T.G.I. Driday's 1 Hilton 1 Taco Bell 3 Hobby Lobby 1 Target 1 Holiday Inn 1 Toyota 1 Home Depot 1 True Value 1 Honda 1 U-Haul 9 IHOP 1 UPS 12 JCPenney 1 Vans 3 Jimmy John's 2 Verizon Wireless 2 Jones New York 3 Victoria's Secret 1 Journeys 1 Village Inn 2 KFC 2 Volkswagen 1 Kohl's 1 Vons 3 Kroger 3 Walgreens 3 Lane Furniture 1 Walmart 2 Little Caesars Pizza 1 Wendy's 3 Long John Silver's 1
Strongest AM radio stations in Greeley:
KFKA (1310 AM; 5 kW; GREELEY, CO; Owner: MUSIC VENTURES, LLC, DBA BROADCAST MEDIA LLC)
KGRE (1450 AM; 1 kW; GREELEY, CO; Owner: GREELEY BROADCASTING CORPORATION)
KHNC (1360 AM; 10 kW; JOHNSTOWN, CO; Owner: DONALD A. AND SHARON E. WIEDEMAN)
KLTT (670 AM; 50 kW; COMMERCE CITY, CO; Owner: KLZ RADIO, INC.)
KKZN (760 AM; 50 kW; THORNTON, CO; Owner: JACOR BROADCASTING OF COLORADO, INC.)
KLMO (1060 AM; 30 kW; LONGMONT, CO; Owner: PILGRIM COMMUNICATIONS, INC.)
KMXA (1090 AM; 50 kW; AURORA, CO; Owner: ENTRAVISION HOLDINGS, LLC)
KOA (850 AM; 50 kW; DENVER, CO; Owner: JACOR BROADCASTING OF COLORADO, INC.)
KCOL (600 AM; 5 kW; WELLINGTON, CO; Owner: JACOR BROADCASTING OF COLORADO, INC.)
KJJD (1170 AM; daytime; 1 kW; WINDSOR, CO; Owner: RODRIGUEZ-GALLEGOS BROADCASTING CORPORATION)
KSIR (1010 AM; 25 kW; BRUSH, CO; Owner: JMS BROADCASTING, LLC)
KIIX (1410 AM; 5 kW; FORT COLLINS, CO; Owner: JACOR BROADCASTING OF COLORADO, INC.)
KNUS (710 AM; 5 kW; DENVER, CO; Owner: SALEM MEDIA OF COLORADO, INC.)
Strongest FM radio stations in Greeley:
KUAD-FM (99.1 FM; WINDSOR, CO; Owner: REGENT BROADCASTING OF FT. COLLINS, INC.)
K206DB (89.1 FM; FORT COLLINS, ETC., CO; Owner: BOULDER COMMUNITY B/CAST ASSOC., INC)
KJCD (104.3 FM; LONGMONT, CO; Owner: JEFFERSON-PILOT COMMUNICATIONS COMPANY OF COLORADO)
KTRR (102.5 FM; LOVELAND, CO; Owner: REGENT BROADCASTING OF FT. COLLINS, INC.)
KSME (96.1 FM; GREELEY, CO; Owner: JACOR BROADCASTING OF COLORADO, INC.)
KDJM (92.5 FM; BROOMFIELD, CO; Owner: INFINITY RADIO OPERATIONS INC.)
KUNC-FM (91.5 FM; GREELEY, CO; Owner: COMMUNITY RADIO FOR NORTHERN COLORADO)
KTCL (93.3 FM; FORT COLLINS, CO; Owner: JACOR BROADCASTING OF COLORADO, INC.)
KRKS-FM (94.7 FM; LAFAYETTE, CO; Owner: SALEM MEDIA OF COLORADO, INC)
KPAW (107.9 FM; FORT COLLINS, CO; Owner: JACOR BROADCASTING OF COLORADO, INC.)
KBRU-FM (101.7 FM; FORT MORGAN, CO; Owner: ON-AIR FAMILY, LLC)
KBCO-FM (97.3 FM; BOULDER, CO; Owner: CITICASTERS LICENSES, L.P.)
KQMT (99.5 FM; DENVER, CO; Owner: ENTERCOM DENVER LICENSE, LLC)
KSIR-FM1 (107.1 FM; HUDSON, CO; Owner: KKDD-FM BROADCASTERS)
KALC (105.9 FM; DENVER, CO; Owner: ENTERCOM DENVER LICENSE, LLC)
KBPI (106.7 FM; DENVER, CO; Owner: JACOR BROADCASTING OF COLORADO, INC.)
KOSI (101.1 FM; DENVER, CO; Owner: ENTERCOM DENVER LICENSE, LLC)
KFMD (95.7 FM; DENVER, CO; Owner: CITICASTERS LICENSES, L.P.)
KRFX (103.5 FM; DENVER, CO; Owner: JACOR BROADCASTING OF COLORADO, INC.)
KCSU-FM (90.5 FM; FORT COLLINS, CO; Owner: BOARD OF GOVERNORS OF THE COLORADO STATE UNIVERSITY SYSTEM)
TV broadcast stations around Greeley:
KFCT (Channel 22; FORT COLLINS, CO; Owner: FOX TELEVISION STATIONS, INC.)
K63AB (Channel 63; ESTES PARK, CO; Owner: SYNCOM MEDIA GROUP, INC.)
KDEN (Channel 25; LONGMONT, CO; Owner: LONGMONT CHANNEL 25, INC.)
K48CG (Channel 48; LOVELAND, CO; Owner: TRINITY BROADCASTING NETWORK)
National Bridge Inventory (NBI) Statistics 120 Number of bridges1,417ft / 432m Total length $6,823,000 Total costs891,771 Total average daily traffic95,147 Total average daily truck traffic
New bridges - historical statistics
2 1940-1949 2 1950-1959 27 1960-1969 21 1970-1979 24 1980-1989 26 1990-1999 10 2000-2009 8 2010-2019
See full National Bridge Inventory statistics for Greeley, CO
Home Mortgage Disclosure Act Aggregated Statistics For Year 2009(Based on 14 full and 4 partial tracts) A) FHA, FSA/RHS & VA B) Conventional C) Refinancings D) Home Improvement Loans E) Loans on Dwellings For 5+ Families F) Non-occupant Loans on G) Loans On Manufactured Number Average Value Number Average Value Number Average Value Number Average Value Number Average Value Number Average Value Number Average Value
LOANS ORIGINATED 483 $139,389 377 $127,225 1,055 $160,959 51 $63,344 6 $164,945 205 $109,579 22 $39,946 APPLICATIONS APPROVED, NOT ACCEPTED 25 $134,020 36 $91,421 103 $162,476 5 $13,122 2 $485,510 23 $105,988 10 $35,224 APPLICATIONS DENIED 77 $121,773 64 $108,543 331 $166,070 47 $34,388 1 $1,200,000 54 $111,010 14 $54,573 APPLICATIONS WITHDRAWN 55 $116,179 43 $122,993 256 $160,591 12 $55,744 0 $0 37 $102,351 4 $22,370 FILES CLOSED FOR INCOMPLETENESS 4 $135,272 3 $200,423 54 $163,176 0 $0 0 $0 6 $146,298 2 $80,065
Aggregated Statistics For Year 2008(Based on 14 full and 4 partial tracts) A) FHA, FSA/RHS & VA B) Conventional C) Refinancings D) Home Improvement Loans E) Loans on Dwellings For 5+ Families F) Non-occupant Loans on G) Loans On Manufactured Number Average Value Number Average Value Number Average Value Number Average Value Number Average Value Number Average Value Number Average Value
LOANS ORIGINATED 328 $141,414 551 $120,145 660 $148,844 69 $51,847 14 $1,080,256 330 $114,899 71 $38,058 APPLICATIONS APPROVED, NOT ACCEPTED 19 $117,744 38 $141,831 118 $146,721 17 $67,205 2 $227,540 25 $147,493 8 $55,780 APPLICATIONS DENIED 56 $138,821 115 $133,963 531 $148,935 114 $39,605 1 $2,135,000 96 $111,402 29 $36,624 APPLICATIONS WITHDRAWN 27 $124,420 48 $126,753 201 $148,497 12 $47,010 0 $0 40 $120,650 7 $24,740 FILES CLOSED FOR INCOMPLETENESS 7 $118,450 12 $147,997 37 $178,542 5 $67,600 0 $0 9 $123,061 0 $0
Aggregated Statistics For Year 2007(Based on 15 full and 4 partial tracts) A) FHA, FSA/RHS & VA B) Conventional C) Refinancings D) Home Improvement Loans E) Loans on Dwellings For 5+ Families F) Non-occupant Loans on G) Loans On Manufactured Number Average Value Number Average Value Number Average Value Number Average Value Number Average Value Number Average Value Number Average Value
LOANS ORIGINATED 127 $148,607 1,023 $136,060 1,076 $138,669 122 $41,500 16 $2,707,381 451 $134,819 38 $40,374 APPLICATIONS APPROVED, NOT ACCEPTED 9 $125,086 145 $138,729 239 $132,219 20 $48,406 1 $207,000 63 $149,043 22 $30,830 APPLICATIONS DENIED 13 $136,411 284 $145,690 921 $143,390 164 $55,829 2 $271,000 167 $145,926 33 $37,240 APPLICATIONS WITHDRAWN 12 $118,552 89 $133,578 320 $156,231 19 $64,483 1 $280,000 60 $190,377 2 $24,500 FILES CLOSED FOR INCOMPLETENESS 2 $109,500 22 $141,065 91 $171,772 2 $133,140 0 $0 9 $188,062 0 $0
Aggregated Statistics For Year 2006(Based on 15 full and 4 partial tracts) A) FHA, FSA/RHS & VA B) Conventional C) Refinancings D) Home Improvement Loans E) Loans on Dwellings For 5+ Families F) Non-occupant Loans on G) Loans On Manufactured Number Average Value Number Average Value Number Average Value Number Average Value Number Average Value Number Average Value Number Average Value
LOANS ORIGINATED 170 $145,405 1,664 $118,893 1,507 $127,084 143 $41,353 30 $387,406 692 $122,303 20 $94,699 APPLICATIONS APPROVED, NOT ACCEPTED 10 $118,703 232 $108,554 303 $131,269 28 $56,154 0 $0 84 $114,687 13 $36,352 APPLICATIONS DENIED 31 $139,022 459 $117,569 1,096 $139,466 184 $57,189 3 $1,746,000 216 $127,408 44 $40,081 APPLICATIONS WITHDRAWN 10 $154,053 248 $118,033 637 $143,755 24 $105,194 0 $0 90 $126,350 2 $98,775 FILES CLOSED FOR INCOMPLETENESS 4 $150,965 37 $125,302 116 $140,335 6 $57,728 0 $0 10 $126,198 0 $0
Aggregated Statistics For Year 2005(Based on 14 full and 4 partial tracts) A) FHA, FSA/RHS & VA B) Conventional C) Refinancings D) Home Improvement Loans E) Loans on Dwellings For 5+ Families F) Non-occupant Loans on G) Loans On Manufactured Number Average Value Number Average Value Number Average Value Number Average Value Number Average Value Number Average Value Number Average Value
LOANS ORIGINATED 210 $145,243 2,043 $117,079 1,831 $132,111 151 $60,989 19 $974,034 602 $121,841 44 $39,990 APPLICATIONS APPROVED, NOT ACCEPTED 13 $125,652 213 $116,995 322 $127,520 38 $38,197 0 $0 72 $123,643 17 $38,668 APPLICATIONS DENIED 27 $120,313 558 $101,915 1,200 $140,167 224 $42,565 0 $0 159 $125,672 76 $39,192 APPLICATIONS WITHDRAWN 18 $150,974 315 $128,185 864 $148,423 80 $152,838 2 $2,720,000 122 $125,905 10 $121,799 FILES CLOSED FOR INCOMPLETENESS 2 $133,770 51 $128,090 225 $158,527 11 $70,464 0 $0 23 $156,357 0 $0
Aggregated Statistics For Year 2004(Based on 15 full and 4 partial tracts) A) FHA, FSA/RHS & VA B) Conventional C) Refinancings D) Home Improvement Loans E) Loans on Dwellings For 5+ Families F) Non-occupant Loans on G) Loans On Manufactured Number Average Value Number Average Value Number Average Value Number Average Value Number Average Value Number Average Value Number Average Value
LOANS ORIGINATED 336 $146,373 1,658 $128,101 2,180 $136,942 154 $44,790 13 $591,000 629 $124,181 35 $41,358 APPLICATIONS APPROVED, NOT ACCEPTED 16 $146,861 180 $123,336 339 $129,008 28 $39,738 2 $986,500 46 $132,818 20 $38,210 APPLICATIONS DENIED 55 $141,936 455 $103,872 1,311 $138,333 171 $33,928 2 $1,303,805 188 $140,788 95 $42,742 APPLICATIONS WITHDRAWN 49 $143,951 207 $124,740 792 $147,264 30 $48,194 0 $0 71 $114,998 5 $100,012 FILES CLOSED FOR INCOMPLETENESS 7 $127,664 35 $136,737 241 $148,752 8 $70,059 0 $0 13 $126,899 0 $0
Aggregated Statistics For Year 2003(Based on 15 full and 4 partial tracts) A) FHA, FSA/RHS & VA B) Conventional C) Refinancings D) Home Improvement Loans E) Loans on Dwellings For 5+ Families F) Non-occupant Loans on Number Average Value Number Average Value Number Average Value Number Average Value Number Average Value Number Average Value
LOANS ORIGINATED 556 $144,598 1,285 $141,378 4,638 $134,502 114 $24,719 14 $453,214 688 $126,184 APPLICATIONS APPROVED, NOT ACCEPTED 28 $187,519 164 $134,448 585 $127,812 28 $29,975 0 $0 65 $130,175 APPLICATIONS DENIED 58 $132,458 262 $97,648 1,264 $131,110 144 $20,168 2 $909,605 98 $119,304 APPLICATIONS WITHDRAWN 54 $140,617 115 $140,424 794 $137,320 23 $54,610 1 $716,650 48 $138,754 FILES CLOSED FOR INCOMPLETENESS 11 $147,614 23 $133,643 137 $145,637 5 $24,450 0 $0 16 $107,902
Aggregated Statistics For Year 2002(Based on 15 full and 2 partial tracts) A) FHA, FSA/RHS & VA B) Conventional C) Refinancings D) Home Improvement Loans E) Loans on Dwellings For 5+ Families F) Non-occupant Loans on Number Average Value Number Average Value Number Average Value Number Average Value Number Average Value Number Average Value
LOANS ORIGINATED 540 $134,115 1,234 $137,833 3,007 $129,850 175 $26,214 12 $809,636 553 $112,598 APPLICATIONS APPROVED, NOT ACCEPTED 27 $128,495 179 $124,389 415 $121,585 34 $29,081 0 $0 61 $116,223 APPLICATIONS DENIED 50 $126,990 256 $81,510 775 $108,937 180 $20,211 0 $0 98 $110,856 APPLICATIONS WITHDRAWN 28 $140,111 96 $132,209 673 $120,389 40 $24,786 1 $263,000 38 $117,667 FILES CLOSED FOR INCOMPLETENESS 11 $135,545 28 $135,977 281 $127,140 0 $0 0 $0 21 $116,655
Aggregated Statistics For Year 2001(Based on 15 full and 2 partial tracts) A) FHA, FSA/RHS & VA B) Conventional C) Refinancings D) Home Improvement Loans E) Loans on Dwellings For 5+ Families F) Non-occupant Loans on Number Average Value Number Average Value Number Average Value Number Average Value Number Average Value Number Average Value
LOANS ORIGINATED 664 $125,674 1,218 $121,995 2,665 $118,879 225 $20,945 12 $836,750 460 $109,678 APPLICATIONS APPROVED, NOT ACCEPTED 28 $122,121 190 $93,188 317 $110,798 39 $36,946 1 $108,000 37 $108,471 APPLICATIONS DENIED 38 $123,720 460 $58,643 896 $97,212 191 $18,973 2 $113,000 76 $105,443 APPLICATIONS WITHDRAWN 34 $117,251 119 $105,646 637 $117,678 46 $25,360 0 $0 39 $92,528 FILES CLOSED FOR INCOMPLETENESS 7 $118,566 40 $129,942 155 $113,427 2 $21,815 0 $0 11 $105,273
Aggregated Statistics For Year 2000(Based on 15 full and 2 partial tracts) A) FHA, FSA/RHS & VA B) Conventional C) Refinancings D) Home Improvement Loans E) Loans on Dwellings For 5+ Families F) Non-occupant Loans on Number Average Value Number Average Value Number Average Value Number Average Value Number Average Value Number Average Value
LOANS ORIGINATED 476 $113,646 1,211 $108,665 703 $95,616 231 $22,561 8 $988,584 266 $102,951 APPLICATIONS APPROVED, NOT ACCEPTED 17 $73,889 147 $71,606 152 $91,198 76 $27,131 0 $0 20 $70,318 APPLICATIONS DENIED 65 $87,215 621 $59,444 524 $81,718 166 $17,110 1 $560,000 60 $74,415 APPLICATIONS WITHDRAWN 83 $105,196 143 $103,146 282 $91,273 23 $26,863 0 $0 18 $80,894 FILES CLOSED FOR INCOMPLETENESS 37 $105,624 53 $111,352 114 $95,988 3 $45,290 0 $0 11 $99,890
Aggregated Statistics For Year 1999(Based on 13 full and 5 partial tracts) A) FHA, FSA/RHS & VA B) Conventional C) Refinancings D) Home Improvement Loans E) Loans on Dwellings For 5+ Families F) Non-occupant Loans on Number Average Value Number Average Value Number Average Value Number Average Value Number Average Value Number Average Value
LOANS ORIGINATED 459 $106,432 1,000 $96,414 1,197 $87,713 235 $17,732 21 $460,478 273 $87,845 APPLICATIONS APPROVED, NOT ACCEPTED 6 $106,925 166 $74,102 214 $78,390 58 $16,167 1 $227,000 25 $85,026 APPLICATIONS DENIED 27 $107,609 591 $57,868 551 $74,500 146 $17,638 1 $673,440 78 $81,736 APPLICATIONS WITHDRAWN 27 $101,612 119 $105,004 332 $94,826 29 $65,006 3 $962,953 27 $108,507 FILES CLOSED FOR INCOMPLETENESS 6 $92,732 30 $99,766 136 $98,101 5 $41,730 0 $0 12 $95,079
Detailed mortgage data for all 19 tracts in Greeley, CO
Private Mortgage Insurance Companies Aggregated Statistics For Year 2009(Based on 12 full and 4 partial tracts) A) Conventional B) Refinancings C) Non-occupant Loans on Number Average Value Number Average Value Number Average Value
LOANS ORIGINATED 40 $160,968 35 $199,618 1 $61,320 APPLICATIONS APPROVED, NOT ACCEPTED 11 $183,628 9 $247,363 1 $430,360 APPLICATIONS DENIED 8 $185,425 8 $160,090 0 $0 APPLICATIONS WITHDRAWN 5 $158,988 3 $296,117 0 $0 FILES CLOSED FOR INCOMPLETENESS 6 $172,728 3 $181,807 0 $0
Aggregated Statistics For Year 2008(Based on 13 full and 4 partial tracts) A) Conventional B) Refinancings C) Non-occupant Loans on Number Average Value Number Average Value Number Average Value
LOANS ORIGINATED 140 $151,564 57 $174,385 27 $99,798 APPLICATIONS APPROVED, NOT ACCEPTED 44 $160,948 28 $197,305 12 $151,965 APPLICATIONS DENIED 14 $86,966 14 $176,791 14 $94,798 APPLICATIONS WITHDRAWN 10 $140,181 3 $174,627 2 $126,485 FILES CLOSED FOR INCOMPLETENESS 6 $173,667 3 $196,690 1 $193,670
Aggregated Statistics For Year 2007(Based on 14 full and 4 partial tracts) A) Conventional B) Refinancings C) Non-occupant Loans on D) Loans On Manufactured Number Average Value Number Average Value Number Average Value Number Average Value
LOANS ORIGINATED 310 $156,992 117 $183,459 40 $150,118 0 $0 APPLICATIONS APPROVED, NOT ACCEPTED 33 $151,186 32 $189,002 6 $154,318 0 $0 APPLICATIONS DENIED 8 $148,349 3 $189,473 5 $213,892 0 $0 APPLICATIONS WITHDRAWN 7 $148,859 10 $189,031 5 $147,836 1 $224,530 FILES CLOSED FOR INCOMPLETENESS 0 $0 1 $66,000 1 $66,000 0 $0
Aggregated Statistics For Year 2006(Based on 13 full and 4 partial tracts) A) Conventional B) Refinancings C) Non-occupant Loans on D) Loans On Manufactured Number Average Value Number Average Value Number Average Value Number Average Value
LOANS ORIGINATED 130 $143,137 83 $170,173 33 $155,463 1 $85,000 APPLICATIONS APPROVED, NOT ACCEPTED 12 $161,432 19 $185,914 6 $171,985 0 $0 APPLICATIONS DENIED 4 $136,185 3 $187,817 4 $139,500 0 $0 APPLICATIONS WITHDRAWN 8 $179,401 3 $201,863 7 $185,579 0 $0 FILES CLOSED FOR INCOMPLETENESS 2 $207,355 0 $0 0 $0 0 $0
Aggregated Statistics For Year 2005(Based on 13 full and 4 partial tracts) A) Conventional B) Refinancings C) Non-occupant Loans on D) Loans On Manufactured Number Average Value Number Average Value Number Average Value Number Average Value
LOANS ORIGINATED 120 $162,138 111 $171,193 29 $147,147 1 $115,000 APPLICATIONS APPROVED, NOT ACCEPTED 16 $164,939 21 $174,813 8 $150,562 0 $0 APPLICATIONS DENIED 1 $105,000 2 $259,370 0 $0 0 $0 APPLICATIONS WITHDRAWN 4 $134,288 4 $193,128 2 $157,980 0 $0 FILES CLOSED FOR INCOMPLETENESS 2 $267,025 1 $276,920 0 $0 0 $0
Aggregated Statistics For Year 2004(Based on 14 full and 4 partial tracts) A) Conventional B) Refinancings C) Non-occupant Loans on D) Loans On Manufactured Number Average Value Number Average Value Number Average Value Number Average Value
LOANS ORIGINATED 200 $158,976 159 $156,794 41 $147,000 0 $0 APPLICATIONS APPROVED, NOT ACCEPTED 37 $154,118 46 $165,999 15 $138,828 1 $104,000 APPLICATIONS DENIED 2 $134,570 4 $137,550 1 $88,650 0 $0 APPLICATIONS WITHDRAWN 8 $159,812 8 $170,341 2 $144,500 0 $0 FILES CLOSED FOR INCOMPLETENESS 3 $215,920 2 $155,160 0 $0 0 $0
Aggregated Statistics For Year 2003(Based on 14 full and 4 partial tracts) A) Conventional B) Refinancings C) Non-occupant Loans on Number Average Value Number Average Value Number Average Value
LOANS ORIGINATED 302 $164,004 446 $156,043 80 $141,268 APPLICATIONS APPROVED, NOT ACCEPTED 37 $163,458 85 $159,748 9 $129,753 APPLICATIONS DENIED 7 $129,516 9 $160,892 3 $115,970 APPLICATIONS WITHDRAWN 15 $137,152 28 $167,792 4 $129,940 FILES CLOSED FOR INCOMPLETENESS 1 $244,940 1 $140,000 0 $0
Aggregated Statistics For Year 2002(Based on 14 full and 2 partial tracts) A) Conventional B) Refinancings C) Non-occupant Loans on Number Average Value Number Average Value Number Average Value
LOANS ORIGINATED 345 $155,480 285 $151,368 71 $125,650 APPLICATIONS APPROVED, NOT ACCEPTED 37 $163,579 60 $157,933 10 $139,093 APPLICATIONS DENIED 3 $134,707 5 $172,714 2 $118,500 APPLICATIONS WITHDRAWN 10 $142,273 17 $159,355 4 $133,000 FILES CLOSED FOR INCOMPLETENESS 1 $321,460 3 $101,280 0 $0
Aggregated Statistics For Year 2001(Based on 14 full and 2 partial tracts) A) Conventional B) Refinancings C) Non-occupant Loans on Number Average Value Number Average Value Number Average Value
LOANS ORIGINATED 385 $140,149 368 $141,408 75 $123,301 APPLICATIONS APPROVED, NOT ACCEPTED 38 $137,231 61 $140,886 14 $123,453 APPLICATIONS DENIED 15 $147,503 11 $145,390 9 $156,508 APPLICATIONS WITHDRAWN 16 $142,156 14 $145,891 2 $160,500 FILES CLOSED FOR INCOMPLETENESS 1 $107,000 2 $259,170 0 $0
Aggregated Statistics For Year 2000(Based on 14 full and 2 partial tracts) A) Conventional B) Refinancings C) Non-occupant Loans on Number Average Value Number Average Value Number Average Value
LOANS ORIGINATED 318 $136,657 84 $116,008 34 $124,570 APPLICATIONS APPROVED, NOT ACCEPTED 26 $134,254 10 $116,824 5 $107,600 APPLICATIONS DENIED 6 $127,920 6 $154,667 0 $0 APPLICATIONS WITHDRAWN 4 $116,500 3 $103,133 3 $92,333 FILES CLOSED FOR INCOMPLETENESS 1 $244,380 2 $186,305 1 $95,000
Aggregated Statistics For Year 1999(Based on 12 full and 5 partial tracts) A) Conventional B) Refinancings C) Non-occupant Loans on Number Average Value Number Average Value Number Average Value
LOANS ORIGINATED 326 $127,108 165 $121,375 33 $104,364 APPLICATIONS APPROVED, NOT ACCEPTED 19 $140,223 29 $110,498 4 $118,782 APPLICATIONS DENIED 20 $111,145 6 $107,257 6 $109,347 APPLICATIONS WITHDRAWN 7 $114,417 4 $97,535 1 $68,820 FILES CLOSED FOR INCOMPLETENESS 2 $84,605 0 $0 1 $88,000
Fire-safe hotels and motels in Greeley, Colorado:
Clarion Hotel & Conf Ctr, 701 8TH St, Greeley, Colorado 80631 Phone: (970) 353-8444, Fax: (970) 353-4269
Holiday Inn Express - Greeley, 2563 W 29TH St, Greeley, Colorado 80631 Phone: (970) 330-7495
Comfort Inn Greeley, 2467 W 29th St, Greeley, Colorado 80631 Phone: (970) 330-6380, Fax: (970) 330-6382
Country Inn & Suites By Carlson, 2501 W 29th St, Greeley, Colorado 80631 Phone: (970) 330-3404, Fax: (970) 330-8404
Hampton Inn & Suites, 2350 29th St, Greeley, Colorado 80631 Phone: (970) 339-5525, Fax: (970) 339-5535
Super 8, 2423W 29th St, Greeley, Colorado 80631 Phone: (970) 330-8880, Fax: (970) 330-1895
Candlewood Suites, 3530 W 29th St, Greeley, Colorado 80634 Phone: (970) 330-2333, Fax: (970) 330-2345
Greeley Guest House, 5401 W 9th St, Greeley, Colorado 80634 Phone: (970) 353-9373, Fax: (970) 353-9297
2 other hotels and motels
All 10 fire-safe hotels and motels in Greeley, Colorado
Most common first names in Greeley, CO among deceased individuals Name Count Lived (average)
John 493 78.0 years Mary 465 80.5 years Robert 353 73.4 years William 349 77.9 years James 301 72.7 years Helen 281 83.0 years George 254 79.6 years Ruth 250 81.1 years Charles 245 78.4 years Dorothy 243 80.3 years
Most common last names in Greeley, CO among deceased individuals Last name Count Lived (average)
Smith 203 79.1 years Johnson 192 79.5 years Miller 177 75.3 years Anderson 140 78.1 years Brown 96 76.2 years Martinez 88 70.0 years Williams 78 74.2 years Nelson 71 77.2 years Martin 66 79.8 years Thompson 64 80.7 years
Greeley compared to Colorado state average:
Unemployed percentage below state average. Hispanic race population percentage above state average. Median age significantly below state average. Foreign-born population percentage above state average. Number of college students above state average.
#13 on the list of "Top 101 cities with the highest average wind speeds (population 50,000+)"
#15 on the list of "Top 101 cities with largest percentage of males in industries: mining, quarrying, and oil and gas extraction (population 50,000+)"
#18 on the list of "Top 101 cities with the smallest sunshine amount differences during a year (population 50,000+)"
#28 on the list of "Top 100 highest located cities (pop. 50,000+)"
#34 on the list of "Top 101 cities with the largest wind speed differences during a year (population 50,000+)"
#36 on the list of "Top 101 cities with largest percentage of males in occupations: construction and extraction occupations (population 50,000+)"
#51 on the list of "Top 101 cities with largest percentage of workers with very short commute times (9 minutes or less) (population 50,000+)"
#52 on the list of "Top 101 cities with largest percentage of females in occupations: material moving occupations (population 50,000+)"
#59 on the list of "Top 101 cities with the lowest maximum monthly morning or afternoon humidity (population 50,000+)"
#64 on the list of "Top 101 cities with largest percentage of females in industries: mining, quarrying, and oil and gas extraction (population 50,000+)"
#82 on the list of "Top 101 cities with the lowest average humidity (population 50,000+)"
#86 on the list of "Top 101 cities with the largest percentage of people in other types of correctional institutions (population 1,000+)"
#91 on the list of "Top 101 cities with the most cars per house, population 50,000+"
#92 on the list of "Top 100 cities with youngest residents (pop. 50,000+)"
#93 on the list of "Top 101 cities with largest percentage of males in occupations: community and social service occupations (population 50,000+)"
#93 on the list of "Top 101 cities with largest percentage of males in occupations: health technologists and technicians (population 50,000+)"
#44 on the list of "Top 101 counties with the highest carbon monoxide air pollution readings in 2012 (ppm)"
#47 on the list of "Top 101 counties with the highest Particulate Matter (PM10 ) Annual air pollution readings in 2012 (µg/m3 )"
#50 on the list of "Top 101 counties with the lowest percentage of residents that visited a dentist within the past year"
#62 on the list of "Top 101 counties with the lowest number of deaths per 1000 residents 2007-2013 (pop. 50,000+)"
#66 on the list of "Top 101 counties with the lowest percentage of residents that smoked 100+ cigarettes in their lives"
Top Patent Applicants
Dan L. Dalton (8)
Daniel J. Hatch (6)
Charles Brian Gross (6)
Stephen M. Weilnau (5)
Anthony P. Kitson (5)
Scott R. Cockroft (5)
Steven A. Bennetts (4)
Samantha L. Hampton (4)
Frederic E. Mikell (4)
Jon Daren Suntych (4)
Total of 158 patent applications in 2008-2024.


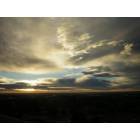
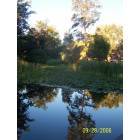
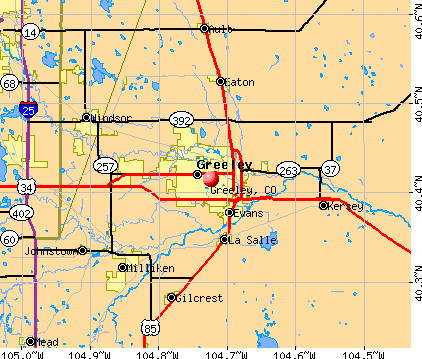


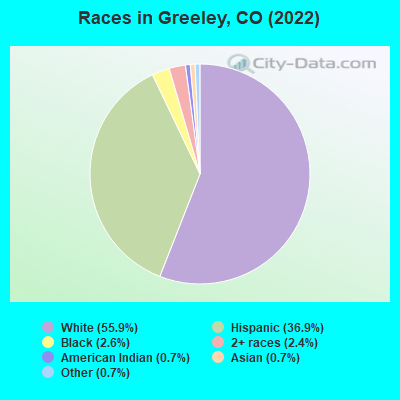
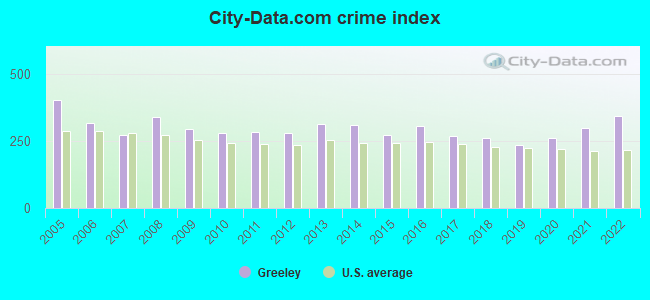
 Recent articles from our blog. Our writers, many of them Ph.D. graduates or candidates, create easy-to-read articles on a wide variety of topics.

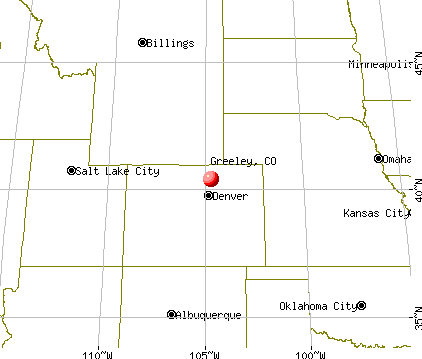
 , pop. 259,628).
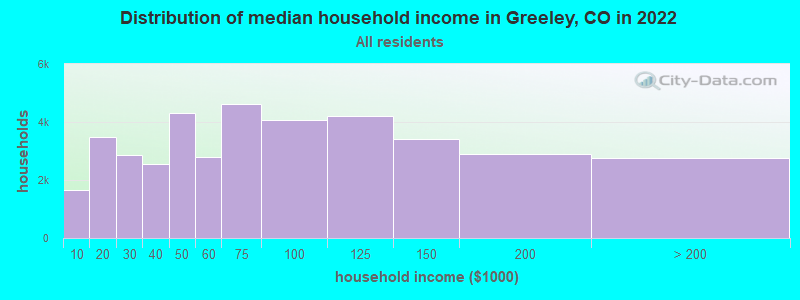
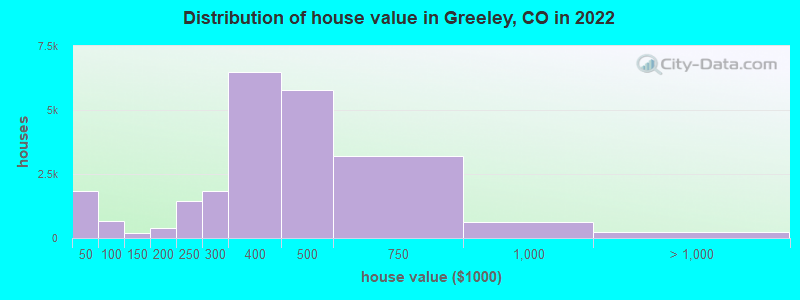
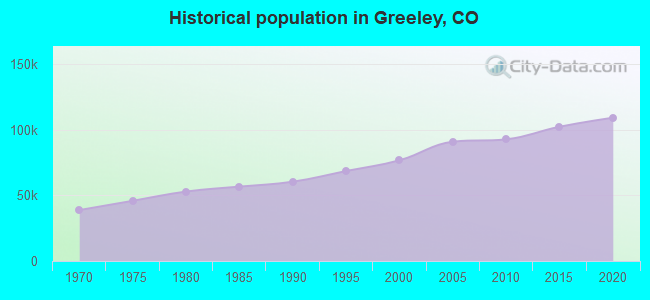
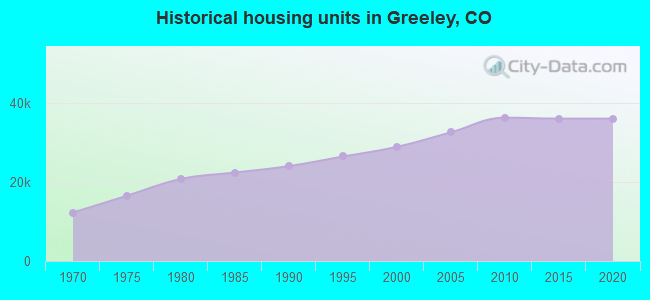
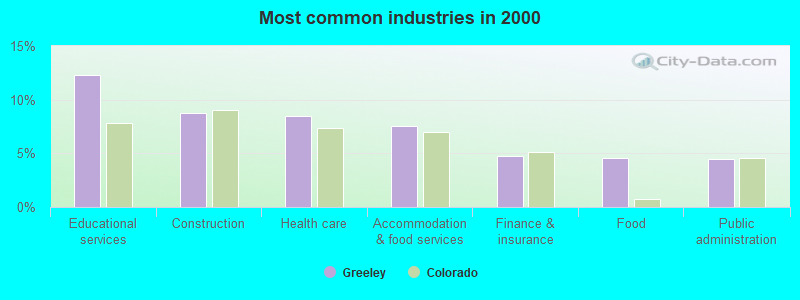
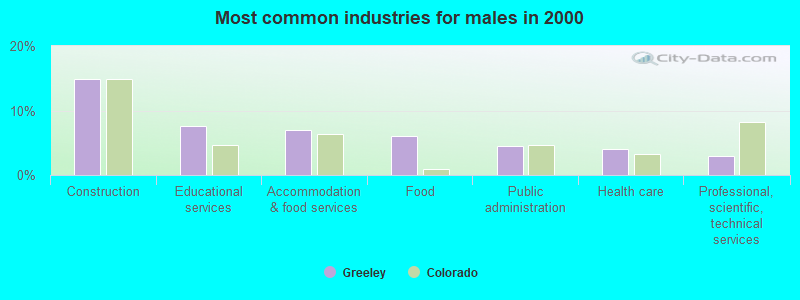
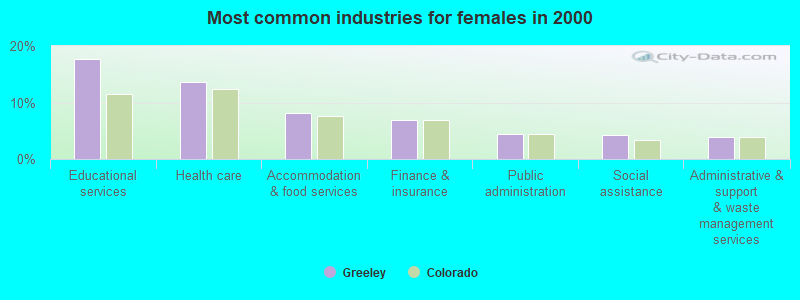
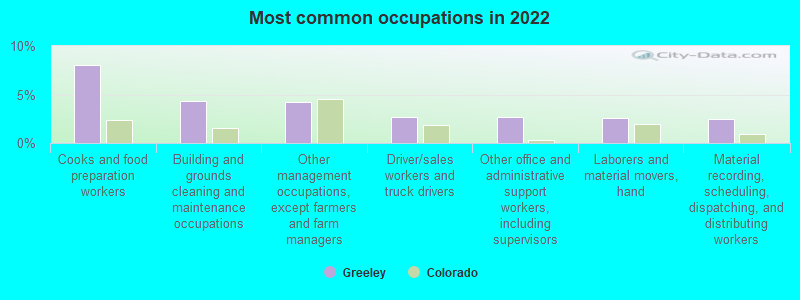
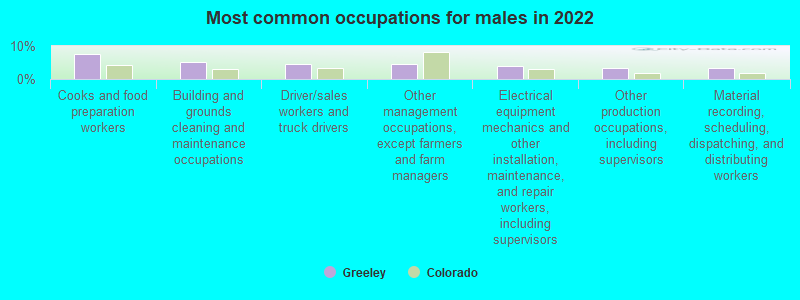
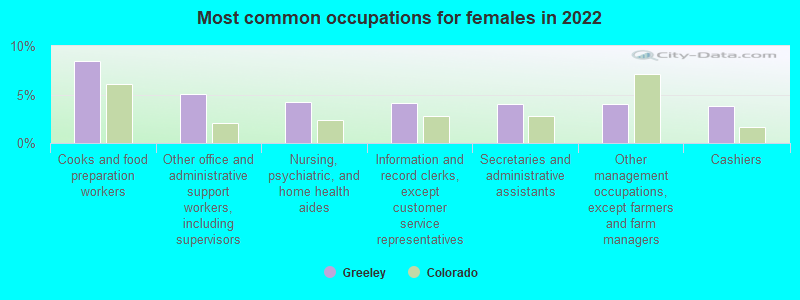

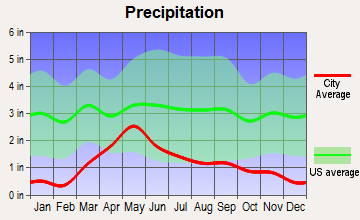
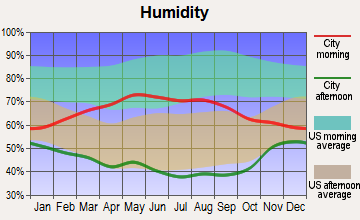
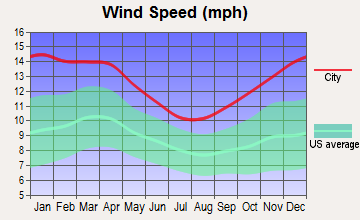


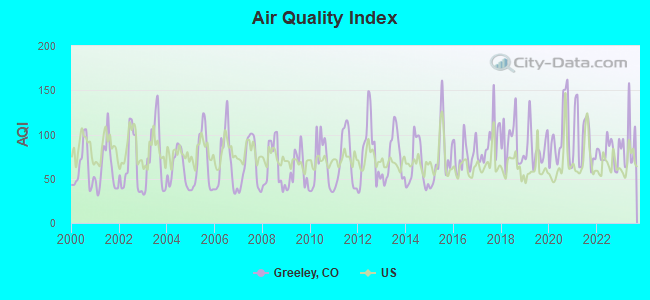
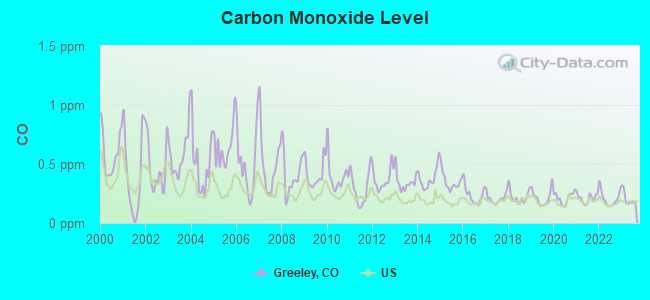
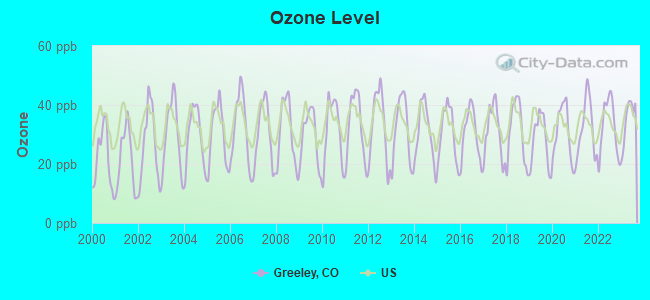
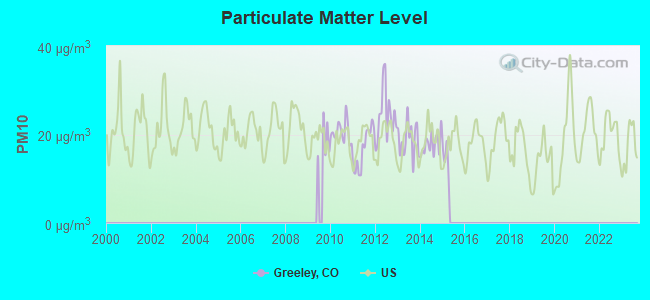
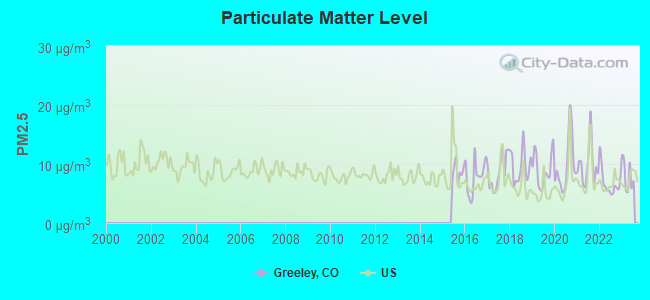

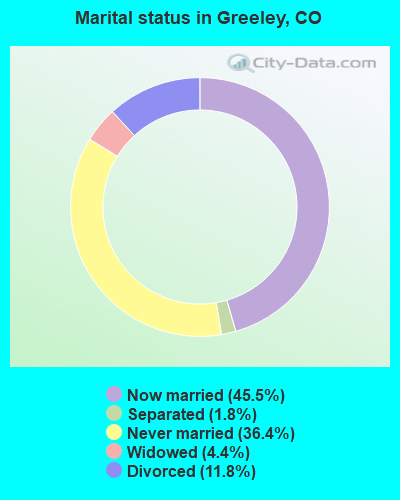
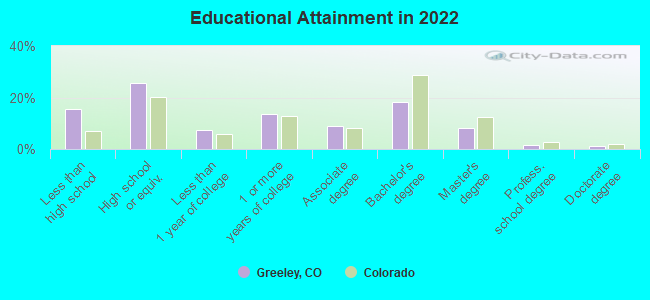
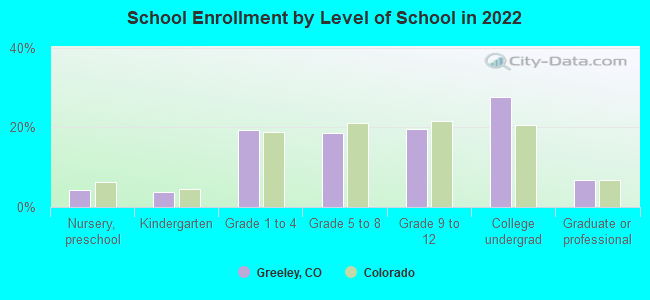
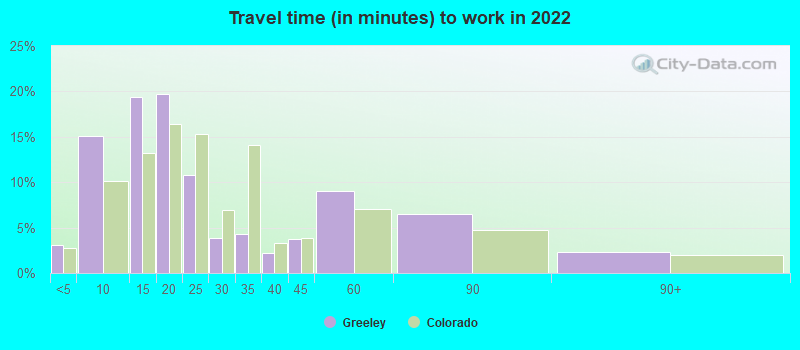
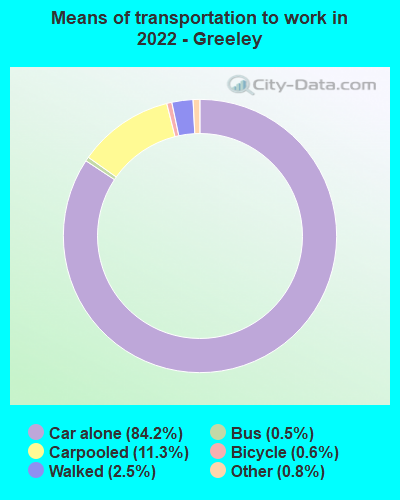
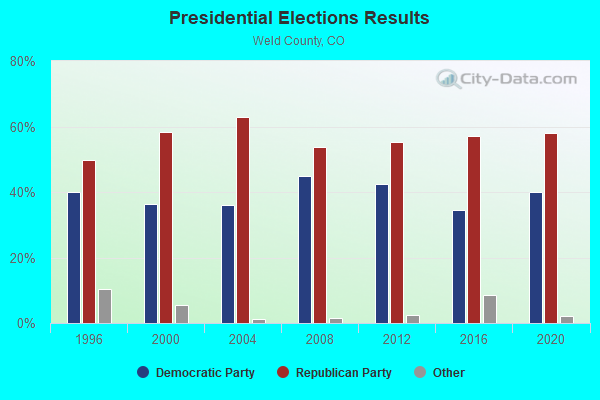
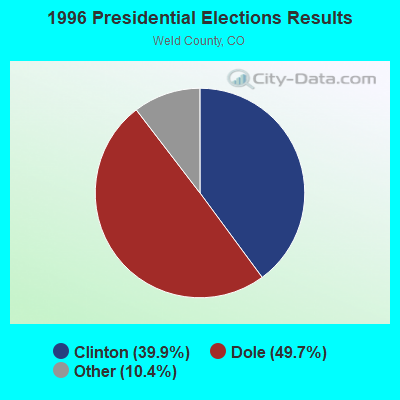
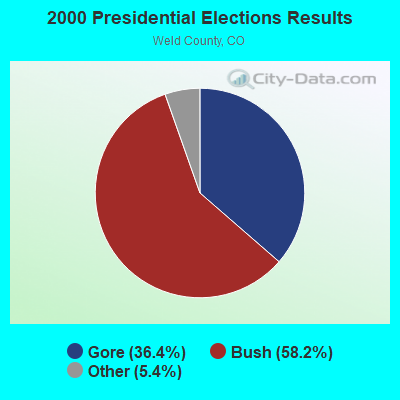
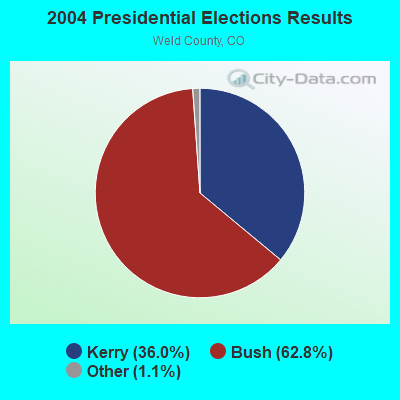
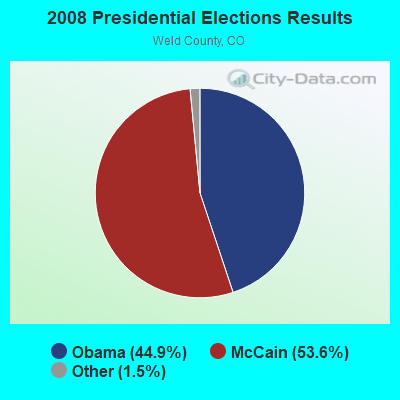
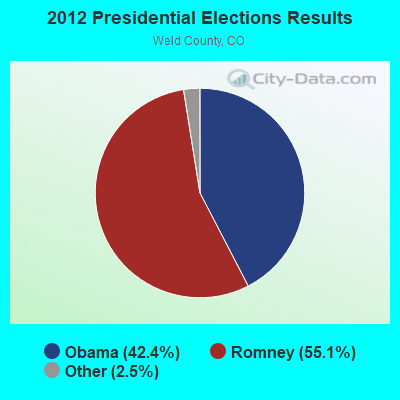
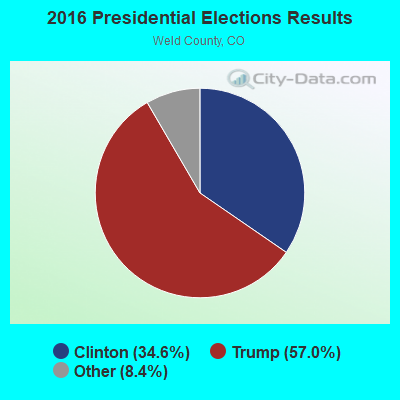
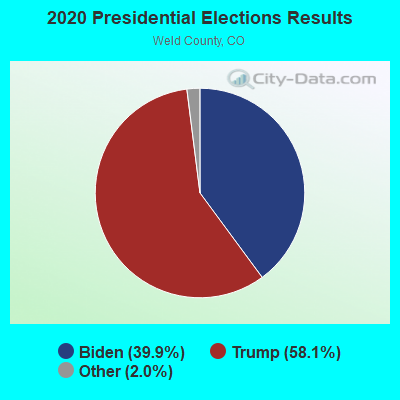
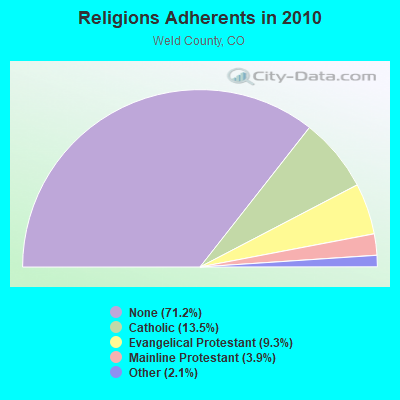
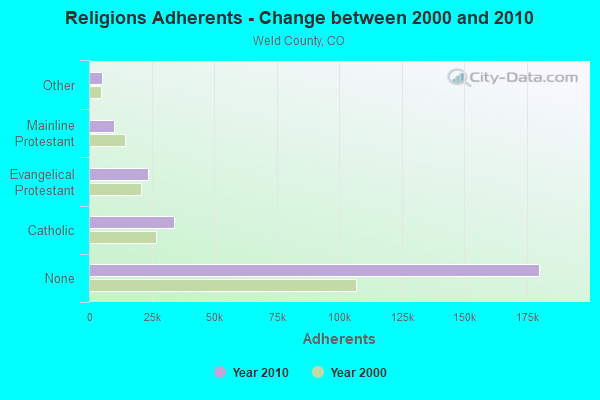
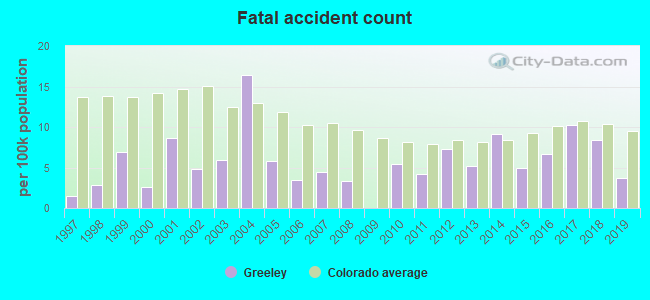
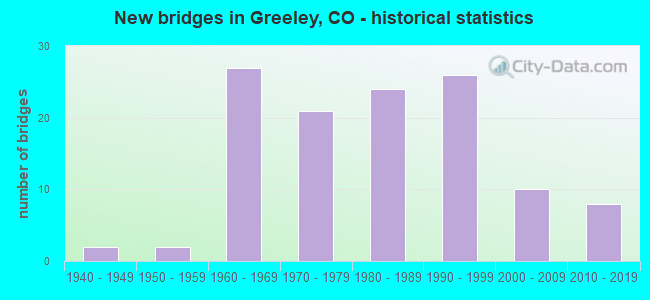
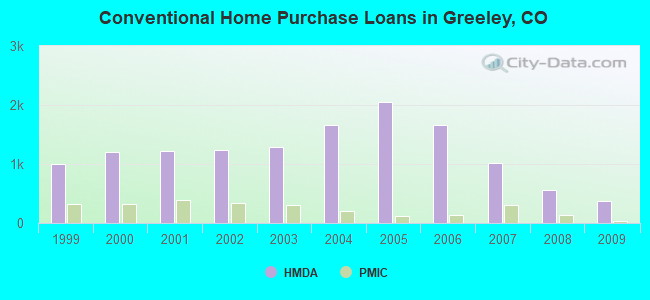
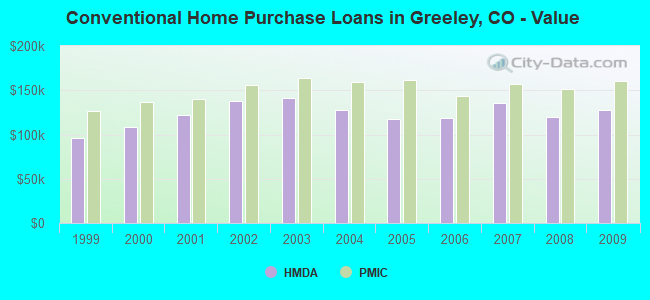
 According to the data from the years 2004 - 2018 the average number of fires per year is 200. The highest number of fires - 317 took place in 2011, and the least - 11 in 2014. The data has an increasing trend.
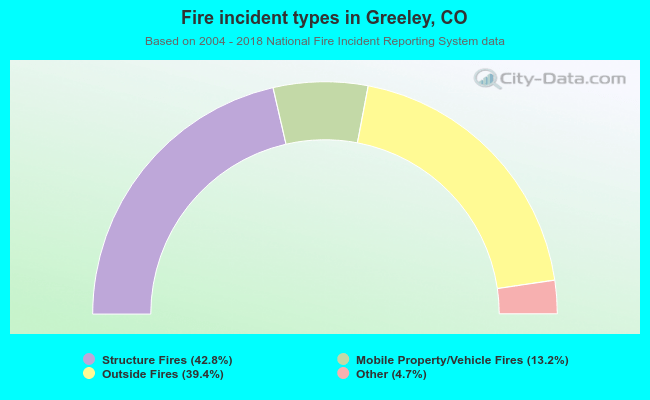 When looking into fire subcategories, the most incidents belonged to: Structure Fires (42.8%), and Outside Fires (39.4%).