Greeley: Fire Incidents, Colorado (CO)
Where are fire incidents reported in Greeley, CO
Something went wrong! Please refresh the page.
| Fire incidents reported | |
|---|---|
| Sreet name | Count |
| 10TH ST | 194 |
| 11TH AVE | 174 |
| 8TH AVE | 164 |
| 35TH AVE | 148 |
| 16TH ST | 138 |
| 1ST AVE | 132 |
| 8TH ST | 130 |
| 18TH ST | 112 |
| 9TH AVE | 96 |
| 9TH ST | 94 |
| 14TH AVE | 92 |
| 23RD AVE | 90 |
| 29TH ST | 90 |
| 11TH ST | 88 |
| 7TH ST | 88 |
| 5TH ST | 84 |
| 13TH ST | 82 |
| C ST | 78 |
| HIGHWAY 34 BYP | 78 |
| 22ND ST | 76 |
| 6TH ST | 76 |
| 10TH AVE | 74 |
| 20TH ST | 70 |
| 6TH AVE | 70 |
| 24TH ST | 68 |
| 13TH AVE | 66 |
| 7TH AVE | 66 |
| 28TH ST | 64 |
| 30TH ST | 60 |
| 71ST AVE | 60 |
| Other | 108 |
2004 - 2018 National Fire Incident Reporting System (NFIRS) incidents
- Incident types reported to NFIRS in Greeley, CO
- 26,80053.4%Rescue & EMS
- 9,38018.7%Good Intent Call
- 6,58613.1%Hazardous Condition
- 3,0106.0%Fire
- 2,3574.7%Service Call
- 1,9864.0%False Alarm
- Fire incident types reported to NFIRS in Greeley, CO
- 1,28942.8%Structure Fires
- 1,18539.4%Outside Fires
- 39613.2%Mobile Property/Vehicle Fires
- 1404.7%Other
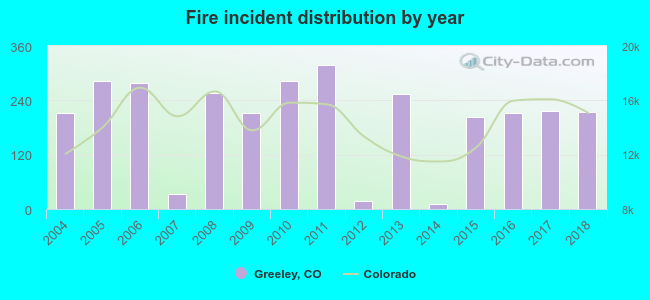 According to the data from the years 2004 - 2018 the average number of fire incidents per year is 200. The highest number of reported fire incidents - 317 took place in 2011, and the least - 11 in 2014. The data has a rising trend.
The average number of yearly fire incidents per 10k residents in Greeley, CO compared to nearest cities:
(Note: Based on data for the last 3 years, including only cities with population 5,000 and above)
| Greeley: | 21.7 |
| Evans: | 35.8 |
| Milliken: | 36.7 |
| Windsor: | 20.8 |
| Johnstown: | 33.8 |
| Loveland: | 23.6 |
| Berthoud: | 96.4 |
| Fort Collins: | 18.5 |
| Firestone: | 34.4 |
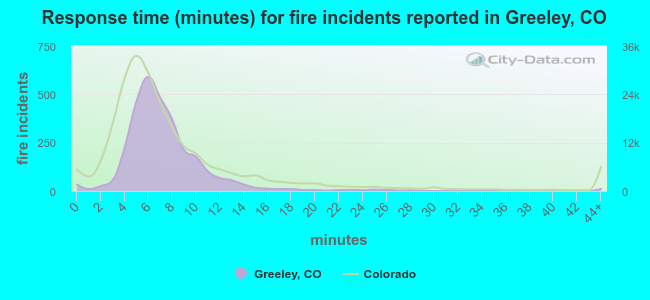 The median response time based on all reported fire incidents is 7 minutes. This is comparable to the state median value.
The median response time in Greeley, CO compared to nearest cities:
(Note: Based on data for all years, including only cities with at least 500 fire incidents)
| Greeley: | 7 minutes |
| Evans: | 6 minutes |
| Eaton: | 8 minutes |
| Kersey: | 10 minutes |
| Windsor: | 7 minutes |
| Johnstown: | 9 minutes |
| Platteville: | 9 minutes |
| Loveland: | 6 minutes |
| Berthoud: | 9 minutes |
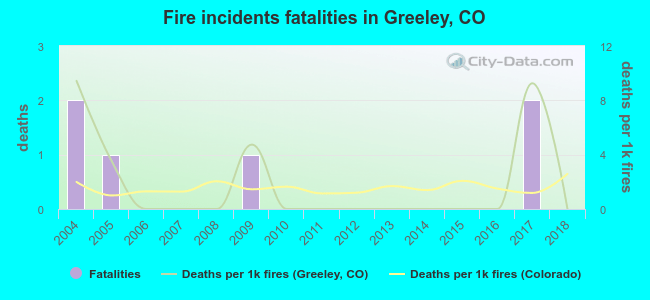 According to the data from the years 2004 - 2018 the average number of fire-related yearly deaths is 0. The highest number of deaths - 2 took place in 2004, and the lowest - 0 in 2006. The data has a dropping trend.
The average number of fatalities per 1,000 fires is 2. This indicator was the highest - 9 in 2004, and the lowest 0 in 2006. The trend for deaths per 1,000 fire incidents is declining. Compared to the Colorado value the number of fatalities per 1,000 incidents is higher.
According to the data from the years 2004 - 2018 the average number of fire-related yearly deaths is 0. The highest number of deaths - 2 took place in 2004, and the lowest - 0 in 2006. The data has a dropping trend.
The average number of fatalities per 1,000 fires is 2. This indicator was the highest - 9 in 2004, and the lowest 0 in 2006. The trend for deaths per 1,000 fire incidents is declining. Compared to the Colorado value the number of fatalities per 1,000 incidents is higher.Deaths per 1,000 incidents in Greeley, CO compared to nearest cities:
(Note: Based on data for all years, including only cities with at least 2,500 fire incidents)
| Greeley: | 2.0 |
| Loveland: | 2.9 |
| Fort Collins: | 1.0 |
| Longmont: | 0.9 |
| Thornton: | 1.4 |
| Boulder: | 1.7 |
| Westminster: | 4.5 |
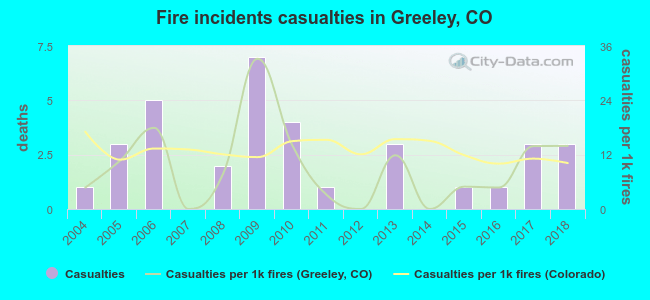 Based on the data from the years 2004 - 2018 the average number of fire-related casualties per year is 2. The highest number of injuries - 7 took place in 2009, and the lowest - 0 in 2007. The data has a rising trend.
The average number of injuries per 1,000 fire incidents is 9. This indicator was the highest - 33 in 2009, and the lowest 0 in 2007. The trend for casualties per 1,000 incidents is increasing. Compared to the Colorado value the number of casualties per 1,000 fires is similar.
Based on the data from the years 2004 - 2018 the average number of fire-related casualties per year is 2. The highest number of injuries - 7 took place in 2009, and the lowest - 0 in 2007. The data has a rising trend.
The average number of injuries per 1,000 fire incidents is 9. This indicator was the highest - 33 in 2009, and the lowest 0 in 2007. The trend for casualties per 1,000 incidents is increasing. Compared to the Colorado value the number of casualties per 1,000 fires is similar.
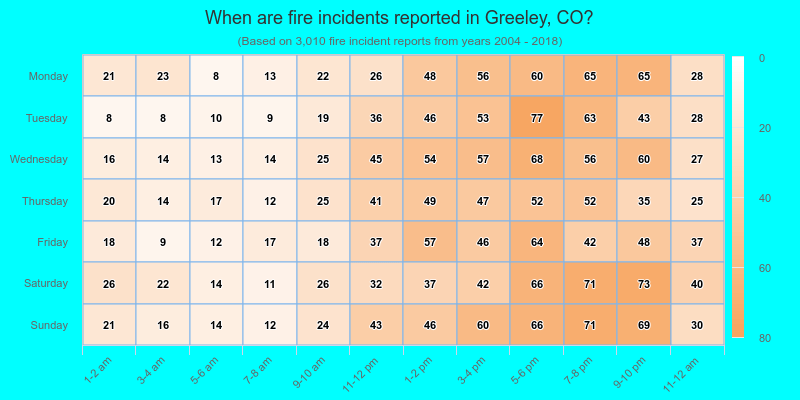
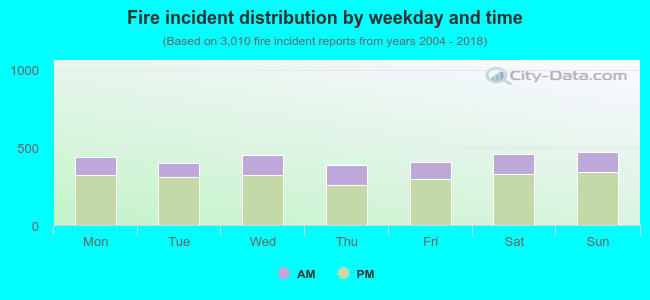 27.6% incidents where reported in the morning and 72.4% in the evening. The most fires (15.7%) took place on Sunday, and the least (12.9%) on Thursday.
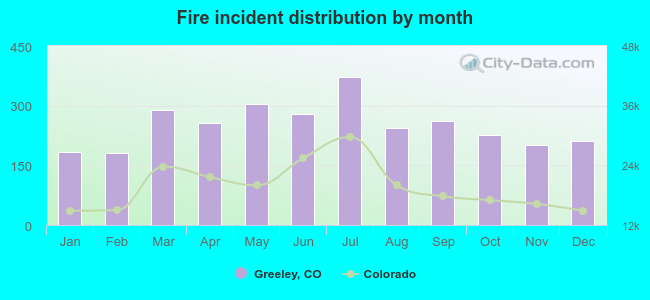 According to the 3,010 fire incident reports from years 2004 - 2018 most fires (12.3%) took place during July, and the least (6.0%) in February.
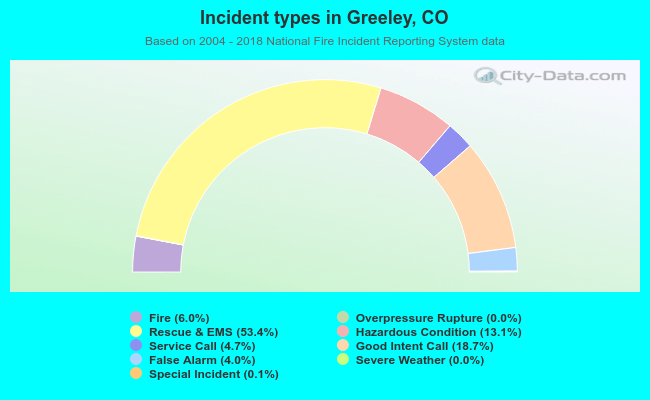 Out of all 50,189 cases reported during the years 2004 - 2018, the most belonged to the categories: Rescue & EMS (53.4%), Good Intent Call (18.7%), and Hazardous Condition (13.1%).
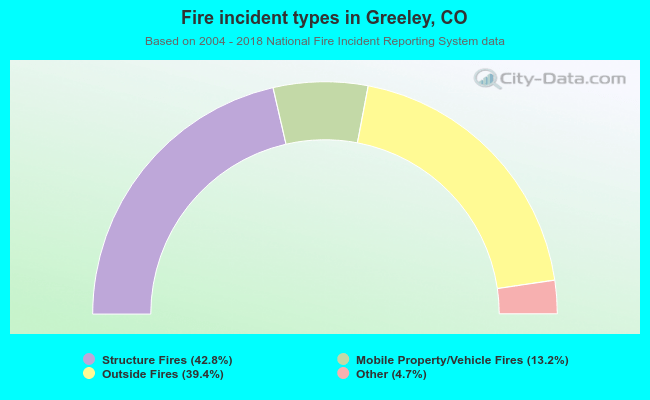 When looking into fire subcategories, the most incidents belonged to: Structure Fires (42.8%), and Outside Fires (39.4%).