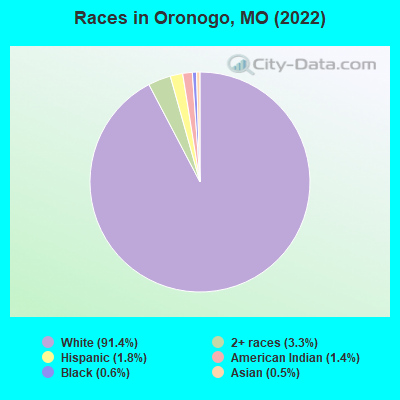
Percentage of residents living in poverty in 2022: 6.3%
(4.7% for White Non-Hispanic residents, 66.7% for Black residents, 62.2% for American Indian residents, 11.7% for two or more races residents)
According to our research of Missouri and other state lists, there were 9 registered sex offenders living in Oronogo, Missouri as of June 16, 2024. The ratio of all residents to sex offenders in Oronogo is 291 to 1. The ratio of registered sex offenders to all residents in this city is near the state average.
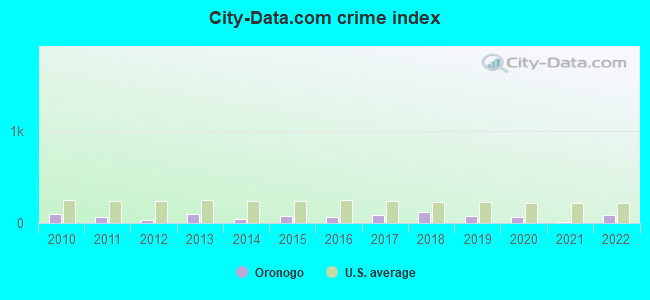
Crime rates in Oronogo by year
Type
2010
2011
2012
2013
2014
2015
2016
2017
2018
2019
2020
2021
2022
Murders (per 100,000)
0 (0.0)
0 (0.0)
0 (0.0)
0 (0.0)
0 (0.0)
0 (0.0)
0 (0.0)
0 (0.0)
0 (0.0)
0 (0.0)
0 (0.0)
0 (0.0)
0 (0.0)
Rapes (per 100,000)
0 (0.0)
1 (33.9)
0 (0.0)
1 (43.4)
0 (0.0)
1 (41.6)
0 (0.0)
1 (40.2)
0 (0.0)
1 (37.1)
1 (37.0)
0 (0.0)
2 (75.4)
Robberies (per 100,000)
0 (0.0)
0 (0.0)
0 (0.0)
0 (0.0)
0 (0.0)
0 (0.0)
0 (0.0)
0 (0.0)
0 (0.0)
0 (0.0)
0 (0.0)
0 (0.0)
0 (0.0)
Assaults (per 100,000)
4 (136.2)
0 (0.0)
0 (0.0)
1 (43.4)
0 (0.0)
1 (41.6)
4 (164.4)
3 (120.5)
9 (349.1)
0 (0.0)
0 (0.0)
0 (0.0)
0 (0.0)
Burglaries (per 100,000)
12 (408.7)
4 (135.7)
2 (67.4)
4 (173.7)
1 (42.9)
4 (166.6)
3 (123.3)
3 (120.5)
3 (116.4)
2 (74.2)
1 (37.0)
0 (0.0)
1 (37.7)
Thefts (per 100,000)
26 (885.6)
17 (576.9)
20 (673.9)
19 (825.0)
18 (771.5)
9 (374.8)
9 (369.9)
9 (361.4)
22 (853.4)
16 (593.9)
14 (518.5)
5 (185.5)
11 (414.5)
Auto thefts (per 100,000)
2 (68.1)
1 (33.9)
0 (0.0)
2 (86.8)
2 (85.7)
2 (83.3)
3 (123.3)
1 (40.2)
2 (77.6)
4 (148.5)
3 (111.1)
1 (37.1)
2 (75.4)
Arson (per 100,000)
1 (34.1)
0 (0.0)
0 (0.0)
0 (0.0)
0 (0.0)
0 (0.0)
0 (0.0)
0 (0.0)
0 (0.0)
0 (0.0)
0 (0.0)
0 (0.0)
0 (0.0)
City-Data.com crime index
96.7
62.4
31.7
95.5
40.7
75.0
66.2
82.3
118.3
70.5
61.9
10.4
85.5
The City-Data.com crime index weighs serious crimes and violent crimes more heavily. Higher means more crime, U.S. average is 246.1. It adjusts for the number of visitors and daily workers commuting into cities.
Latest news from Oronogo, MO collected exclusively by city-data.com from local newspapers, TV, and radio stations
Ancestries: Irish (19.3%), American (14.9%), German (8.5%), English (8.0%), European (4.5%), Scotch-Irish (1.8%).
Current Local Time: CST time zone
Incorporated in 1873
Elevation: 915 feet
Land area: 2.02 square miles.
Population density: 1,381 people per square mile (low).
17 residents are foreign born
This city:
0.6%
Missouri:
4.2%
Median real estate property taxes paid for housing units with mortgages in 2022: $1,238 (0.6%) Median real estate property taxes paid for housing units with no mortgage in 2022: $951 (0.5%)
Nearest city with pop. 50,000+: Springfield, MO (65.1 miles , pop. 151,580).
Nearest city with pop. 200,000+: Tulsa, OK (109.6 miles , pop. 393,049).
Nearest city with pop. 1,000,000+: Dallas, TX (330.9 miles , pop. 1,188,580).
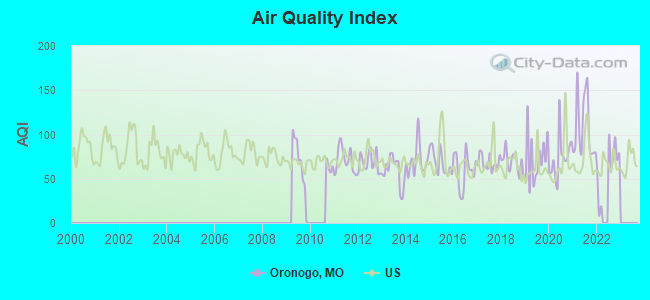
Air Quality Index (AQI) level in 2022 was 63.2. This is about average.
City:
63.2
U.S.:
72.6
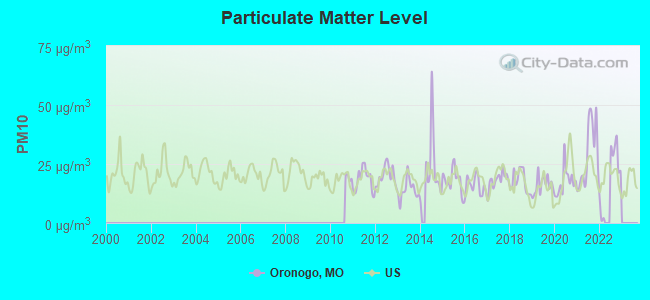
Particulate Matter (PM10) [µg/m3] level in 2022 was 20.7. This is about average.Closest monitor was 24.3 miles away from the city center.
City:
20.7
U.S.:
19.2
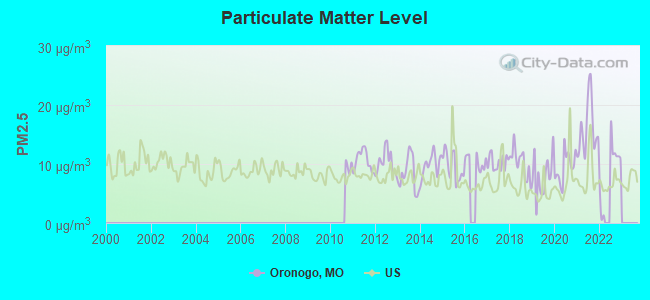
Particulate Matter (PM2.5) [µg/m3] level in 2022 was 9.06. This is about average.Closest monitor was 24.9 miles away from the city center.
City:
9.06
U.S.:
8.11
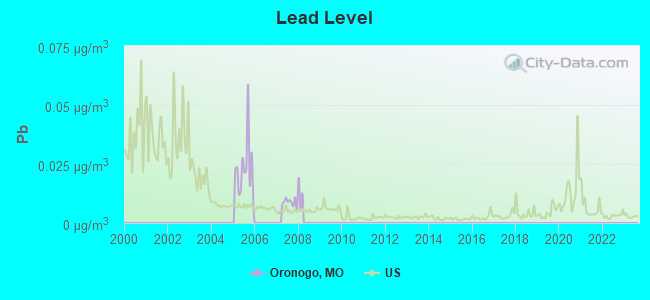
Lead (Pb) [µg/m3] level in 2007 was 0.00874. This is about average.Closest monitor was 7.4 miles away from the city center.
City:
0.00874
U.S.:
0.00931
Tornado activity:
Oronogo-area historical tornado activity is slightly above Missouri state average. It is 94% greater than the overall U.S. average.
On 4/3/1956, a category F4 (max. wind speeds 207-260 mph) tornado 3.8 miles away from the Oronogo city center injured 59 peopleand causedbetween $500,000 and $5,000,000 in damages.
On 5/10/2008, a category F4 tornado 19.9 miles away from the city center killed 15 peopleand injured 200 peopleand caused $45 million in damages.
Earthquake activity:
Oronogo-area historical earthquake activity is significantly above Missouri state average. It is 641% greater than the overall U.S. average.
On 9/3/2016 at 12:02:44, a magnitude 5.8 (5.8 MW, Depth: 3.5 mi, Class: Moderate, Intensity: VI - VII) earthquake occurred 146.2 miles away from the city center On 11/6/2011 at 03:53:10, a magnitude 5.7 (5.7 MW, Depth: 3.2 mi) earthquake occurred 171.8 miles away from Oronogo center On 11/7/2016 at 01:44:24, a magnitude 5.0 (5.0 MW, Depth: 2.8 mi) earthquake occurred 154.0 miles away from the city center On 11/12/2014 at 21:40:00, a magnitude 4.9 (4.9 MW, Depth: 2.5 mi, Class: Light, Intensity: IV - V) earthquake occurred 173.7 miles away from Oronogo center On 11/5/2011 at 07:12:45, a magnitude 4.8 (4.8 MW, Depth: 1.9 mi) earthquake occurred 171.0 miles away from the city center On 11/8/2011 at 02:46:57, a magnitude 4.8 (4.8 MW, Depth: 3.1 mi) earthquake occurred 172.8 miles away from Oronogo center Magnitude types: moment magnitude (MW)
Natural disasters:
The number of natural disasters in Jasper County (21) is greater than the US average (15). Major Disasters (Presidential) Declared: 13 Emergencies Declared: 5
Causes of natural disasters: Floods: 13, Storms: 13, Tornadoes: 11, Winter Storms: 5, Winds: 3, Heavy Rain: 1, Hurricane: 1, Other: 1 (Note: some incidents may be assigned to more than one category).
Hospitals and medical centers near Oronogo:
SPRING RIVER CHRISTIAN VILLAGE INC (Nursing Home, about 7 miles away; JOPLIN, MO)
HEARTLAND KIDNEY CENTER (Dialysis Facility, about 10 miles away; CARTHAGE, MO)
ST JOHNS REG MEDICAL CENTER HOME HEALTH AGENCY (Home Health Center, about 10 miles away; JOPLIN, MO)
NHC HEALTHCARE, JOPLIN (Nursing Home, about 10 miles away; JOPLIN, MO)
COMMUNITY HOSPICES OF AMERICA - THE FOUR STATES (Hospital, about 10 miles away; JOPLIN, MO)
ST LUKE'S NURSING CENTER INC (Nursing Home, about 10 miles away; CARTHAGE, MO)
GREENBRIAR, THE (Nursing Home, about 10 miles away; JOPLIN, MO)
Colleges/universities with over 2000 students nearest to Oronogo:
Missouri Southern State University (about 7 miles; Joplin, MO; Full-time enrollment: 4,456)
Pittsburg State University (about 20 miles; Pittsburg, KS; FT enrollment: 6,838)
Crowder College (about 27 miles; Neosho, MO; FT enrollment: 3,675)
Northeastern Oklahoma A&M College (about 31 miles; Miami, OK; FT enrollment: 2,075)
NorthWest Arkansas Community College (about 60 miles; Bentonville, AR; FT enrollment: 5,634)
Southwest Baptist University (about 65 miles; Bolivar, MO; FT enrollment: 2,783)
Drury University (about 66 miles; Springfield, MO; FT enrollment: 3,902)
Court: Oronogo City - Municipal Court (653 East Central Street).
Birthplace of: Hal Geer - Filmmaker.
Jasper County has a predicted average indoor radon screening level between 2 and 4 pCi/L (pico curies per liter) - Moderate Potential
Average household size:
This city:
3.1 people
Missouri:
2.5 people
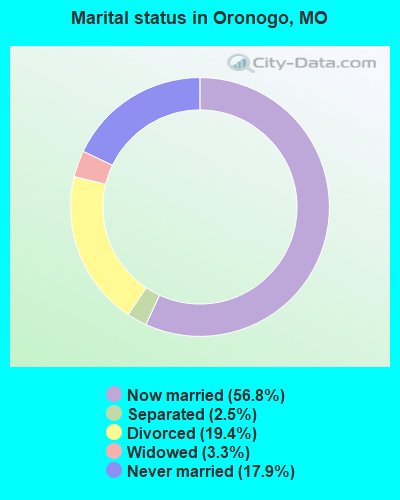
Percentage of family households:
This city:
83.7%
Whole state:
65.3%
Percentage of households with unmarried partners:
This city:
7.3%
Whole state:
6.7%
Likely homosexual households (counted as self-reported same-sex unmarried-partner households)
Lesbian couples: 0.5% of all households
Gay men: 0.0% of all households
Banks with branches in Oronogo (2011 data):
Hometown Bank, National Association: Oronogo Branch at 901 Hwy D, branch established on 2005/06/08. Info updated 2006/11/03: Bank assets: $182.7 mil, Deposits: $150.2 mil, headquarters in Carthage, MO, negative income in the last year, Commercial Lending Specialization, 7 total offices, Holding Company: Hometown Bancshares, Inc.
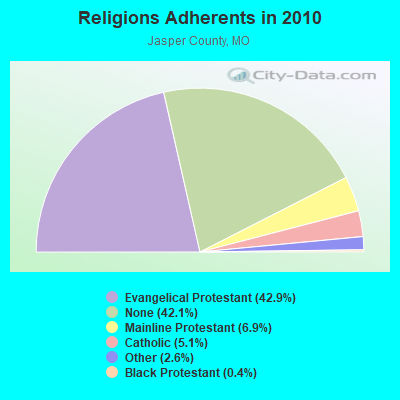
Religion statistics for Oronogo, MO (based on Jasper County data)
Religion
Adherents
Congregations
Evangelical Protestant
50,313
149
Mainline Protestant
8,100
35
Catholic
6,024
5
Other
3,052
18
Black Protestant
502
2
None
49,413
-
Source: Clifford Grammich, Kirk Hadaway, Richard Houseal, Dale E.Jones, Alexei Krindatch, Richie Stanley and Richard H.Taylor. 2012. 2010 U.S.Religion Census: Religious Congregations & Membership Study. Association of Statisticians of American Religious Bodies. Jones, Dale E., et al. 2002. Congregations and Membership in the United States 2000. Nashville, TN: Glenmary Research Center. Graphs represent county-level data
W Well- Central Ave, Just W Of Elliot St (Lat: 37.189028 Lon: -94.475889), Type: Tower, Structure height: 9.1 m, Call Sign: WQDV578, Assigned Frequencies: 451.037 MHz, Grant Date: 11/10/2015, Expiration Date: 11/08/2025, Certifier: James Watkins, Registrant: Oronogo Police Department, 653 E. Central, Oronogo, MO 64855, Phone: (417) 673-1916, Fax: (417) 673-2113, Email:
Aircraft: PIPER PA-28-140 (Category: Land, Seats: 4, Weight: Up to 12,499 Pounds, Speed: 107 mph), Engine: LYCOMING 0-320 SERIES (180 HP) (Reciprocating) N-Number: 6191W, N6191W, N-6191W, Serial Number: 28-20219, Year manufactured: 1964, Airworthiness Date: 07/14/1964, Certificate Issue Date: 01/19/2005 Registrant (Individual): Nathaniel T Harris, 244 Mabel Ct, Oronogo, MO 64855
Aircraft: GOODMAN JOHN W GN1 AIRCAMPER (Category: Land, Seats: 2, Weight: Up to 12,499 Pounds), Engine: CONT MOTOR O-200A (100 HP) (Reciprocating) N-Number: 23RT, N23RT, N-23RT, Serial Number: 102, Year manufactured: 2017, Airworthiness Date: 03/09/2017, Certificate Issue Date: 11/23/2016 Registrant (Individual): John W Goodman, 20262 County Road 220, Oronogo, MO 64855
Aircraft: PIPER PA-22-160 (Category: Land, Seats: 4, Weight: Up to 12,499 Pounds, Speed: 94 mph), Engine: LYCOMING 0-320 SERIES (180 HP) (Reciprocating) N-Number: 9414D, N9414D, N-9414D, Serial Number: 22-6388, Year manufactured: 1958, Airworthiness Date: 10/13/1958, Certificate Issue Date: 05/09/2003 Registrant (Individual): Ron G West, 205 Ivy Rd, Oronogo, MO 64855 Deregistered:Cancel Date: 04/18/2017
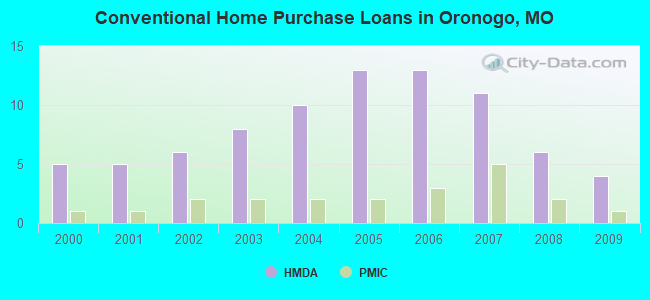
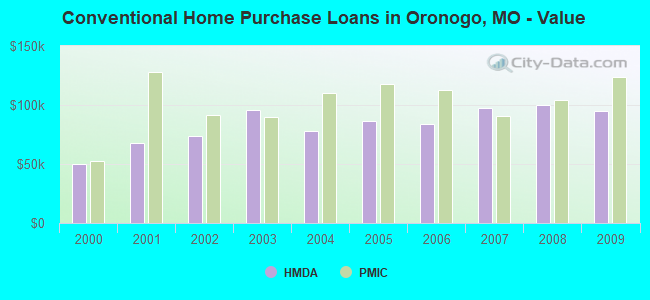
Home Mortgage Disclosure Act Aggregated Statistics For Year 2009 (Based on 1 partial tract)
A) FHA, FSA/RHS & VA Home Purchase Loans
B) Conventional Home Purchase Loans
C) Refinancings
D) Home Improvement Loans
F) Non-occupant Loans on < 5 Family Dwellings (A B C & D)
G) Loans On Manufactured Home Dwelling (A B C & D)
Number
Average Value
Number
Average Value
Number
Average Value
Number
Average Value
Number
Average Value
Number
Average Value
LOANS ORIGINATED
5
$128,114
4
$94,775
13
$137,735
1
$34,360
2
$74,590
1
$18,300
APPLICATIONS APPROVED, NOT ACCEPTED
0
$0
0
$0
1
$80,960
0
$0
0
$0
0
$0
APPLICATIONS DENIED
1
$79,410
1
$46,750
5
$100,010
1
$24,150
0
$0
0
$0
APPLICATIONS WITHDRAWN
0
$0
0
$0
4
$105,758
0
$0
0
$0
0
$0
FILES CLOSED FOR INCOMPLETENESS
0
$0
0
$0
0
$0
0
$0
0
$0
0
$0
Aggregated Statistics For Year 2008 (Based on 1 partial tract)
A) FHA, FSA/RHS & VA Home Purchase Loans
B) Conventional Home Purchase Loans
C) Refinancings
D) Home Improvement Loans
F) Non-occupant Loans on < 5 Family Dwellings (A B C & D)
G) Loans On Manufactured Home Dwelling (A B C & D)
Number
Average Value
Number
Average Value
Number
Average Value
Number
Average Value
Number
Average Value
Number
Average Value
LOANS ORIGINATED
3
$119,423
6
$99,628
9
$119,922
1
$32,670
2
$58,820
1
$29,000
APPLICATIONS APPROVED, NOT ACCEPTED
0
$0
0
$0
1
$107,500
0
$0
0
$0
0
$0
APPLICATIONS DENIED
0
$0
2
$70,895
6
$140,472
2
$46,075
0
$0
1
$82,160
APPLICATIONS WITHDRAWN
0
$0
1
$61,110
3
$101,940
0
$0
0
$0
0
$0
FILES CLOSED FOR INCOMPLETENESS
0
$0
0
$0
1
$64,840
0
$0
0
$0
0
$0
Aggregated Statistics For Year 2007 (Based on 1 partial tract)
A) FHA, FSA/RHS & VA Home Purchase Loans
B) Conventional Home Purchase Loans
C) Refinancings
D) Home Improvement Loans
F) Non-occupant Loans on < 5 Family Dwellings (A B C & D)
G) Loans On Manufactured Home Dwelling (A B C & D)
Number
Average Value
Number
Average Value
Number
Average Value
Number
Average Value
Number
Average Value
Number
Average Value
LOANS ORIGINATED
1
$183,320
11
$97,293
10
$114,351
2
$57,340
3
$57,940
1
$63,640
APPLICATIONS APPROVED, NOT ACCEPTED
0
$0
1
$81,170
2
$90,850
0
$0
0
$0
0
$0
APPLICATIONS DENIED
0
$0
3
$79,037
8
$101,675
3
$34,050
0
$0
2
$55,125
APPLICATIONS WITHDRAWN
0
$0
1
$69,700
3
$86,943
1
$28,300
0
$0
0
$0
FILES CLOSED FOR INCOMPLETENESS
0
$0
0
$0
1
$140,940
0
$0
0
$0
0
$0
Aggregated Statistics For Year 2006 (Based on 1 partial tract)
A) FHA, FSA/RHS & VA Home Purchase Loans
B) Conventional Home Purchase Loans
C) Refinancings
D) Home Improvement Loans
F) Non-occupant Loans on < 5 Family Dwellings (A B C & D)
G) Loans On Manufactured Home Dwelling (A B C & D)
Number
Average Value
Number
Average Value
Number
Average Value
Number
Average Value
Number
Average Value
Number
Average Value
LOANS ORIGINATED
2
$89,445
13
$83,511
10
$100,390
3
$31,867
3
$72,160
2
$40,760
APPLICATIONS APPROVED, NOT ACCEPTED
0
$0
1
$98,280
1
$60,830
0
$0
0
$0
0
$0
APPLICATIONS DENIED
0
$0
4
$72,792
9
$92,928
3
$27,830
0
$0
1
$58,360
APPLICATIONS WITHDRAWN
0
$0
2
$62,725
5
$94,604
1
$48,150
0
$0
0
$0
FILES CLOSED FOR INCOMPLETENESS
0
$0
0
$0
1
$96,310
0
$0
0
$0
0
$0
Aggregated Statistics For Year 2005 (Based on 1 partial tract)
A) FHA, FSA/RHS & VA Home Purchase Loans
B) Conventional Home Purchase Loans
C) Refinancings
D) Home Improvement Loans
F) Non-occupant Loans on < 5 Family Dwellings (A B C & D)
G) Loans On Manufactured Home Dwelling (A B C & D)
Number
Average Value
Number
Average Value
Number
Average Value
Number
Average Value
Number
Average Value
Number
Average Value
LOANS ORIGINATED
1
$128,900
13
$86,370
12
$89,426
2
$50,475
3
$45,807
1
$48,220
APPLICATIONS APPROVED, NOT ACCEPTED
0
$0
1
$60,540
1
$95,600
0
$0
0
$0
0
$0
APPLICATIONS DENIED
0
$0
3
$41,113
10
$74,779
2
$23,585
0
$0
1
$37,660
APPLICATIONS WITHDRAWN
0
$0
2
$79,550
6
$84,738
1
$48,790
0
$0
0
$0
FILES CLOSED FOR INCOMPLETENESS
0
$0
0
$0
0
$0
0
$0
0
$0
0
$0
Aggregated Statistics For Year 2004 (Based on 1 partial tract)
A) FHA, FSA/RHS & VA Home Purchase Loans
B) Conventional Home Purchase Loans
C) Refinancings
D) Home Improvement Loans
F) Non-occupant Loans on < 5 Family Dwellings (A B C & D)
G) Loans On Manufactured Home Dwelling (A B C & D)
Number
Average Value
Number
Average Value
Number
Average Value
Number
Average Value
Number
Average Value
Number
Average Value
LOANS ORIGINATED
3
$86,123
10
$77,665
12
$81,388
2
$30,025
3
$51,463
1
$75,540
APPLICATIONS APPROVED, NOT ACCEPTED
0
$0
1
$47,240
2
$98,525
0
$0
0
$0
0
$0
APPLICATIONS DENIED
0
$0
2
$63,890
8
$83,328
2
$27,740
1
$57,380
1
$44,350
APPLICATIONS WITHDRAWN
0
$0
1
$75,820
6
$83,248
0
$0
0
$0
0
$0
FILES CLOSED FOR INCOMPLETENESS
0
$0
0
$0
2
$80,995
0
$0
0
$0
0
$0
Aggregated Statistics For Year 2003 (Based on 1 partial tract)
A) FHA, FSA/RHS & VA Home Purchase Loans
B) Conventional Home Purchase Loans
C) Refinancings
D) Home Improvement Loans
F) Non-occupant Loans on < 5 Family Dwellings (A B C & D)
Number
Average Value
Number
Average Value
Number
Average Value
Number
Average Value
Number
Average Value
LOANS ORIGINATED
2
$79,060
8
$95,532
19
$79,693
2
$20,625
3
$109,283
APPLICATIONS APPROVED, NOT ACCEPTED
0
$0
1
$34,360
2
$74,625
0
$0
0
$0
APPLICATIONS DENIED
0
$0
3
$46,863
8
$74,704
1
$23,800
0
$0
APPLICATIONS WITHDRAWN
0
$0
1
$64,280
4
$79,622
0
$0
1
$38,370
FILES CLOSED FOR INCOMPLETENESS
0
$0
0
$0
1
$54,000
0
$0
0
$0
Aggregated Statistics For Year 2002 (Based on 1 partial tract)
A) FHA, FSA/RHS & VA Home Purchase Loans
B) Conventional Home Purchase Loans
C) Refinancings
D) Home Improvement Loans
F) Non-occupant Loans on < 5 Family Dwellings (A B C & D)
Number
Average Value
Number
Average Value
Number
Average Value
Number
Average Value
Number
Average Value
LOANS ORIGINATED
2
$82,650
6
$73,780
14
$82,725
1
$47,380
2
$53,925
APPLICATIONS APPROVED, NOT ACCEPTED
0
$0
1
$75,680
1
$91,870
0
$0
0
$0
APPLICATIONS DENIED
0
$0
2
$48,470
7
$63,511
1
$5,420
0
$0
APPLICATIONS WITHDRAWN
0
$0
1
$62,160
5
$78,960
1
$9,860
0
$0
FILES CLOSED FOR INCOMPLETENESS
0
$0
0
$0
1
$69,630
0
$0
0
$0
Aggregated Statistics For Year 2001 (Based on 1 partial tract)
A) FHA, FSA/RHS & VA Home Purchase Loans
B) Conventional Home Purchase Loans
C) Refinancings
D) Home Improvement Loans
F) Non-occupant Loans on < 5 Family Dwellings (A B C & D)
Number
Average Value
Number
Average Value
Number
Average Value
Number
Average Value
Number
Average Value
LOANS ORIGINATED
2
$77,615
5
$67,852
10
$73,265
1
$16,830
1
$49,910
APPLICATIONS APPROVED, NOT ACCEPTED
0
$0
0
$0
1
$34,360
0
$0
0
$0
APPLICATIONS DENIED
0
$0
4
$36,220
5
$51,560
1
$24,430
0
$0
APPLICATIONS WITHDRAWN
0
$0
1
$94,410
2
$68,710
0
$0
0
$0
FILES CLOSED FOR INCOMPLETENESS
0
$0
0
$0
1
$43,080
0
$0
0
$0
Aggregated Statistics For Year 2000 (Based on 1 partial tract)
A) FHA, FSA/RHS & VA Home Purchase Loans
B) Conventional Home Purchase Loans
C) Refinancings
D) Home Improvement Loans
F) Non-occupant Loans on < 5 Family Dwellings (A B C & D)
Detailed PMIC statistics for the following Tracts:0115.00
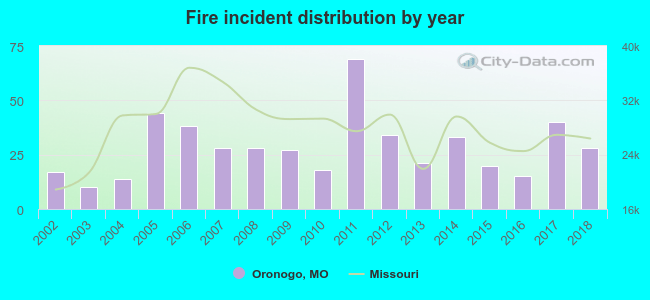
2002 - 2018 National Fire Incident Reporting System (NFIRS) incidents
Based on the data from the years 2002 - 2018 the average number of fire incidents per year is 28. The highest number of reported fires - 69 took place in 2011, and the least - 10 in 2003. The data has an increasing trend.
When looking into fire subcategories, the most reports belonged to: Outside Fires (63.4%), and Structure Fires (25.4%).
Fire incident types reported to NFIRS in Oronogo, MO


 Recent articles from our blog. Our writers, many of them Ph.D. graduates or candidates, create easy-to-read articles on a wide variety of topics.

 (65.1 miles


 Based on the data from the years 2002 - 2018 the average number of fire incidents per year is 28. The highest number of reported fires - 69 took place in 2011, and the least - 10 in 2003. The data has an increasing trend.
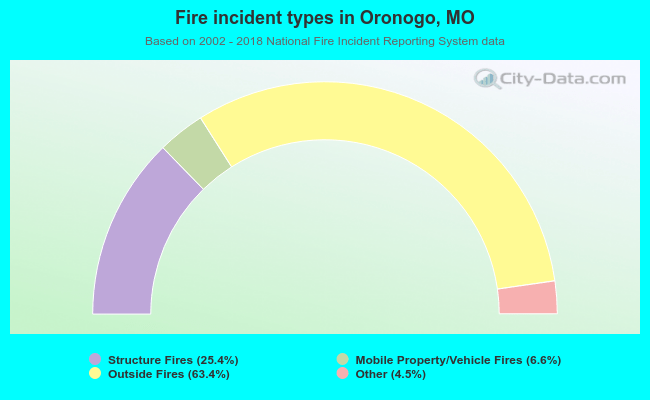 When looking into fire subcategories, the most reports belonged to: Outside Fires (63.4%), and Structure Fires (25.4%).