Webb City, Missouri Submit your own pictures of this city and show them to the world
OSM Map
General Map
Google Map
MSN Map
OSM Map
General Map
Google Map
MSN Map
OSM Map
General Map
Google Map
MSN Map
OSM Map
General Map
Google Map
MSN Map
Please wait while loading the map...
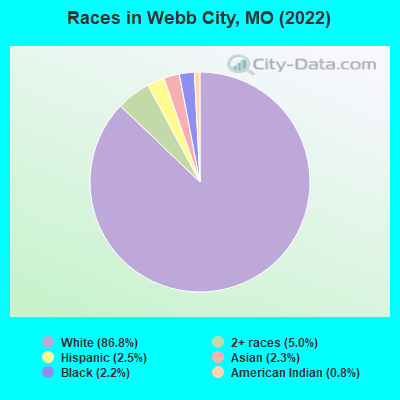
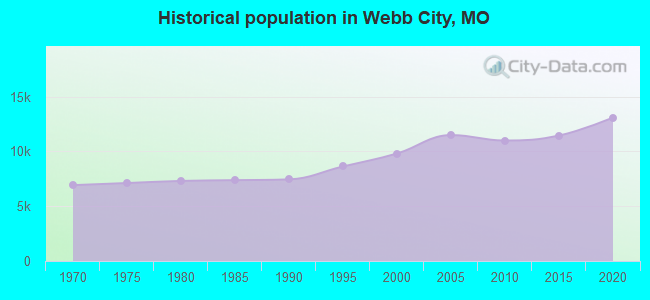
Population in 2022: 13,165 (97% urban, 3% rural). Population change since 2000: +34.2%Males: 5,915 Females: 7,250
March 2022 cost of living index in Webb City: 81.9 (low, U.S. average is 100) Percentage of residents living in poverty in 2022: 21.0%for White Non-Hispanic residents , 50.8% for Hispanic or Latino residents , 39.7% for two or more races residents )
Profiles of local businesses
Business Search - 14 Million verified businesses
Data:
Median household income ($)
Median household income (% change since 2000)
Household income diversity
Ratio of average income to average house value (%)
Ratio of average income to average rent
Median household income ($) - White
Median household income ($) - Black or African American
Median household income ($) - Asian
Median household income ($) - Hispanic or Latino
Median household income ($) - American Indian and Alaska Native
Median household income ($) - Multirace
Median household income ($) - Other Race
Median household income for houses/condos with a mortgage ($)
Median household income for apartments without a mortgage ($)
Races - White alone (%)
Races - White alone (% change since 2000)
Races - Black alone (%)
Races - Black alone (% change since 2000)
Races - American Indian alone (%)
Races - American Indian alone (% change since 2000)
Races - Asian alone (%)
Races - Asian alone (% change since 2000)
Races - Hispanic (%)
Races - Hispanic (% change since 2000)
Races - Native Hawaiian and Other Pacific Islander alone (%)
Races - Native Hawaiian and Other Pacific Islander alone (% change since 2000)
Races - Two or more races (%)
Races - Two or more races (% change since 2000)
Races - Other race alone (%)
Races - Other race alone (% change since 2000)
Racial diversity
Unemployment (%)
Unemployment (% change since 2000)
Unemployment (%) - White
Unemployment (%) - Black or African American
Unemployment (%) - Asian
Unemployment (%) - Hispanic or Latino
Unemployment (%) - American Indian and Alaska Native
Unemployment (%) - Multirace
Unemployment (%) - Other Race
Population density (people per square mile)
Population - Males (%)
Population - Females (%)
Population - Males (%) - White
Population - Males (%) - Black or African American
Population - Males (%) - Asian
Population - Males (%) - Hispanic or Latino
Population - Males (%) - American Indian and Alaska Native
Population - Males (%) - Multirace
Population - Males (%) - Other Race
Population - Females (%) - White
Population - Females (%) - Black or African American
Population - Females (%) - Asian
Population - Females (%) - Hispanic or Latino
Population - Females (%) - American Indian and Alaska Native
Population - Females (%) - Multirace
Population - Females (%) - Other Race
Coronavirus confirmed cases (Jun 16, 2024)
Deaths caused by coronavirus (Jun 16, 2024)
Coronavirus confirmed cases (per 100k population) (Jun 16, 2024)
Deaths caused by coronavirus (per 100k population) (Jun 16, 2024)
Daily increase in number of cases (Jun 16, 2024)
Weekly increase in number of cases (Jun 16, 2024)
Cases doubled (in days) (Jun 16, 2024)
Hospitalized patients (Apr 18, 2022)
Negative test results (Apr 18, 2022)
Total test results (Apr 18, 2022)
COVID Vaccine doses distributed (per 100k population) (Sep 19, 2023)
COVID Vaccine doses administered (per 100k population) (Sep 19, 2023)
COVID Vaccine doses distributed (Sep 19, 2023)
COVID Vaccine doses administered (Sep 19, 2023)
Likely homosexual households (%)
Likely homosexual households (% change since 2000)
Likely homosexual households - Lesbian couples (%)
Likely homosexual households - Lesbian couples (% change since 2000)
Likely homosexual households - Gay men (%)
Likely homosexual households - Gay men (% change since 2000)
Cost of living index
Median gross rent ($)
Median contract rent ($)
Median monthly housing costs ($)
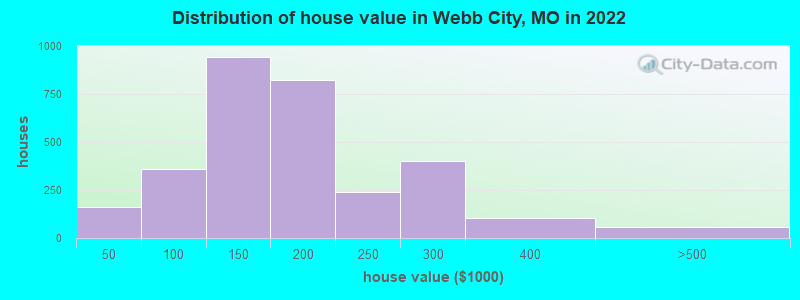
Median house or condo value ($)
Median house or condo value ($ change since 2000)
Mean house or condo value by units in structure - 1, detached ($)
Mean house or condo value by units in structure - 1, attached ($)
Mean house or condo value by units in structure - 2 ($)
Mean house or condo value by units in structure by units in structure - 3 or 4 ($)
Mean house or condo value by units in structure - 5 or more ($)
Mean house or condo value by units in structure - Boat, RV, van, etc. ($)
Mean house or condo value by units in structure - Mobile home ($)
Median house or condo value ($) - White
Median house or condo value ($) - Black or African American
Median house or condo value ($) - Asian
Median house or condo value ($) - Hispanic or Latino
Median house or condo value ($) - American Indian and Alaska Native
Median house or condo value ($) - Multirace
Median house or condo value ($) - Other Race
Median resident age
Resident age diversity
Median resident age - Males
Median resident age - Females
Median resident age - White
Median resident age - Black or African American
Median resident age - Asian
Median resident age - Hispanic or Latino
Median resident age - American Indian and Alaska Native
Median resident age - Multirace
Median resident age - Other Race
Median resident age - Males - White
Median resident age - Males - Black or African American
Median resident age - Males - Asian
Median resident age - Males - Hispanic or Latino
Median resident age - Males - American Indian and Alaska Native
Median resident age - Males - Multirace
Median resident age - Males - Other Race
Median resident age - Females - White
Median resident age - Females - Black or African American
Median resident age - Females - Asian
Median resident age - Females - Hispanic or Latino
Median resident age - Females - American Indian and Alaska Native
Median resident age - Females - Multirace
Median resident age - Females - Other Race
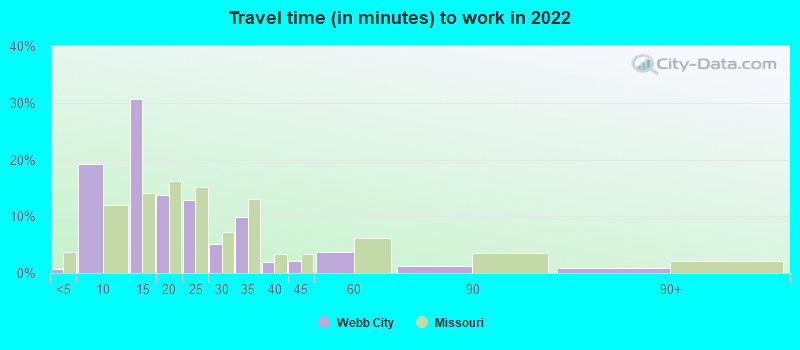
Commute - mean travel time to work (minutes)
Travel time to work - Less than 5 minutes (%)
Travel time to work - Less than 5 minutes (% change since 2000)
Travel time to work - 5 to 9 minutes (%)
Travel time to work - 5 to 9 minutes (% change since 2000)
Travel time to work - 10 to 19 minutes (%)
Travel time to work - 10 to 19 minutes (% change since 2000)
Travel time to work - 20 to 29 minutes (%)
Travel time to work - 20 to 29 minutes (% change since 2000)
Travel time to work - 30 to 39 minutes (%)
Travel time to work - 30 to 39 minutes (% change since 2000)
Travel time to work - 40 to 59 minutes (%)
Travel time to work - 40 to 59 minutes (% change since 2000)
Travel time to work - 60 to 89 minutes (%)
Travel time to work - 60 to 89 minutes (% change since 2000)
Travel time to work - 90 or more minutes (%)
Travel time to work - 90 or more minutes (% change since 2000)
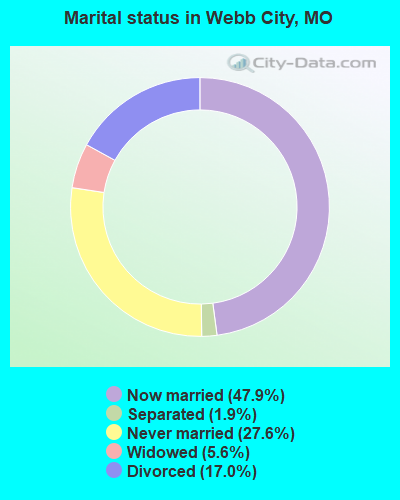
Marital status - Never married (%)
Marital status - Now married (%)
Marital status - Separated (%)
Marital status - Widowed (%)
Marital status - Divorced (%)
Median family income ($)
Median family income (% change since 2000)
Median non-family income ($)
Median non-family income (% change since 2000)
Median per capita income ($)
Median per capita income (% change since 2000)
Median family income ($) - White
Median family income ($) - Black or African American
Median family income ($) - Asian
Median family income ($) - Hispanic or Latino
Median family income ($) - American Indian and Alaska Native
Median family income ($) - Multirace
Median family income ($) - Other Race
Median year house/condo built
Median year apartment built
Year house built - Built 2005 or later (%)
Year house built - Built 2000 to 2004 (%)
Year house built - Built 1990 to 1999 (%)
Year house built - Built 1980 to 1989 (%)
Year house built - Built 1970 to 1979 (%)
Year house built - Built 1960 to 1969 (%)
Year house built - Built 1950 to 1959 (%)
Year house built - Built 1940 to 1949 (%)
Year house built - Built 1939 or earlier (%)
Average household size
Household density (households per square mile)
Average household size - White
Average household size - Black or African American
Average household size - Asian
Average household size - Hispanic or Latino
Average household size - American Indian and Alaska Native
Average household size - Multirace
Average household size - Other Race
Occupied housing units (%)
Vacant housing units (%)
Owner occupied housing units (%)
Renter occupied housing units (%)
Vacancy status - For rent (%)
Vacancy status - For sale only (%)
Vacancy status - Rented or sold, not occupied (%)
Vacancy status - For seasonal, recreational, or occasional use (%)
Vacancy status - For migrant workers (%)
Vacancy status - Other vacant (%)
Residents with income below the poverty level (%)
Residents with income below 50% of the poverty level (%)
Children below poverty level (%)
Poor families by family type - Married-couple family (%)
Poor families by family type - Male, no wife present (%)
Poor families by family type - Female, no husband present (%)
Poverty status for native-born residents (%)
Poverty status for foreign-born residents (%)
Poverty among high school graduates not in families (%)
Poverty among people who did not graduate high school not in families (%)
Residents with income below the poverty level (%) - White
Residents with income below the poverty level (%) - Black or African American
Residents with income below the poverty level (%) - Asian
Residents with income below the poverty level (%) - Hispanic or Latino
Residents with income below the poverty level (%) - American Indian and Alaska Native
Residents with income below the poverty level (%) - Multirace
Residents with income below the poverty level (%) - Other Race
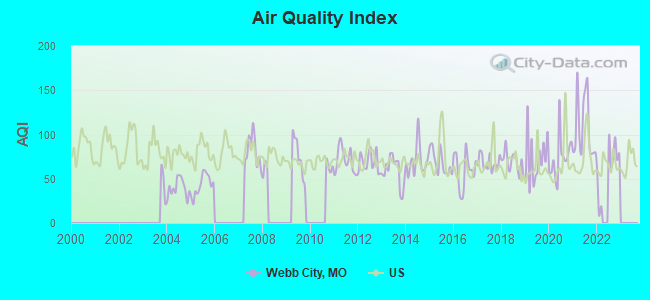
Air pollution - Air Quality Index (AQI)
Air pollution - CO
Air pollution - NO2
Air pollution - SO2
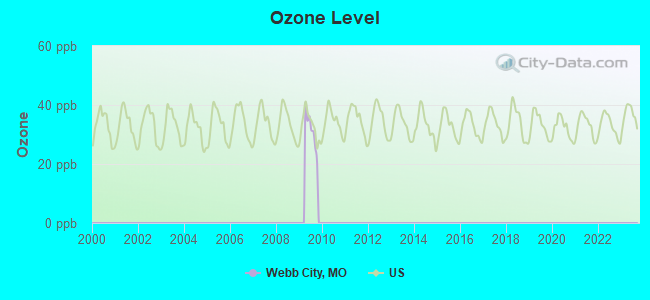
Air pollution - Ozone
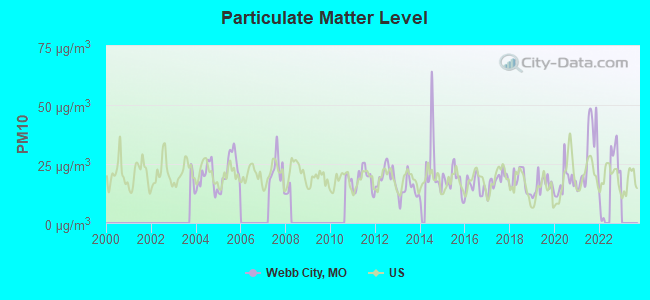
Air pollution - PM10
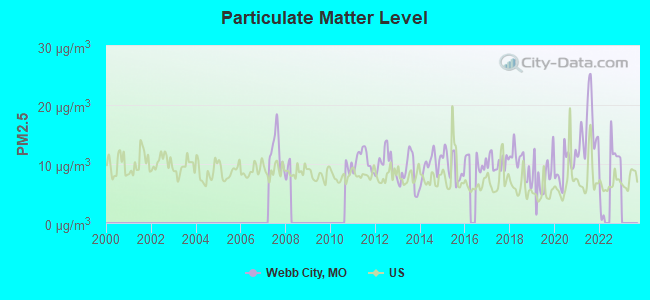
Air pollution - PM25
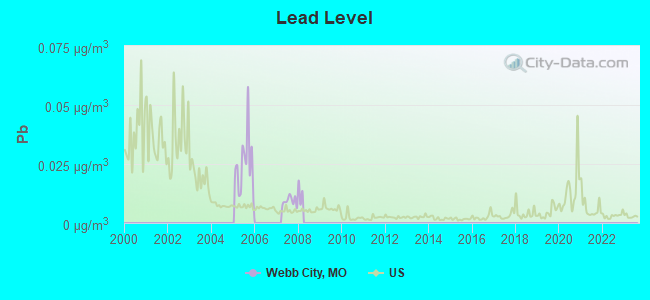
Air pollution - Pb
Crime - Murders per 100,000 population
Crime - Rapes per 100,000 population
Crime - Robberies per 100,000 population
Crime - Assaults per 100,000 population
Crime - Burglaries per 100,000 population
Crime - Thefts per 100,000 population
Crime - Auto thefts per 100,000 population
Crime - Arson per 100,000 population
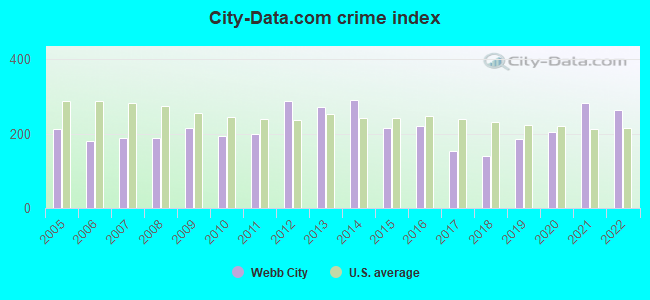
Crime - City-data.com crime index
Crime - Violent crime index
Crime - Property crime index
Crime - Murders per 100,000 population (5 year average)
Crime - Rapes per 100,000 population (5 year average)
Crime - Robberies per 100,000 population (5 year average)
Crime - Assaults per 100,000 population (5 year average)
Crime - Burglaries per 100,000 population (5 year average)
Crime - Thefts per 100,000 population (5 year average)
Crime - Auto thefts per 100,000 population (5 year average)
Crime - Arson per 100,000 population (5 year average)
Crime - City-data.com crime index (5 year average)
Crime - Violent crime index (5 year average)
Crime - Property crime index (5 year average)
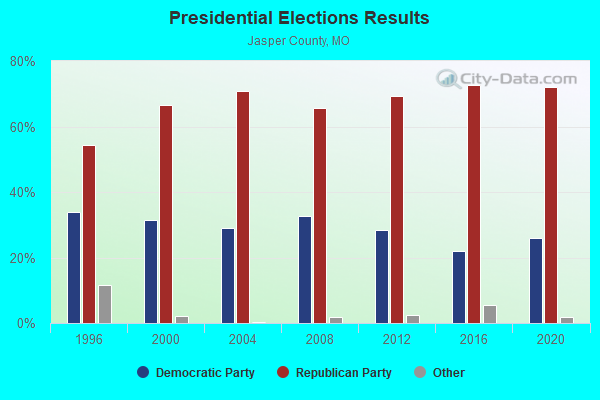
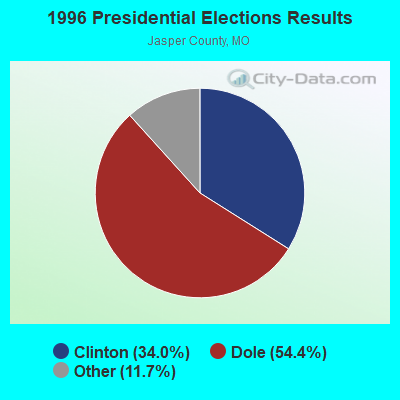
1996 Presidential Elections Results (%) - Democratic Party (Clinton)
1996 Presidential Elections Results (%) - Republican Party (Dole)
1996 Presidential Elections Results (%) - Other
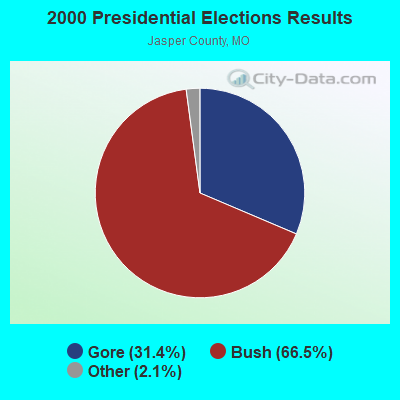
2000 Presidential Elections Results (%) - Democratic Party (Gore)
2000 Presidential Elections Results (%) - Republican Party (Bush)
2000 Presidential Elections Results (%) - Other
2004 Presidential Elections Results (%) - Democratic Party (Kerry)
2004 Presidential Elections Results (%) - Republican Party (Bush)
2004 Presidential Elections Results (%) - Other
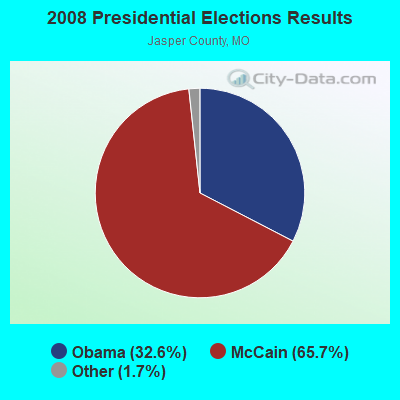
2008 Presidential Elections Results (%) - Democratic Party (Obama)
2008 Presidential Elections Results (%) - Republican Party (McCain)
2008 Presidential Elections Results (%) - Other
2012 Presidential Elections Results (%) - Democratic Party (Obama)
2012 Presidential Elections Results (%) - Republican Party (Romney)
2012 Presidential Elections Results (%) - Other
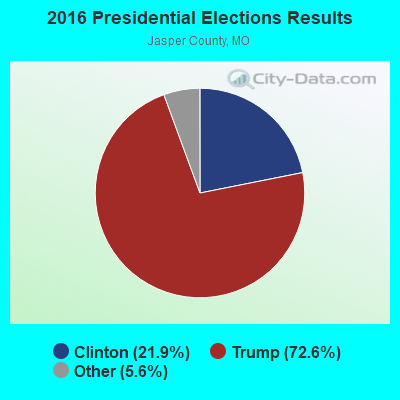
2016 Presidential Elections Results (%) - Democratic Party (Clinton)
2016 Presidential Elections Results (%) - Republican Party (Trump)
2016 Presidential Elections Results (%) - Other
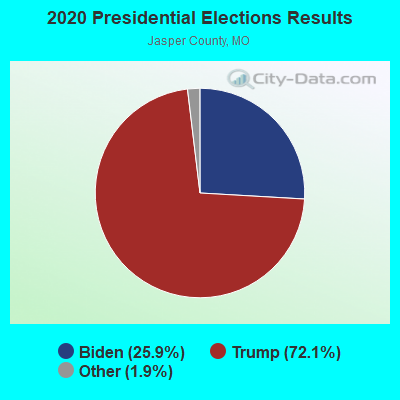
2020 Presidential Elections Results (%) - Democratic Party (Biden)
2020 Presidential Elections Results (%) - Republican Party (Trump)
2020 Presidential Elections Results (%) - Other
Ancestries Reported - Arab (%)
Ancestries Reported - Czech (%)
Ancestries Reported - Danish (%)
Ancestries Reported - Dutch (%)
Ancestries Reported - English (%)
Ancestries Reported - French (%)
Ancestries Reported - French Canadian (%)
Ancestries Reported - German (%)
Ancestries Reported - Greek (%)
Ancestries Reported - Hungarian (%)
Ancestries Reported - Irish (%)
Ancestries Reported - Italian (%)
Ancestries Reported - Lithuanian (%)
Ancestries Reported - Norwegian (%)
Ancestries Reported - Polish (%)
Ancestries Reported - Portuguese (%)
Ancestries Reported - Russian (%)
Ancestries Reported - Scotch-Irish (%)
Ancestries Reported - Scottish (%)
Ancestries Reported - Slovak (%)
Ancestries Reported - Subsaharan African (%)
Ancestries Reported - Swedish (%)
Ancestries Reported - Swiss (%)
Ancestries Reported - Ukrainian (%)
Ancestries Reported - United States (%)
Ancestries Reported - Welsh (%)
Ancestries Reported - West Indian (%)
Ancestries Reported - Other (%)
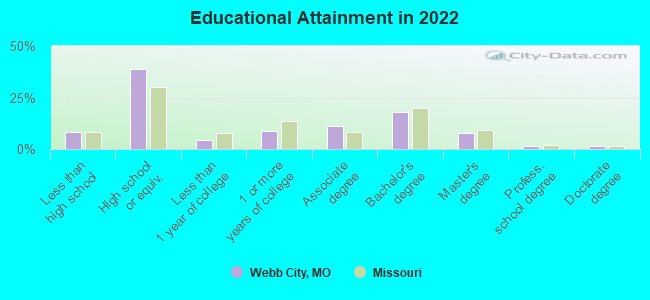
Educational Attainment - No schooling completed (%)
Educational Attainment - Less than high school (%)
Educational Attainment - High school or equivalent (%)
Educational Attainment - Less than 1 year of college (%)
Educational Attainment - 1 or more years of college (%)
Educational Attainment - Associate degree (%)
Educational Attainment - Bachelor's degree (%)
Educational Attainment - Master's degree (%)
Educational Attainment - Professional school degree (%)
Educational Attainment - Doctorate degree (%)
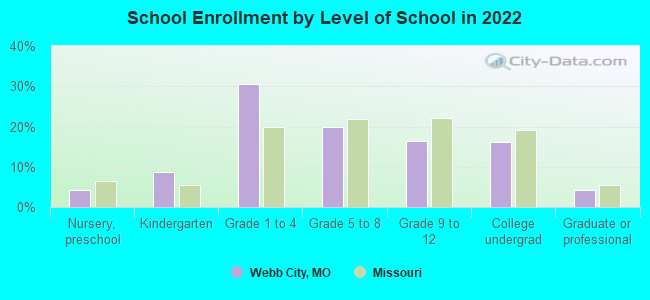
School Enrollment - Nursery, preschool (%)
School Enrollment - Kindergarten (%)
School Enrollment - Grade 1 to 4 (%)
School Enrollment - Grade 5 to 8 (%)
School Enrollment - Grade 9 to 12 (%)
School Enrollment - College undergrad (%)
School Enrollment - Graduate or professional (%)
School Enrollment - Not enrolled in school (%)
School enrollment - Public schools (%)
School enrollment - Private schools (%)
School enrollment - Not enrolled (%)
Median number of rooms in houses and condos
Median number of rooms in apartments
Housing units lacking complete plumbing facilities (%)
Housing units lacking complete kitchen facilities (%)
Density of houses
Urban houses (%)
Rural houses (%)
Households with people 60 years and over (%)
Households with people 65 years and over (%)
Households with people 75 years and over (%)
Households with one or more nonrelatives (%)
Households with no nonrelatives (%)
Population in households (%)
Family households (%)
Nonfamily households (%)
Population in families (%)
Family households with own children (%)
Median number of bedrooms in owner occupied houses
Mean number of bedrooms in owner occupied houses
Median number of bedrooms in renter occupied houses
Mean number of bedrooms in renter occupied houses
Median number of vehichles in owner occupied houses
Mean number of vehichles in owner occupied houses
Median number of vehichles in renter occupied houses
Mean number of vehichles in renter occupied houses
Mortgage status - with mortgage (%)
Mortgage status - with second mortgage (%)
Mortgage status - with home equity loan (%)
Mortgage status - with both second mortgage and home equity loan (%)
Mortgage status - without a mortgage (%)
Average family size
Average family size - White
Average family size - Black or African American
Average family size - Asian
Average family size - Hispanic or Latino
Average family size - American Indian and Alaska Native
Average family size - Multirace
Average family size - Other Race
Geographical mobility - Same house 1 year ago (%)
Geographical mobility - Moved within same county (%)
Geographical mobility - Moved from different county within same state (%)
Geographical mobility - Moved from different state (%)
Geographical mobility - Moved from abroad (%)
Place of birth - Born in state of residence (%)
Place of birth - Born in other state (%)
Place of birth - Native, outside of US (%)
Place of birth - Foreign born (%)
Housing units in structures - 1, detached (%)
Housing units in structures - 1, attached (%)
Housing units in structures - 2 (%)
Housing units in structures - 3 or 4 (%)
Housing units in structures - 5 to 9 (%)
Housing units in structures - 10 to 19 (%)
Housing units in structures - 20 to 49 (%)
Housing units in structures - 50 or more (%)
Housing units in structures - Mobile home (%)
Housing units in structures - Boat, RV, van, etc. (%)
House/condo owner moved in on average (years ago)
Renter moved in on average (years ago)
Year householder moved into unit - Moved in 1999 to March 2000 (%)
Year householder moved into unit - Moved in 1995 to 1998 (%)
Year householder moved into unit - Moved in 1990 to 1994 (%)
Year householder moved into unit - Moved in 1980 to 1989 (%)
Year householder moved into unit - Moved in 1970 to 1979 (%)
Year householder moved into unit - Moved in 1969 or earlier (%)
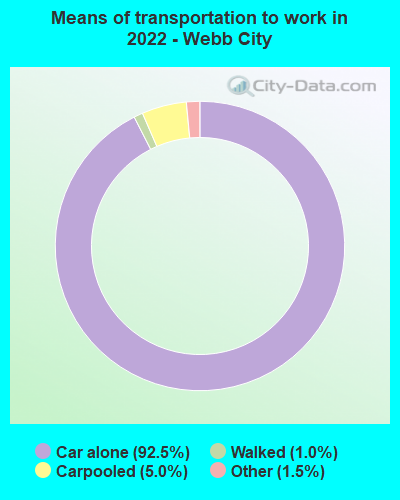
Means of transportation to work - Drove car alone (%)
Means of transportation to work - Carpooled (%)
Means of transportation to work - Public transportation (%)
Means of transportation to work - Bus or trolley bus (%)
Means of transportation to work - Streetcar or trolley car (%)
Means of transportation to work - Subway or elevated (%)
Means of transportation to work - Railroad (%)
Means of transportation to work - Ferryboat (%)
Means of transportation to work - Taxicab (%)
Means of transportation to work - Motorcycle (%)
Means of transportation to work - Bicycle (%)
Means of transportation to work - Walked (%)
Means of transportation to work - Other means (%)
Working at home (%)
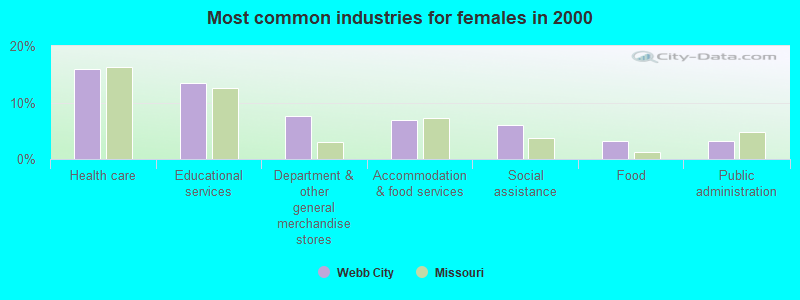
Industry diversity
Most Common Industries - Agriculture, forestry, fishing and hunting, and mining (%)
Most Common Industries - Agriculture, forestry, fishing and hunting (%)
Most Common Industries - Mining, quarrying, and oil and gas extraction (%)
Most Common Industries - Construction (%)
Most Common Industries - Manufacturing (%)
Most Common Industries - Wholesale trade (%)
Most Common Industries - Retail trade (%)
Most Common Industries - Transportation and warehousing, and utilities (%)
Most Common Industries - Transportation and warehousing (%)
Most Common Industries - Utilities (%)
Most Common Industries - Information (%)
Most Common Industries - Finance and insurance, and real estate and rental and leasing (%)
Most Common Industries - Finance and insurance (%)
Most Common Industries - Real estate and rental and leasing (%)
Most Common Industries - Professional, scientific, and management, and administrative and waste management services (%)
Most Common Industries - Professional, scientific, and technical services (%)
Most Common Industries - Management of companies and enterprises (%)
Most Common Industries - Administrative and support and waste management services (%)
Most Common Industries - Educational services, and health care and social assistance (%)
Most Common Industries - Educational services (%)
Most Common Industries - Health care and social assistance (%)
Most Common Industries - Arts, entertainment, and recreation, and accommodation and food services (%)
Most Common Industries - Arts, entertainment, and recreation (%)
Most Common Industries - Accommodation and food services (%)
Most Common Industries - Other services, except public administration (%)
Most Common Industries - Public administration (%)
Occupation diversity
Most Common Occupations - Management, business, science, and arts occupations (%)
Most Common Occupations - Management, business, and financial occupations (%)
Most Common Occupations - Management occupations (%)
Most Common Occupations - Business and financial operations occupations (%)
Most Common Occupations - Computer, engineering, and science occupations (%)
Most Common Occupations - Computer and mathematical occupations (%)
Most Common Occupations - Architecture and engineering occupations (%)
Most Common Occupations - Life, physical, and social science occupations (%)
Most Common Occupations - Education, legal, community service, arts, and media occupations (%)
Most Common Occupations - Community and social service occupations (%)
Most Common Occupations - Legal occupations (%)
Most Common Occupations - Education, training, and library occupations (%)
Most Common Occupations - Arts, design, entertainment, sports, and media occupations (%)
Most Common Occupations - Healthcare practitioners and technical occupations (%)
Most Common Occupations - Health diagnosing and treating practitioners and other technical occupations (%)
Most Common Occupations - Health technologists and technicians (%)
Most Common Occupations - Service occupations (%)
Most Common Occupations - Healthcare support occupations (%)
Most Common Occupations - Protective service occupations (%)
Most Common Occupations - Fire fighting and prevention, and other protective service workers including supervisors (%)
Most Common Occupations - Law enforcement workers including supervisors (%)
Most Common Occupations - Food preparation and serving related occupations (%)
Most Common Occupations - Building and grounds cleaning and maintenance occupations (%)
Most Common Occupations - Personal care and service occupations (%)
Most Common Occupations - Sales and office occupations (%)
Most Common Occupations - Sales and related occupations (%)
Most Common Occupations - Office and administrative support occupations (%)
Most Common Occupations - Natural resources, construction, and maintenance occupations (%)
Most Common Occupations - Farming, fishing, and forestry occupations (%)
Most Common Occupations - Construction and extraction occupations (%)
Most Common Occupations - Installation, maintenance, and repair occupations (%)
Most Common Occupations - Production, transportation, and material moving occupations (%)
Most Common Occupations - Production occupations (%)
Most Common Occupations - Transportation occupations (%)
Most Common Occupations - Material moving occupations (%)
People in Group quarters - Institutionalized population (%)
People in Group quarters - Correctional institutions (%)
People in Group quarters - Federal prisons and detention centers (%)
People in Group quarters - Halfway houses (%)
People in Group quarters - Local jails and other confinement facilities (including police lockups) (%)
People in Group quarters - Military disciplinary barracks (%)
People in Group quarters - State prisons (%)
People in Group quarters - Other types of correctional institutions (%)
People in Group quarters - Nursing homes (%)
People in Group quarters - Hospitals/wards, hospices, and schools for the handicapped (%)
People in Group quarters - Hospitals/wards and hospices for chronically ill (%)
People in Group quarters - Hospices or homes for chronically ill (%)
People in Group quarters - Military hospitals or wards for chronically ill (%)
People in Group quarters - Other hospitals or wards for chronically ill (%)
People in Group quarters - Hospitals or wards for drug/alcohol abuse (%)
People in Group quarters - Mental (Psychiatric) hospitals or wards (%)
People in Group quarters - Schools, hospitals, or wards for the mentally retarded (%)
People in Group quarters - Schools, hospitals, or wards for the physically handicapped (%)
People in Group quarters - Institutions for the deaf (%)
People in Group quarters - Institutions for the blind (%)
People in Group quarters - Orthopedic wards and institutions for the physically handicapped (%)
People in Group quarters - Wards in general hospitals for patients who have no usual home elsewhere (%)
People in Group quarters - Wards in military hospitals for patients who have no usual home elsewhere (%)
People in Group quarters - Juvenile institutions (%)
People in Group quarters - Long-term care (%)
People in Group quarters - Homes for abused, dependent, and neglected children (%)
People in Group quarters - Residential treatment centers for emotionally disturbed children (%)
People in Group quarters - Training schools for juvenile delinquents (%)
People in Group quarters - Short-term care, detention or diagnostic centers for delinquent children (%)
People in Group quarters - Type of juvenile institution unknown (%)
People in Group quarters - Noninstitutionalized population (%)
People in Group quarters - College dormitories (includes college quarters off campus) (%)
People in Group quarters - Military quarters (%)
People in Group quarters - On base (%)
People in Group quarters - Barracks, unaccompanied personnel housing (UPH), (Enlisted/Officer), ;and similar group living quarters for military personnel (%)
People in Group quarters - Transient quarters for temporary residents (%)
People in Group quarters - Military ships (%)
People in Group quarters - Group homes (%)
People in Group quarters - Homes or halfway houses for drug/alcohol abuse (%)
People in Group quarters - Homes for the mentally ill (%)
People in Group quarters - Homes for the mentally retarded (%)
People in Group quarters - Homes for the physically handicapped (%)
People in Group quarters - Other group homes (%)
People in Group quarters - Religious group quarters (%)
People in Group quarters - Dormitories (%)
People in Group quarters - Agriculture workers' dormitories on farms (%)
People in Group quarters - Job Corps and vocational training facilities (%)
People in Group quarters - Other workers' dormitories (%)
People in Group quarters - Crews of maritime vessels (%)
People in Group quarters - Other nonhousehold living situations (%)
People in Group quarters - Other noninstitutional group quarters (%)
Residents speaking English at home (%)
Residents speaking English at home - Born in the United States (%)
Residents speaking English at home - Native, born elsewhere (%)
Residents speaking English at home - Foreign born (%)
Residents speaking Spanish at home (%)
Residents speaking Spanish at home - Born in the United States (%)
Residents speaking Spanish at home - Native, born elsewhere (%)
Residents speaking Spanish at home - Foreign born (%)
Residents speaking other language at home (%)
Residents speaking other language at home - Born in the United States (%)
Residents speaking other language at home - Native, born elsewhere (%)
Residents speaking other language at home - Foreign born (%)
Class of Workers - Employee of private company (%)
Class of Workers - Self-employed in own incorporated business (%)
Class of Workers - Private not-for-profit wage and salary workers (%)
Class of Workers - Local government workers (%)
Class of Workers - State government workers (%)
Class of Workers - Federal government workers (%)
Class of Workers - Self-employed workers in own not incorporated business and Unpaid family workers (%)
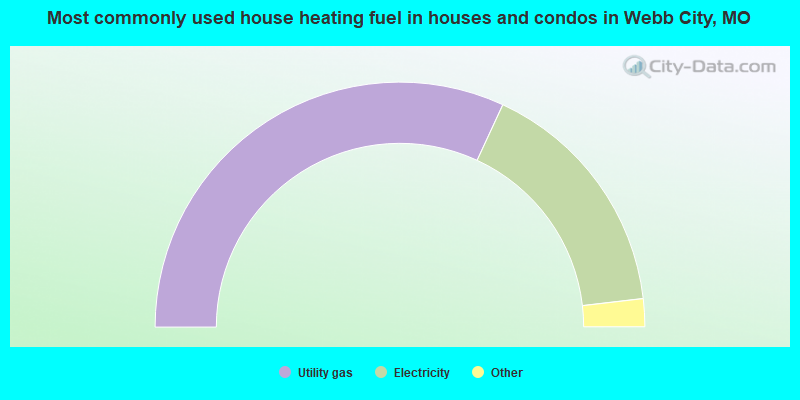
House heating fuel used in houses and condos - Utility gas (%)
House heating fuel used in houses and condos - Bottled, tank, or LP gas (%)
House heating fuel used in houses and condos - Electricity (%)
House heating fuel used in houses and condos - Fuel oil, kerosene, etc. (%)
House heating fuel used in houses and condos - Coal or coke (%)
House heating fuel used in houses and condos - Wood (%)
House heating fuel used in houses and condos - Solar energy (%)
House heating fuel used in houses and condos - Other fuel (%)
House heating fuel used in houses and condos - No fuel used (%)
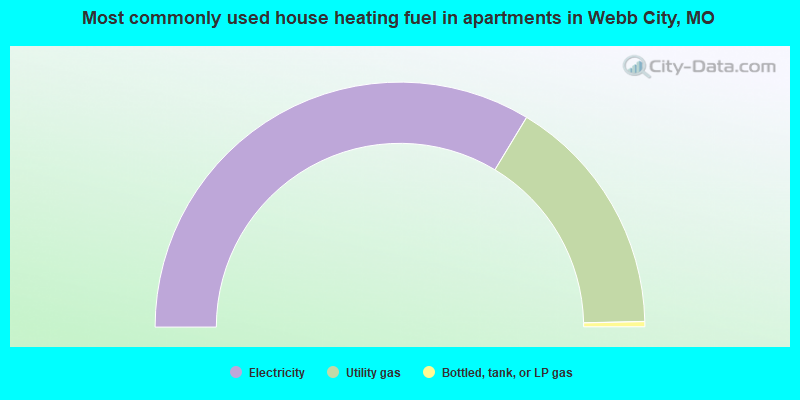
House heating fuel used in apartments - Utility gas (%)
House heating fuel used in apartments - Bottled, tank, or LP gas (%)
House heating fuel used in apartments - Electricity (%)
House heating fuel used in apartments - Fuel oil, kerosene, etc. (%)
House heating fuel used in apartments - Coal or coke (%)
House heating fuel used in apartments - Wood (%)
House heating fuel used in apartments - Solar energy (%)
House heating fuel used in apartments - Other fuel (%)
House heating fuel used in apartments - No fuel used (%)
Armed forces status - In Armed Forces (%)
Armed forces status - Civilian (%)
Armed forces status - Civilian - Veteran (%)
Armed forces status - Civilian - Nonveteran (%)
Fatal accidents locations in years 2005-2021
Fatal accidents locations in 2005
Fatal accidents locations in 2006
Fatal accidents locations in 2007
Fatal accidents locations in 2008
Fatal accidents locations in 2009
Fatal accidents locations in 2010
Fatal accidents locations in 2011
Fatal accidents locations in 2012
Fatal accidents locations in 2013
Fatal accidents locations in 2014
Fatal accidents locations in 2015
Fatal accidents locations in 2016
Fatal accidents locations in 2017
Fatal accidents locations in 2018
Fatal accidents locations in 2019
Fatal accidents locations in 2020
Fatal accidents locations in 2021
Alcohol use - People drinking some alcohol every month (%)
Alcohol use - People not drinking at all (%)
Alcohol use - Average days/month drinking alcohol
Alcohol use - Average drinks/week
Alcohol use - Average days/year people drink much
Audiometry - Average condition of hearing (%)
Audiometry - People that can hear a whisper from across a quiet room (%)
Audiometry - People that can hear normal voice from across a quiet room (%)
Audiometry - Ears ringing, roaring, buzzing (%)
Audiometry - Had a job exposure to loud noise (%)
Audiometry - Had off-work exposure to loud noise (%)
Blood Pressure & Cholesterol - Has high blood pressure (%)
Blood Pressure & Cholesterol - Checking blood pressure at home (%)
Blood Pressure & Cholesterol - Frequently checking blood cholesterol (%)
Blood Pressure & Cholesterol - Has high cholesterol level (%)
Consumer Behavior - Money monthly spent on food at supermarket/grocery store
Consumer Behavior - Money monthly spent on food at other stores
Consumer Behavior - Money monthly spent on eating out
Consumer Behavior - Money monthly spent on carryout/delivered foods
Consumer Behavior - Income spent on food at supermarket/grocery store (%)
Consumer Behavior - Income spent on food at other stores (%)
Consumer Behavior - Income spent on eating out (%)
Consumer Behavior - Income spent on carryout/delivered foods (%)
Current Health Status - General health condition (%)
Current Health Status - Blood donors (%)
Current Health Status - Has blood ever tested for HIV virus (%)
Current Health Status - Left-handed people (%)
Dermatology - People using sunscreen (%)
Diabetes - Diabetics (%)
Diabetes - Had a blood test for high blood sugar (%)
Diabetes - People taking insulin (%)
Diet Behavior & Nutrition - Diet health (%)
Diet Behavior & Nutrition - Milk product consumption (# of products/month)
Diet Behavior & Nutrition - Meals not home prepared (#/week)
Diet Behavior & Nutrition - Meals from fast food or pizza place (#/week)
Diet Behavior & Nutrition - Ready-to-eat foods (#/month)
Diet Behavior & Nutrition - Frozen meals/pizza (#/month)
Drug Use - People that ever used marijuana or hashish (%)
Drug Use - Ever used hard drugs (%)
Drug Use - Ever used any form of cocaine (%)
Drug Use - Ever used heroin (%)
Drug Use - Ever used methamphetamine (%)
Health Insurance - People covered by health insurance (%)
Kidney Conditions-Urology - Avg. # of times urinating at night
Medical Conditions - People with asthma (%)
Medical Conditions - People with anemia (%)
Medical Conditions - People with psoriasis (%)
Medical Conditions - People with overweight (%)
Medical Conditions - Elderly people having difficulties in thinking or remembering (%)
Medical Conditions - People who ever received blood transfusion (%)
Medical Conditions - People having trouble seeing even with glass/contacts (%)
Medical Conditions - People with arthritis (%)
Medical Conditions - People with gout (%)
Medical Conditions - People with congestive heart failure (%)
Medical Conditions - People with coronary heart disease (%)
Medical Conditions - People with angina pectoris (%)
Medical Conditions - People who ever had heart attack (%)
Medical Conditions - People who ever had stroke (%)
Medical Conditions - People with emphysema (%)
Medical Conditions - People with thyroid problem (%)
Medical Conditions - People with chronic bronchitis (%)
Medical Conditions - People with any liver condition (%)
Medical Conditions - People who ever had cancer or malignancy (%)
Mental Health - People who have little interest in doing things (%)
Mental Health - People feeling down, depressed, or hopeless (%)
Mental Health - People who have trouble sleeping or sleeping too much (%)
Mental Health - People feeling tired or having little energy (%)
Mental Health - People with poor appetite or overeating (%)
Mental Health - People feeling bad about themself (%)
Mental Health - People who have trouble concentrating on things (%)
Mental Health - People moving or speaking slowly or too fast (%)
Mental Health - People having thoughts they would be better off dead (%)
Oral Health - Average years since last visit a dentist
Oral Health - People embarrassed because of mouth (%)
Oral Health - People with gum disease (%)
Oral Health - General health of teeth and gums (%)
Oral Health - Average days a week using dental floss/device
Oral Health - Average days a week using mouthwash for dental problem
Oral Health - Average number of teeth
Pesticide Use - Households using pesticides to control insects (%)
Pesticide Use - Households using pesticides to kill weeds (%)
Physical Activity - People doing vigorous-intensity work activities (%)
Physical Activity - People doing moderate-intensity work activities (%)
Physical Activity - People walking or bicycling (%)
Physical Activity - People doing vigorous-intensity recreational activities (%)
Physical Activity - People doing moderate-intensity recreational activities (%)
Physical Activity - Average hours a day doing sedentary activities
Physical Activity - Average hours a day watching TV or videos
Physical Activity - Average hours a day using computer
Physical Functioning - People having limitations keeping them from working (%)
Physical Functioning - People limited in amount of work they can do (%)
Physical Functioning - People that need special equipment to walk (%)
Physical Functioning - People experiencing confusion/memory problems (%)
Physical Functioning - People requiring special healthcare equipment (%)
Prescription Medications - Average number of prescription medicines taking
Preventive Aspirin Use - Adults 40+ taking low-dose aspirin (%)
Reproductive Health - Vaginal deliveries (%)
Reproductive Health - Cesarean deliveries (%)
Reproductive Health - Deliveries resulted in a live birth (%)
Reproductive Health - Pregnancies resulted in a delivery (%)
Reproductive Health - Women breastfeeding newborns (%)
Reproductive Health - Women that had a hysterectomy (%)
Reproductive Health - Women that had both ovaries removed (%)
Reproductive Health - Women that have ever taken birth control pills (%)
Reproductive Health - Women taking birth control pills (%)
Reproductive Health - Women that have ever used Depo-Provera or injectables (%)
Reproductive Health - Women that have ever used female hormones (%)
Sexual Behavior - People 18+ that ever had sex (vaginal, anal, or oral) (%)
Sexual Behavior - Males 18+ that ever had vaginal sex with a woman (%)
Sexual Behavior - Males 18+ that ever performed oral sex on a woman (%)
Sexual Behavior - Males 18+ that ever had anal sex with a woman (%)
Sexual Behavior - Males 18+ that ever had any sex with a man (%)
Sexual Behavior - Females 18+ that ever had vaginal sex with a man (%)
Sexual Behavior - Females 18+ that ever performed oral sex on a man (%)
Sexual Behavior - Females 18+ that ever had anal sex with a man (%)
Sexual Behavior - Females 18+ that ever had any kind of sex with a woman (%)
Sexual Behavior - Average age people first had sex
Sexual Behavior - Average number of female sex partners in lifetime (males 18+)
Sexual Behavior - Average number of female vaginal sex partners in lifetime (males 18+)
Sexual Behavior - Average age people first performed oral sex on a woman (18+)
Sexual Behavior - Average number of woman performed oral sex on in lifetime (18+)
Sexual Behavior - Average number of male sex partners in lifetime (males 18+)
Sexual Behavior - Average number of male anal sex partners in lifetime (males 18+)
Sexual Behavior - Average age people first performed oral sex on a man (18+)
Sexual Behavior - Average number of male oral sex partners in lifetime (18+)
Sexual Behavior - People using protection when performing oral sex (%)
Sexual Behavior - Average number of times people have vaginal or anal sex a year
Sexual Behavior - People having sex without condom (%)
Sexual Behavior - Average number of male sex partners in lifetime (females 18+)
Sexual Behavior - Average number of male vaginal sex partners in lifetime (females 18+)
Sexual Behavior - Average number of female sex partners in lifetime (females 18+)
Sexual Behavior - Circumcised males 18+ (%)
Sleep Disorders - Average hours sleeping at night
Sleep Disorders - People that has trouble sleeping (%)
Smoking-Cigarette Use - People smoking cigarettes (%)
Taste & Smell - People 40+ having problems with smell (%)
Taste & Smell - People 40+ having problems with taste (%)
Taste & Smell - People 40+ that ever had wisdom teeth removed (%)
Taste & Smell - People 40+ that ever had tonsils teeth removed (%)
Taste & Smell - People 40+ that ever had a loss of consciousness because of a head injury (%)
Taste & Smell - People 40+ that ever had a broken nose or other serious injury to face or skull (%)
Taste & Smell - People 40+ that ever had two or more sinus infections (%)
Weight - Average height (inches)
Weight - Average weight (pounds)
Weight - Average BMI
Weight - People that are obese (%)
Weight - People that ever were obese (%)
Weight - People trying to lose weight (%)
According to our research of Missouri and other state lists, there were 16 registered sex offenders living in Webb City, Missouri as of June 16, 2024 . The ratio of all residents to sex offenders in Webb City is 695 to 1.The ratio of registered sex offenders to all residents in this city is lower than the state average.
Officers per 1,000 residents here:
1.60Missouri average:
2.54
Latest news from Webb City, MO collected exclusively by city-data.com from local newspapers, TV, and radio stations
Ancestries: American (27.7%), German (16.7%), English (14.8%), European (6.5%), Irish (2.7%), Scotch-Irish (2.1%).
Current Local Time:
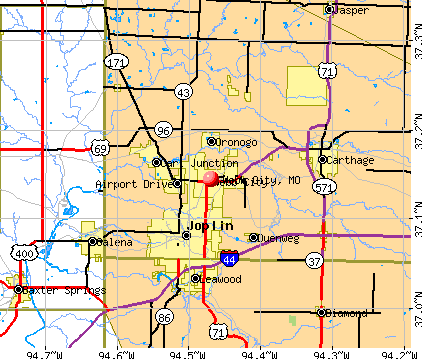
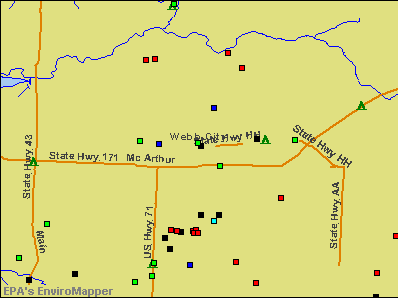
Land area: 7.44 square miles.
Population density: 1,768 people per square mile (low).
122 residents are foreign born
This city:
0.9%Missouri:
4.2%
Median real estate property taxes paid for housing units with mortgages in 2022: $1,072 (0.7%)Median real estate property taxes paid for housing units with no mortgage in 2022: $936 (0.5%)
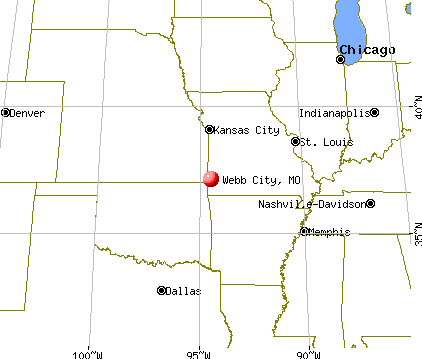
Nearest city with pop. 50,000+: Springfield, MO
Nearest city with pop. 200,000+: Tulsa, OK
Nearest city with pop. 1,000,000+: Dallas, TX
Nearest cities:
Brooklyn Heights, MO (2.2 miles),
Latitude: 37.14 N, Longitude: 94.47 W
Daytime population change due to commuting: -1,599 (-12.2%)Workers who live and work in this city: 1,625 (27.0%)
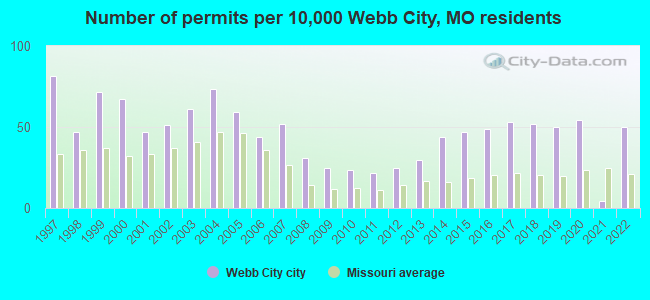
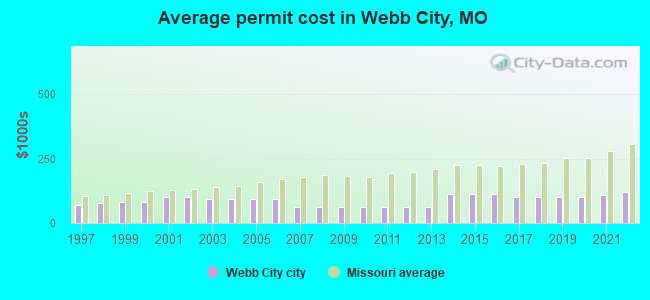
Single-family new house construction building permits:
2022: 49 buildings , average cost: $121,5002021: 4 buildings , average cost: $108,8002020: 53 buildings , average cost: $98,6002019: 49 buildings , average cost: $98,6002018: 51 buildings , average cost: $98,6002017: 52 buildings , average cost: $98,6002016: 48 buildings , average cost: $112,3002015: 46 buildings , average cost: $112,3002014: 43 buildings , average cost: $112,3002013: 29 buildings , average cost: $61,2002012: 24 buildings , average cost: $61,2002011: 21 buildings , average cost: $61,2002010: 23 buildings , average cost: $61,2002009: 24 buildings , average cost: $61,2002008: 30 buildings , average cost: $61,2002007: 51 buildings , average cost: $61,2002006: 43 buildings , average cost: $91,6002005: 58 buildings , average cost: $91,6002004: 72 buildings , average cost: $93,1002003: 60 buildings , average cost: $93,0002002: 50 buildings , average cost: $102,1002001: 46 buildings , average cost: $102,1002000: 66 buildings , average cost: $81,2001999: 70 buildings , average cost: $82,0001998: 46 buildings , average cost: $78,3001997: 80 buildings , average cost: $69,300Unemployment in December 2023:
Population change in the 1990s: +2,212 (+29.1%).
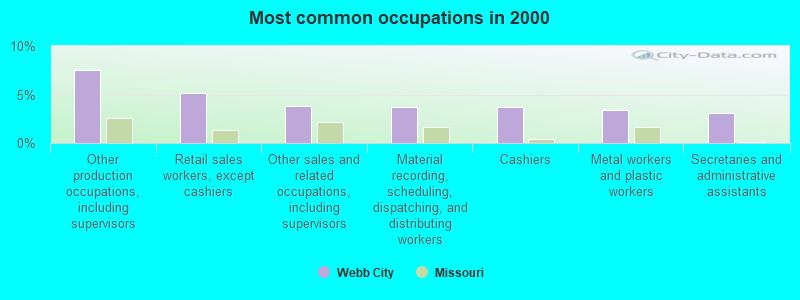
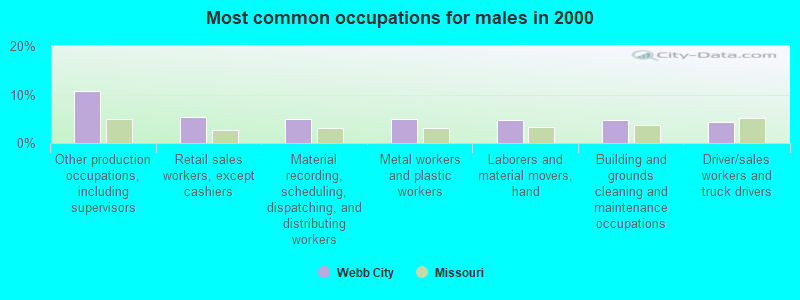
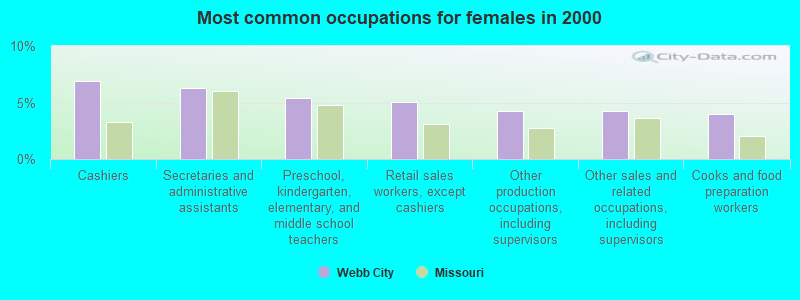
Most common occupations in Webb City, MO (%)
Both Males Females
Other production occupations, including supervisors (7.6%)
Retail sales workers, except cashiers (5.2%)
Other sales and related occupations, including supervisors (3.8%)
Material recording, scheduling, dispatching, and distributing workers (3.7%)
Cashiers (3.7%)
Metal workers and plastic workers (3.4%)
Secretaries and administrative assistants (3.1%)
Other production occupations, including supervisors (10.7%)
Retail sales workers, except cashiers (5.3%)
Material recording, scheduling, dispatching, and distributing workers (5.0%)
Metal workers and plastic workers (5.0%)
Laborers and material movers, hand (4.8%)
Building and grounds cleaning and maintenance occupations (4.7%)
Driver/sales workers and truck drivers (4.4%)
Cashiers (6.9%)
Secretaries and administrative assistants (6.3%)
Preschool, kindergarten, elementary, and middle school teachers (5.4%)
Retail sales workers, except cashiers (5.0%)
Other production occupations, including supervisors (4.2%)
Other sales and related occupations, including supervisors (4.2%)
Cooks and food preparation workers (4.0%)
Tornado activity:
Webb City-area historical tornado activity is slightly above Missouri state average. It is 96% greater than the overall U.S. average.
On 4/3/1956, a category F4 (max. wind speeds 207-260 mph) tornado 2.7 miles away from the Webb City city center injured 59 people and caused between $500,000 and $5,000,000 in damages.
On 5/10/2008, a category F4 tornado 17.0 miles away from the city center killed 15 people and injured 200 people and caused $45 million in damages.
Earthquake activity:
Webb City-area historical earthquake activity is significantly above Missouri state average. It is 644% greater than the overall U.S. average. On 9/3/2016 at 12:02:44, a magnitude 5.8 (5.8 MW, Depth: 3.5 mi, Class: Moderate, Intensity: VI - VII) earthquake occurred 145.1 miles away from the city center On 11/6/2011 at 03:53:10, a magnitude 5.7 (5.7 MW, Depth: 3.2 mi) earthquake occurred 169.7 miles away from Webb City center On 11/7/2016 at 01:44:24, a magnitude 5.0 (5.0 MW, Depth: 2.8 mi) earthquake occurred 152.2 miles away from Webb City center On 11/12/2014 at 21:40:00, a magnitude 4.9 (4.9 MW, Depth: 2.5 mi, Class: Light, Intensity: IV - V) earthquake occurred 173.8 miles away from Webb City center On 11/5/2011 at 07:12:45, a magnitude 4.8 (4.8 MW, Depth: 1.9 mi) earthquake occurred 168.8 miles away from Webb City center On 11/8/2011 at 02:46:57, a magnitude 4.8 (4.8 MW, Depth: 3.1 mi) earthquake occurred 170.7 miles away from the city center Magnitude types: moment magnitude (MW) Natural disasters: The number of natural disasters in Jasper County (21) is greater than the US average (15).Major Disasters (Presidential) Declared: 13Emergencies Declared: 5Floods: 13, Storms: 13, Tornadoes: 11, Winter Storms: 5, Winds: 3, Heavy Rain: 1, Hurricane: 1, Other: 1 (Note: some incidents may be assigned to more than one category). Hospitals and medical centers in Webb City: CHINN JANE MEM HOSP (provides emergency services, ROSE + AUSTIN STS) REGENCY CARE CENTER OF WEBB CITY (RT #1 BOX 100C)
WEBB CITY HEALTH AND REHABILITATION CENTER (2077 STADIUM DRIVE)
College/University in Webb City: City Pointe Beauty Academy Full-time enrollment: 56; Location: 501 South Madison Street; Private, for-profit; Website: www.citypointebeauty.com)
Colleges/universities with over 2000 students nearest to Webb City:
Missouri Southern State University (about 4 miles; Joplin, MO ; Full-time enrollment: 4,456)
Pittsburg State University (about 22 miles; Pittsburg, KS ; FT enrollment: 6,838)
Crowder College (about 24 miles; Neosho, MO ; FT enrollment: 3,675)
Northeastern Oklahoma A&M College (about 29 miles; Miami, OK ; FT enrollment: 2,075)
NorthWest Arkansas Community College (about 57 miles; Bentonville, AR ; FT enrollment: 5,634)
Drury University (about 66 miles; Springfield, MO ; FT enrollment: 3,902)
Ozarks Technical Community College (about 66 miles; Springfield, MO ; FT enrollment: 10,356)
Public high school in Webb City: WEBB CITY HIGH Students: 1,116, Location: 621 N MADISON, Grades: 9-12)Public elementary/middle schools in Webb City: WEBB CITY JR. HIGH Students: 601, Location: 807 W FIRST ST, Grades: 7-8)WEBB CITY MIDDLE Students: 600, Location: 603 W AYLOR, Grades: 5-6)HARRY S. TRUMAN ELEM. Students: 425, Location: 810 N HWY D, Grades: 2-4)WEBSTER PRIMARY CTR. Students: 362, Location: 700 N MAIN, Grades: 1-2)MARK TWAIN ELEM. Students: 195, Location: 1427 W AYLOR, Grades: 3-4)EUGENE FIELD ELEM. Students: 186, Location: 510 S ORONOGO, Grades: 3-4)BESS TRUMAN PRIMARY CTR. Location: 800 N HWY D, Grades: PK-1)See full list of schools located in Webb City Library in Webb City: WEBB CITY PUBLIC LIBRARY Operating income: $295,393; Location: 101 SOUTH LIBERTY STREET; 42,082 books ; 1,263 audio materials ; 516 video materials ; 14 state licensed databases ; 57 print serial subscriptions ; 11 electronic serial subscriptions )
Birthplace of: Andrew Shull - Football player, Grant Wistrom - 2005 NFL player (Seattle Seahawks, born : Jul 3, 1976), Michael Roberson - Politician.
Jasper County has a predicted average indoor radon screening level between 2 and 4 pCi/L (pico curies per liter) - Moderate Potential Average household size: This city:
2.6 peopleMissouri:
2.5 people
Percentage of family households: This city:
67.1%Whole state:
65.3%
Percentage of households with unmarried partners: This city:
7.5%Whole state:
6.7%
Likely homosexual households (counted as self-reported same-sex unmarried-partner households)
Lesbian couples: 0.4% of all households Gay men: 0.1% of all households
People in group quarters in Webb City in 2010:
94 people in nursing facilities/skilled-nursing facilities
21 people in college/university student housing
4 people in workers' group living quarters and job corps centers
people in nursing homes in 2000people in other noninstitutional group quarters in 2000Banks with branches in Webb City (2011 data):
Mid-Missouri Bank: Webb City Facility, Motor Branch, Webb City Bank Branch. Info updated 2011/07/27: Bank assets: $509.3 mil, Deposits: $452.7 mil, headquarters in Springfield, MO, positive income , Commercial Lending Specialization, 15 total offices , Holding Company: Mid-Missouri Bancshares, Inc.
U.S. Bank National Association: Madison Street Branch at 1723 South Madison Street, branch established on 1934/08/01; Webb City Branch at 121 West Broadway, branch established on 1905/03/10. Info updated 2012/01/30: Bank assets: $330,470.8 mil, Deposits: $236,091.5 mil, headquarters in Cincinnati, OH, positive income , 3121 total offices , Holding Company: U.S. Bancorp
First State Bank of Joplin: Webb City Branch at 1010 S Madison Ste M, branch established on 1997/06/20. Info updated 2006/11/22: Bank assets: $185.8 mil, Deposits: $160.5 mil, headquarters in Joplin, MO, positive income , Commercial Lending Specialization, 6 total offices , Holding Company: Buerge Bancshares, Inc.
Commerce Bank: Webb City Branch at 1311 S Madison St, branch established on 2000/11/06. Info updated 2011/07/07: Bank assets: $20,493.6 mil, Deposits: $16,805.3 mil, headquarters in Kansas City, MO, positive income , 206 total offices , Holding Company: Commerce Bancshares, Inc.
Arvest Bank: Webb City Branch at 1515 W. Macarthur, branch established on 1999/11/15. Info updated 2010/11/29: Bank assets: $12,520.8 mil, Deposits: $10,446.2 mil, headquarters in Fayetteville, AR, positive income , Commercial Lending Specialization, 241 total offices , Holding Company: Arvest Bank Group, Inc.
For population 15 years and over in Webb City:
Never married: 27.6%Now married: 47.9%Separated: 1.9%Widowed: 5.6%Divorced: 17.0% For population 25 years and over in Webb City:
High school or higher: 90.8%Bachelor's degree or higher: 26.9%Graduate or professional degree: 9.1%Unemployed: 6.4%Mean travel time to work (commute): 15.7 minutes
Education Gini index (Inequality in education) Here:
9.9Missouri average:
11.1
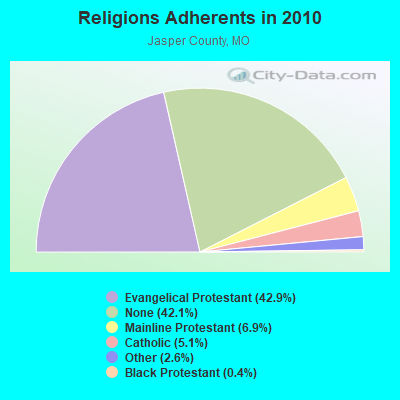
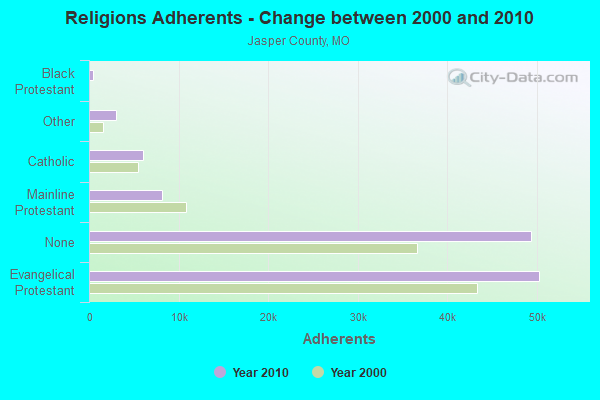
Religion statistics for Webb City, MO (based on Jasper County data)
Religion Adherents Congregations Evangelical Protestant 50,313 149 Mainline Protestant 8,100 35 Catholic 6,024 5 Other 3,052 18 Black Protestant 502 2 None 49,413 -
Source: Clifford Grammich, Kirk Hadaway, Richard Houseal, Dale E.Jones, Alexei Krindatch, Richie Stanley and Richard H.Taylor. 2012. 2010 U.S.Religion Census: Religious Congregations & Membership Study. Association of Statisticians of American Religious Bodies. Jones, Dale E., et al. 2002. Congregations and Membership in the United States 2000. Nashville, TN: Glenmary Research Center. Graphs represent county-level data
Food Environment Statistics: Number of grocery stores : 9Jasper County :
0.78 / 10,000 pop.Missouri :
1.88 / 10,000 pop.
Number of supercenters and club stores : 5This county :
0.43 / 10,000 pop.Missouri :
0.18 / 10,000 pop.
Number of convenience stores (no gas) : 2This county :
0.17 / 10,000 pop.State :
0.60 / 10,000 pop.
Number of convenience stores (with gas) : 64Here :
5.56 / 10,000 pop.Missouri :
4.34 / 10,000 pop.
Number of full-service restaurants : 88Jasper County :
7.65 / 10,000 pop.Missouri :
7.37 / 10,000 pop.
Adult diabetes rate : Jasper County :
8.5%State :
8.8%
Adult obesity rate : Jasper County :
30.7%Missouri :
29.6%
Low-income preschool obesity rate : Health and Nutrition: Healthy diet rate : Webb City:
47.6%Missouri:
50.9%
Average overall health of teeth and gums : Webb City:
42.7%Missouri:
48.6%
Average BMI : Webb City:
29.1Missouri:
28.7
People feeling badly about themselves : This city:
21.2%State:
20.6%
People not drinking alcohol at all : Webb City:
13.2%Missouri:
10.1%
Average hours sleeping at night : Webb City:
6.8Missouri:
6.8
Overweight people : This city:
33.7%State:
34.3%
General health condition : Webb City:
54.5%Missouri:
57.5%
Average condition of hearing : More about Health and Nutrition of Webb City, MO Residents
Local government employment and payroll (March 2022)
Function
Full-time employees
Monthly full-time payroll
Average yearly full-time wage
Part-time employees
Monthly part-time payroll
Police Protection - Officers
20 $88,323 $52,994 1 $199 Firefighters
19 $80,281 $50,704 0 $0 Other Government Administration
13 $25,127 $23,194 0 $0 Sewerage
12 $51,965 $51,965 0 $0 Streets and Highways
10 $36,899 $44,279 0 $0 Financial Administration
8 $31,217 $46,826 0 $0 Parks and Recreation
7 $23,139 $39,667 1 $277 Water Supply
6 $19,317 $38,634 0 $0 Police - Other
4 $12,677 $38,031 2 $2,484 Other and Unallocable
2 $7,234 $43,404 1 $1,233 Judicial and Legal
2 $6,025 $36,150 0 $0 Natural Resources
1 $5,137 $61,644 0 $0 Housing and Community Development (Local)
1 $4,898 $58,776 0 $0
Totals for Government
105 $392,240 $44,827 5 $4,194
Webb City government finances - Expenditure in 2017 (per resident):
Construction - Regular Highways: $313,000 ($23.78)
Current Operations - Police Protection: $1,749,000 ($132.85)
Local Fire Protection: $1,719,000 ($130.57)Water Utilities: $1,629,000 ($123.74)Sewerage: $1,505,000 ($114.32)Regular Highways: $1,347,000 ($102.32)Parks and Recreation: $615,000 ($46.71)Solid Waste Management: $471,000 ($35.78)Financial Administration: $361,000 ($27.42)Judicial and Legal Services: $161,000 ($12.23)Central Staff Services: $149,000 ($11.32)Protective Inspection and Regulation - Other: $106,000 ($8.05)General Public Buildings: $30,000 ($2.28)Miscellaneous Commercial Activities - Other: $14,000 ($1.06)General - Interest on Debt: $251,000 ($19.07)
Other Capital Outlay - Local Fire Protection: $194,000 ($14.74)
Sewerage: $181,000 ($13.75)Police Protection: $109,000 ($8.28)Parks and Recreation: $96,000 ($7.29)Regular Highways: $62,000 ($4.71)Libraries: $55,000 ($4.18)Financial Administration: $19,000 ($1.44)Water Utilities: $18,000 ($1.37)Judicial and Legal Services: $6,000 ($0.46)
Webb City government finances - Revenue in 2017 (per resident):
Charges - Sewerage: $1,919,000 ($145.77)
Solid Waste Management: $460,000 ($34.94)Parks and Recreation: $117,000 ($8.89)Other: $10,000 ($0.76)Miscellaneous Commercial Activities: $4,000 ($0.30)Federal Intergovernmental - Highways: $300,000 ($22.79)
Other: $194,000 ($14.74)Natural Resources: $145,000 ($11.01)Water Utilities: $54,000 ($4.10)Housing and Community Development: $28,000 ($2.13)Local Intergovernmental - Other: $727,000 ($55.22)
General Local Government Support: $67,000 ($5.09)Highways: $54,000 ($4.10)Miscellaneous - Fines and Forfeits: $240,000 ($18.23)
Donations From Private Sources: $89,000 ($6.76)General Revenue - Other: $51,000 ($3.87)Rents: $17,000 ($1.29)Sale of Property: $12,000 ($0.91)Special Assessments: $9,000 ($0.68)Revenue - Water Utilities: $1,771,000 ($134.52)
State Intergovernmental - Highways: $293,000 ($22.26)
Other: $11,000 ($0.84)Tax - General Sales and Gross Receipts: $4,159,000 ($315.91)
Public Utilities Sales: $822,000 ($62.44)Property: $490,000 ($37.22)Occupation and Business License - Other: $144,000 ($10.94)Motor Vehicle License: $142,000 ($10.79)Tobacco Products Sales: $47,000 ($3.57)
Webb City government finances - Debt in 2017 (per resident):
Long Term Debt - Beginning Outstanding - Unspecified Public Purpose: $6,280,000 ($477.02)
Outstanding Unspecified Public Purpose: $5,919,000 ($449.60)Retired Unspecified Public Purpose: $361,000 ($27.42)
Webb City government finances - Cash and Securities in 2017 (per resident):
Other Funds - Cash and Securities: $770,000 ($58.49)
Sinking Funds - Cash and Securities: $7,695,000 ($584.50)
Businesses in Webb City, MO
Name Count Name Count
AT&T 1 Quiznos 1 Ace Hardware 1 SONIC Drive-In 2 Arby's 1 Subway 3 AutoZone 1 T-Mobile 1 Burger King 1 Taco Bell 1 Curves 1 U-Haul 1 H&R Block 1 UPS 1 KFC 1 Waffle House 1 Little Caesars Pizza 1 Walgreens 1 McDonald's 1 Walmart 1 Papa John's Pizza 1 Wendy's 1 Pizza Hut 1
Strongest AM radio stations in Webb City:
KOCR (1310 AM; 5 kW; JOPLIN, MO; Owner: OZARK CHRISTIAN COLLEGE)
WMBH (1560 AM; 10 kW; JOPLIN, MO)
KKLL (1100 AM; daytime; 5 kW; WEBB CITY, MO; Owner: NEW LIFE EVANGELISTIC CENTER, INC.)
KKOW (860 AM; 10 kW; PITTSBURG, KS; Owner: AMERICAN MEDIA INVESTMENTS)
KWAS (1230 AM; 1 kW; JOPLIN, MO; Owner: NEW LIFE EVANGELISTIC CENTER, INC.)
KQYX (1450 AM; 1 kW; JOPLIN, MO; Owner: PETRACOM OF JOPLIN, L.L.C.)
KDMO (1490 AM; 1 kW; CARTHAGE, MO; Owner: CARTHAGE BROADCASTING COMPANY, INC.)
KBTN (1420 AM; 10 kW; NEOSHO, MO; Owner: PETRACOM OF JOPLIN, L.L.C.)
KGGF (690 AM; 10 kW; COFFEYVILLE, KS; Owner: KGGF-KUSN, INC.)
KFAQ (1170 AM; 50 kW; TULSA, OK; Owner: JOURNAL BROADCAST CORPORATION)
KRMG (740 AM; 50 kW; TULSA, OK; Owner: CXR HOLDINGS, INC.)
WHB (810 AM; 50 kW; KANSAS CITY, MO; Owner: UNION BROADCASTING, INC.)
KRMO (990 AM; 2 kW; CASSVILLE, MO; Owner: MONETT COMMUNICATIONS, INC.)
Strongest FM radio stations in Webb City:
KIXQ (102.5 FM; JOPLIN, MO; Owner: BIG MACK BROADCASTING, INC.)
KSYN (92.5 FM; JOPLIN, MO; Owner: BIG MACK BROADCASTING, INC.)
KXDG (97.9 FM; WEBB CITY, MO; Owner: BIG MACK BROADCASTING, INC)
KXMS (88.7 FM; JOPLIN, MO; Owner: MISSOURI SOUTHERN STATE COLLEGE)
K207BT (89.3 FM; JOPLIN, MO; Owner: CALVARY CHAPEL OF TWIN FALLS, INC.)
KJMK (93.9 FM; WEBB CITY, MO; Owner: BIG MACK BROADCASTING, INC)
KMXL (95.1 FM; CARTHAGE, MO; Owner: CARTHAGE BROADCASTING COMPANY, INC.)
KOBC (90.7 FM; JOPLIN, MO; Owner: OZARK CHRISTIAN COLLEGE)
KWXD (103.5 FM; ASBURY, MO; Owner: INNOVATIVE BROADCASTING CORPORATION)
KRPS (89.9 FM; PITTSBURG, KS; Owner: PITTSBURG STATE UNIVERSITY)
KKOW-FM (96.9 FM; PITTSBURG, KS; Owner: AMERICAN MEDIA INVESTMENTS, INC.)
K255AH (98.9 FM; JOPLIN, MO; Owner: BOARD OF GOVERNORS FOR SOUTHWEST MISSOURI STATE UNIVERSITY)
KMOQ (107.1 FM; BAXTER SPRINGS, KS; Owner: PETRACOM OF JOPLIN, L.L.C.)
KBTN-FM (99.7 FM; NEOSHO, MO; Owner: PETRACOM OF JOPLIN, L.L.C.)
KCAR-FM (104.3 FM; GALENA, KS; Owner: PETRACOM OF JOPLIN, L.L.C.)
KJML (105.3 FM; COLUMBUS, KS; Owner: PETRACOM OF JOPLIN, L.L.C.)
KNEO (91.7 FM; NEOSHO, MO; Owner: SKY HIGH BROADCASTING CORPORATION)
KHST (101.7 FM; LAMAR, MO; Owner: INNOVATIVE BROADCASTING CORPORATION)
TV broadcast stations around Webb City:
KODE-TV (Channel 12; JOPLIN, MO; Owner: MISSION BROADCASTING, INC.)
KOZJ (Channel 26; JOPLIN, MO; Owner: BD. OF GOVERNORS OF SW MISSOURI STATE UNIVERSITY)
K05KD (Channel 5; CARTHAGE, MO; Owner: WORD OF GOD FELLOWSHIP, INC.)
KJPX-LP (Channel 47; JOPLIN, MO; Owner: GARY M./DEBORAH R. KENNY)
KSNF (Channel 16; JOPLIN, MO; Owner: NEXSTAR BROADCASTING OF JOPLIN, L.L.C.)
K64FW (Channel 64; JOPLIN, MO; Owner: NEW LIFE EVANGELISTIC CENTER, INC.)
K20GA (Channel 20; JOPLIN, MO; Owner: TIGER EYE BROADCASTING CORPORATION)
KOAM-TV (Channel 7; PITTSBURG, KS; Owner: SAGA QUAD STATES COMMUNICATIONS, LLC)
KCLJ-CA (Channel 46; JOPLIN/CARTHAGE, MO; Owner: GARY M./DEBORAH R. KENNY)
K52FC (Channel 52; JOPLIN, MO; Owner: MS COMMUNICATIONS, LLC)
K55HU (Channel 55; JOPLIN, MO; Owner: MS COMMUNICATIONS, LLC)
K04OV (Channel 4; JOPLIN, MO; Owner: MS COMMUNICATIONS, LLC)
KGCS-LP (Channel 57; JOPLIN, MO; Owner: BD OF REGENTS, MO. SOUTH. ST.COLLEGE)
National Bridge Inventory (NBI) Statistics 17 Number of bridges177ft / 54.5m Total length $3,798,000 Total costs91,005 Total average daily traffic11,710 Total average daily truck traffic
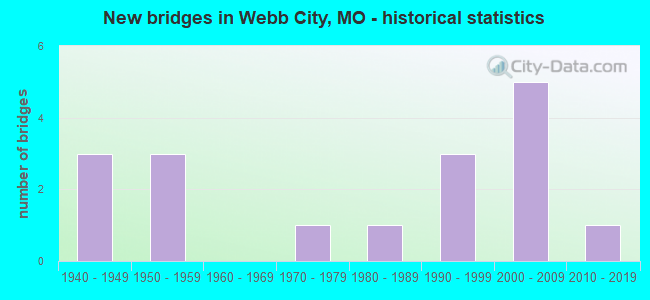
New bridges - historical statistics
3 1940-1949 3 1950-1959 1 1970-1979 1 1980-1989 3 1990-1999 5 2000-2009 1 2010-2019
See full National Bridge Inventory statistics for Webb City, MO
Home Mortgage Disclosure Act Aggregated Statistics For Year 2009(Based on 2 partial tracts) A) FHA, FSA/RHS & VA B) Conventional C) Refinancings D) Home Improvement Loans E) Loans on Dwellings For 5+ Families F) Non-occupant Loans on G) Loans On Manufactured Number Average Value Number Average Value Number Average Value Number Average Value Number Average Value Number Average Value Number Average Value
LOANS ORIGINATED 35 $97,383 28 $91,215 79 $107,490 7 $40,289 1 $1,331,130 16 $60,842 2 $6,805 APPLICATIONS APPROVED, NOT ACCEPTED 2 $94,620 1 $38,930 10 $108,940 1 $14,600 0 $0 0 $0 0 $0 APPLICATIONS DENIED 4 $92,030 4 $71,648 33 $108,830 7 $16,491 0 $0 2 $50,640 2 $34,305 APPLICATIONS WITHDRAWN 6 $106,128 3 $80,967 24 $107,545 0 $0 0 $0 0 $0 0 $0 FILES CLOSED FOR INCOMPLETENESS 1 $125,260 0 $0 1 $142,850 0 $0 0 $0 0 $0 0 $0
Aggregated Statistics For Year 2008(Based on 2 partial tracts) A) FHA, FSA/RHS & VA B) Conventional C) Refinancings D) Home Improvement Loans F) Non-occupant Loans on G) Loans On Manufactured Number Average Value Number Average Value Number Average Value Number Average Value Number Average Value Number Average Value
LOANS ORIGINATED 25 $97,397 43 $102,205 50 $95,925 11 $27,649 21 $68,804 3 $31,760 APPLICATIONS APPROVED, NOT ACCEPTED 2 $110,555 3 $122,233 4 $88,885 2 $38,055 0 $0 1 $30,510 APPLICATIONS DENIED 8 $121,428 10 $89,700 39 $108,395 15 $51,382 4 $45,590 2 $67,120 APPLICATIONS WITHDRAWN 3 $137,867 7 $58,469 18 $105,112 3 $57,413 3 $61,727 0 $0 FILES CLOSED FOR INCOMPLETENESS 1 $143,440 1 $114,600 3 $120,127 0 $0 1 $86,740 0 $0
Aggregated Statistics For Year 2007(Based on 2 partial tracts) A) FHA, FSA/RHS & VA B) Conventional C) Refinancings D) Home Improvement Loans F) Non-occupant Loans on G) Loans On Manufactured Number Average Value Number Average Value Number Average Value Number Average Value Number Average Value Number Average Value
LOANS ORIGINATED 11 $98,479 98 $92,347 65 $97,639 20 $25,881 31 $88,414 2 $41,100 APPLICATIONS APPROVED, NOT ACCEPTED 0 $0 7 $99,556 10 $103,883 4 $20,435 2 $50,345 1 $34,510 APPLICATIONS DENIED 2 $99,655 15 $71,053 46 $90,887 16 $27,693 3 $47,147 4 $48,765 APPLICATIONS WITHDRAWN 1 $80,360 6 $98,362 20 $100,788 3 $39,767 2 $125,085 0 $0 FILES CLOSED FOR INCOMPLETENESS 0 $0 2 $84,430 8 $101,972 1 $72,710 0 $0 0 $0
Aggregated Statistics For Year 2006(Based on 2 partial tracts) A) FHA, FSA/RHS & VA B) Conventional C) Refinancings D) Home Improvement Loans E) Loans on Dwellings For 5+ Families F) Non-occupant Loans on G) Loans On Manufactured Number Average Value Number Average Value Number Average Value Number Average Value Number Average Value Number Average Value Number Average Value
LOANS ORIGINATED 15 $100,183 116 $78,338 68 $89,209 13 $28,730 2 $559,915 27 $61,683 6 $26,425 APPLICATIONS APPROVED, NOT ACCEPTED 0 $0 10 $65,494 18 $88,927 1 $28,360 0 $0 3 $64,740 1 $33,080 APPLICATIONS DENIED 2 $100,335 25 $75,443 60 $88,335 16 $44,382 0 $0 6 $87,152 5 $35,582 APPLICATIONS WITHDRAWN 0 $0 16 $84,070 37 $92,308 5 $73,918 0 $0 2 $78,285 0 $0 FILES CLOSED FOR INCOMPLETENESS 1 $39,530 2 $101,835 8 $145,828 1 $117,710 0 $0 1 $86,740 0 $0
Aggregated Statistics For Year 2005(Based on 2 partial tracts) A) FHA, FSA/RHS & VA B) Conventional C) Refinancings D) Home Improvement Loans E) Loans on Dwellings For 5+ Families F) Non-occupant Loans on G) Loans On Manufactured Number Average Value Number Average Value Number Average Value Number Average Value Number Average Value Number Average Value Number Average Value
LOANS ORIGINATED 12 $89,893 119 $81,421 93 $85,406 13 $27,852 3 $144,770 30 $72,344 3 $42,347 APPLICATIONS APPROVED, NOT ACCEPTED 0 $0 6 $76,170 13 $94,555 3 $16,993 0 $0 1 $125,260 1 $52,630 APPLICATIONS DENIED 2 $121,135 22 $76,968 63 $86,032 19 $26,533 0 $0 3 $123,373 6 $36,855 APPLICATIONS WITHDRAWN 2 $81,415 19 $83,967 49 $96,734 4 $103,168 0 $0 3 $98,730 0 $0 FILES CLOSED FOR INCOMPLETENESS 0 $0 3 $93,960 4 $92,298 1 $34,200 0 $0 0 $0 0 $0
Aggregated Statistics For Year 2004(Based on 2 partial tracts) A) FHA, FSA/RHS & VA B) Conventional C) Refinancings D) Home Improvement Loans E) Loans on Dwellings For 5+ Families F) Non-occupant Loans on G) Loans On Manufactured Number Average Value Number Average Value Number Average Value Number Average Value Number Average Value Number Average Value Number Average Value
LOANS ORIGINATED 13 $87,872 97 $85,961 106 $82,591 25 $23,226 1 $882,720 30 $84,964 4 $33,245 APPLICATIONS APPROVED, NOT ACCEPTED 0 $0 4 $135,138 16 $84,987 2 $34,370 0 $0 0 $0 0 $0 APPLICATIONS DENIED 3 $73,170 23 $76,314 62 $78,803 12 $26,192 0 $0 4 $46,998 5 $38,198 APPLICATIONS WITHDRAWN 2 $86,775 8 $83,921 40 $90,589 4 $44,062 0 $0 1 $134,460 0 $0 FILES CLOSED FOR INCOMPLETENESS 0 $0 0 $0 9 $92,094 2 $19,625 0 $0 0 $0 0 $0
Aggregated Statistics For Year 2003(Based on 2 partial tracts) A) FHA, FSA/RHS & VA B) Conventional C) Refinancings D) Home Improvement Loans F) Non-occupant Loans on Number Average Value Number Average Value Number Average Value Number Average Value Number Average Value
LOANS ORIGINATED 14 $79,599 68 $77,583 191 $80,633 15 $26,047 28 $76,421 APPLICATIONS APPROVED, NOT ACCEPTED 0 $0 5 $71,126 16 $72,663 1 $69,650 1 $33,320 APPLICATIONS DENIED 3 $59,587 15 $49,595 57 $74,051 11 $15,887 4 $45,560 APPLICATIONS WITHDRAWN 1 $140,810 9 $61,853 44 $86,195 2 $11,995 2 $82,850 FILES CLOSED FOR INCOMPLETENESS 0 $0 2 $60,640 9 $88,668 0 $0 1 $28,430
Aggregated Statistics For Year 2002(Based on 2 partial tracts) A) FHA, FSA/RHS & VA B) Conventional C) Refinancings D) Home Improvement Loans F) Non-occupant Loans on Number Average Value Number Average Value Number Average Value Number Average Value Number Average Value
LOANS ORIGINATED 21 $81,047 75 $74,216 132 $76,133 15 $27,511 26 $49,864 APPLICATIONS APPROVED, NOT ACCEPTED 1 $129,260 4 $52,095 18 $69,885 1 $34,140 2 $23,070 APPLICATIONS DENIED 2 $85,150 16 $56,022 48 $69,515 7 $15,420 9 $90,847 APPLICATIONS WITHDRAWN 0 $0 7 $62,460 34 $74,033 2 $37,680 3 $44,200 FILES CLOSED FOR INCOMPLETENESS 1 $123,930 2 $32,650 5 $108,340 0 $0 0 $0
Aggregated Statistics For Year 2001(Based on 2 partial tracts) A) FHA, FSA/RHS & VA B) Conventional C) Refinancings D) Home Improvement Loans F) Non-occupant Loans on Number Average Value Number Average Value Number Average Value Number Average Value Number Average Value
LOANS ORIGINATED 21 $75,798 66 $68,572 124 $74,219 21 $14,478 20 $74,760 APPLICATIONS APPROVED, NOT ACCEPTED 0 $0 6 $65,778 8 $63,526 0 $0 0 $0 APPLICATIONS DENIED 4 $71,325 14 $43,929 51 $52,757 8 $29,466 6 $31,022 APPLICATIONS WITHDRAWN 2 $66,780 6 $87,750 27 $70,491 4 $17,358 1 $79,830 FILES CLOSED FOR INCOMPLETENESS 1 $79,510 1 $87,890 8 $54,022 0 $0 0 $0
Aggregated Statistics For Year 2000(Based on 2 partial tracts) A) FHA, FSA/RHS & VA B) Conventional C) Refinancings D) Home Improvement Loans E) Loans on Dwellings For 5+ Families F) Non-occupant Loans on Number Average Value Number Average Value Number Average Value Number Average Value Number Average Value Number Average Value
LOANS ORIGINATED 24 $70,578 76 $64,963 53 $67,299 22 $16,866 1 $108,610 25 $59,065 APPLICATIONS APPROVED, NOT ACCEPTED 4 $67,948 7 $52,727 8 $46,454 3 $9,827 0 $0 0 $0 APPLICATIONS DENIED 3 $64,933 23 $51,030 34 $48,811 8 $26,254 0 $0 3 $41,510 APPLICATIONS WITHDRAWN 4 $68,662 9 $72,581 18 $57,497 2 $14,055 0 $0 0 $0 FILES CLOSED FOR INCOMPLETENESS 0 $0 3 $57,563 2 $34,325 0 $0 0 $0 0 $0
Aggregated Statistics For Year 1999(Based on 2 partial tracts) A) FHA, FSA/RHS & VA B) Conventional C) Refinancings D) Home Improvement Loans E) Loans on Dwellings For 5+ Families F) Non-occupant Loans on Number Average Value Number Average Value Number Average Value Number Average Value Number Average Value Number Average Value
LOANS ORIGINATED 27 $72,993 72 $64,300 74 $55,505 25 $16,385 2 $558,870 17 $50,902 APPLICATIONS APPROVED, NOT ACCEPTED 1 $117,190 11 $62,412 20 $54,774 3 $16,837 0 $0 2 $47,130 APPLICATIONS DENIED 6 $74,603 35 $49,247 38 $50,709 5 $23,084 0 $0 6 $40,775 APPLICATIONS WITHDRAWN 0 $0 8 $74,339 27 $47,436 3 $42,107 0 $0 1 $24,160 FILES CLOSED FOR INCOMPLETENESS 0 $0 1 $63,240 3 $48,803 0 $0 0 $0 0 $0
Detailed HMDA statistics for the following Tracts:
0103.00
, 0114.00
Private Mortgage Insurance Companies Aggregated Statistics For Year 2009(Based on 2 partial tracts) A) Conventional B) Refinancings Number Average Value Number Average Value
LOANS ORIGINATED 6 $94,002 3 $125,300 APPLICATIONS APPROVED, NOT ACCEPTED 2 $60,445 1 $112,020 APPLICATIONS DENIED 0 $0 1 $118,160 APPLICATIONS WITHDRAWN 0 $0 0 $0 FILES CLOSED FOR INCOMPLETENESS 0 $0 0 $0
Aggregated Statistics For Year 2008(Based on 2 partial tracts) A) Conventional B) Refinancings C) Non-occupant Loans on Number Average Value Number Average Value Number Average Value
LOANS ORIGINATED 16 $103,844 4 $138,460 1 $110,700 APPLICATIONS APPROVED, NOT ACCEPTED 3 $124,730 4 $160,398 0 $0 APPLICATIONS DENIED 1 $70,730 0 $0 0 $0 APPLICATIONS WITHDRAWN 0 $0 0 $0 0 $0 FILES CLOSED FOR INCOMPLETENESS 0 $0 0 $0 0 $0
Aggregated Statistics For Year 2007(Based on 2 partial tracts) A) Conventional B) Refinancings C) Non-occupant Loans on Number Average Value Number Average Value Number Average Value
LOANS ORIGINATED 45 $92,027 9 $130,158 5 $61,110 APPLICATIONS APPROVED, NOT ACCEPTED 2 $63,970 3 $87,063 0 $0 APPLICATIONS DENIED 0 $0 0 $0 0 $0 APPLICATIONS WITHDRAWN 0 $0 0 $0 0 $0 FILES CLOSED FOR INCOMPLETENESS 0 $0 0 $0 0 $0
Aggregated Statistics For Year 2006(Based on 2 partial tracts) A) Conventional B) Refinancings C) Non-occupant Loans on Number Average Value Number Average Value Number Average Value
LOANS ORIGINATED 34 $93,123 5 $150,300 3 $84,063 APPLICATIONS APPROVED, NOT ACCEPTED 3 $72,607 1 $175,180 0 $0 APPLICATIONS DENIED 0 $0 0 $0 0 $0 APPLICATIONS WITHDRAWN 0 $0 0 $0 0 $0 FILES CLOSED FOR INCOMPLETENESS 0 $0 0 $0 0 $0
Aggregated Statistics For Year 2005(Based on 2 partial tracts) A) Conventional B) Refinancings C) Non-occupant Loans on Number Average Value Number Average Value Number Average Value
LOANS ORIGINATED 35 $92,668 9 $105,177 3 $53,960 APPLICATIONS APPROVED, NOT ACCEPTED 1 $138,140 2 $113,270 0 $0 APPLICATIONS DENIED 1 $129,030 0 $0 0 $0 APPLICATIONS WITHDRAWN 0 $0 1 $97,870 0 $0 FILES CLOSED FOR INCOMPLETENESS 0 $0 0 $0 0 $0
Aggregated Statistics For Year 2004(Based on 2 partial tracts) A) Conventional B) Refinancings Number Average Value Number Average Value
LOANS ORIGINATED 29 $103,750 12 $83,935 APPLICATIONS APPROVED, NOT ACCEPTED 3 $63,217 4 $143,382 APPLICATIONS DENIED 0 $0 0 $0 APPLICATIONS WITHDRAWN 0 $0 1 $53,300 FILES CLOSED FOR INCOMPLETENESS 0 $0 0 $0
Aggregated Statistics For Year 2003(Based on 2 partial tracts) A) Conventional B) Refinancings C) Non-occupant Loans on Number Average Value Number Average Value Number Average Value
LOANS ORIGINATED 28 $89,395 42 $91,225 3 $56,820 APPLICATIONS APPROVED, NOT ACCEPTED 2 $133,555 2 $102,065 0 $0 APPLICATIONS DENIED 0 $0 0 $0 0 $0 APPLICATIONS WITHDRAWN 0 $0 0 $0 0 $0 FILES CLOSED FOR INCOMPLETENESS 0 $0 0 $0 0 $0
Aggregated Statistics For Year 2002(Based on 2 partial tracts) A) Conventional B) Refinancings C) Non-occupant Loans on Number Average Value Number Average Value Number Average Value
LOANS ORIGINATED 35 $88,345 21 $86,134 4 $49,988 APPLICATIONS APPROVED, NOT ACCEPTED 1 $109,720 3 $90,443 1 $23,540 APPLICATIONS DENIED 0 $0 1 $55,530 0 $0 APPLICATIONS WITHDRAWN 0 $0 2 $63,175 0 $0 FILES CLOSED FOR INCOMPLETENESS 0 $0 0 $0 0 $0
Aggregated Statistics For Year 2001(Based on 2 partial tracts) A) Conventional B) Refinancings C) Non-occupant Loans on Number Average Value Number Average Value Number Average Value
LOANS ORIGINATED 25 $74,839 18 $96,613 2 $56,530 APPLICATIONS APPROVED, NOT ACCEPTED 3 $77,967 1 $96,570 0 $0 APPLICATIONS DENIED 0 $0 0 $0 0 $0 APPLICATIONS WITHDRAWN 0 $0 0 $0 0 $0 FILES CLOSED FOR INCOMPLETENESS 0 $0 0 $0 0 $0
Aggregated Statistics For Year 2000(Based on 2 partial tracts) A) Conventional B) Refinancings C) Non-occupant Loans on Number Average Value Number Average Value Number Average Value
LOANS ORIGINATED 30 $76,845 3 $82,277 1 $43,090 APPLICATIONS APPROVED, NOT ACCEPTED 3 $119,940 1 $103,950 0 $0 APPLICATIONS DENIED 2 $63,075 0 $0 0 $0 APPLICATIONS WITHDRAWN 0 $0 0 $0 0 $0 FILES CLOSED FOR INCOMPLETENESS 0 $0 0 $0 0 $0
Aggregated Statistics For Year 1999(Based on 2 partial tracts) A) Conventional B) Refinancings Number Average Value Number Average Value
LOANS ORIGINATED 32 $76,943 8 $80,979 APPLICATIONS APPROVED, NOT ACCEPTED 2 $84,095 2 $83,055 APPLICATIONS DENIED 2 $74,795 0 $0 APPLICATIONS WITHDRAWN 0 $0 0 $0 FILES CLOSED FOR INCOMPLETENESS 0 $0 0 $0
Detailed PMIC statistics for the following Tracts:
0103.00
, 0114.00
Most common first names in Webb City, MO among deceased individuals Name Count Lived (average)
John 84 72.9 years Mary 81 80.6 years James 80 68.6 years William 74 74.5 years Robert 62 73.3 years Charles 60 72.8 years Ruth 44 79.2 years George 37 73.5 years Helen 33 76.9 years Ralph 31 75.3 years
Most common last names in Webb City, MO among deceased individuals Last name Count Lived (average)
Smith 44 74.2 years Johnson 36 79.9 years Miller 26 77.4 years Martin 23 71.3 years Webb 23 77.3 years Wilson 22 76.1 years Jones 22 77.2 years Williams 20 72.9 years Moore 19 75.0 years Clark 18 74.0 years
Webb City compared to Missouri state average:
Unemployed percentage below state average. Black race population percentage significantly below state average. Foreign-born population percentage significantly below state average. Length of stay since moving in significantly above state average.
Top Patent Applicants
Umamaheswari Janakiraman (10)
Avinash Madadi (9)
Dong Zhang (5)
Min Qi Yang (4)
Ramanathan Thillaiyan (2)
Travis Turek (2)
Tim Pennock (2)
David Andrew Timothy Darch (2)
Thomas P. Long (2)
Adam Guenther (2)
Total of 37 patent applications in 2008-2024.


 Recent articles from our blog. Our writers, many of them Ph.D. graduates or candidates, create easy-to-read articles on a wide variety of topics.

 (65.3 miles
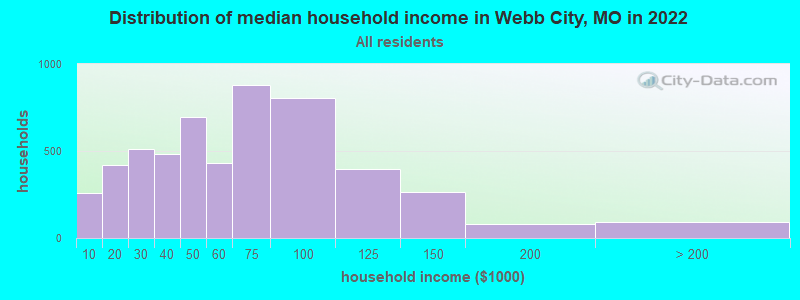


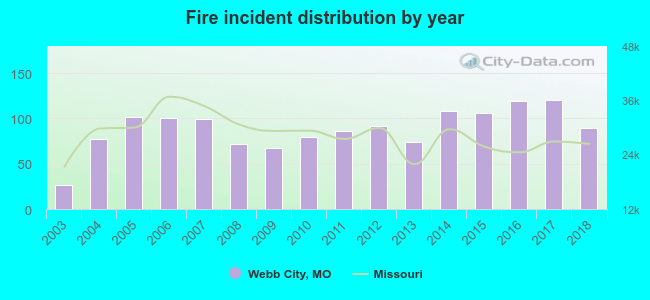 Based on the data from the years 2003 - 2018 the average number of fires per year is 89. The highest number of reported fires - 120 took place in 2017, and the least - 27 in 2003. The data has a rising trend.
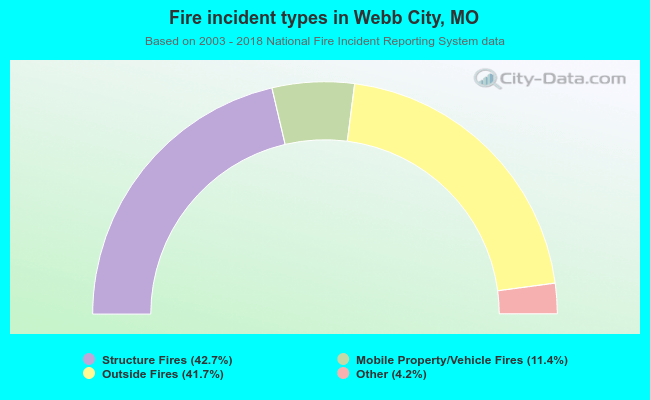 When looking into fire subcategories, the most incidents belonged to: Structure Fires (42.7%), and Outside Fires (41.7%).