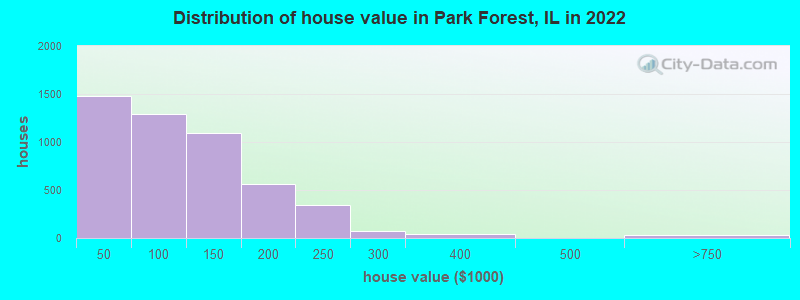
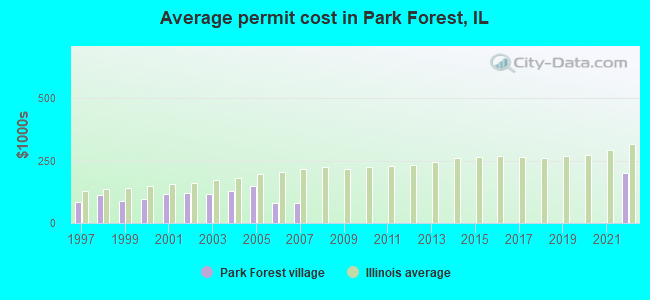
Estimated median house or condo value in 2022: $97,183 (it was $83,200 in 2000)
Park Forest:
$97,183
IL:
$251,600
Mean prices in 2022:all housing units: $113,411; detached houses: $138,874; townhouses or other attached units: $67,324; in 2-unit structures: $47,893; in 3-to-4-unit structures: $43,235; in 5-or-more-unit structures: $37,462
Median gross rent in 2022: $1,363.
March 2022 cost of living index in Park Forest: 99.2 (near average, U.S. average is 100)
Percentage of residents living in poverty in 2022: 17.3%
(17.2% for White Non-Hispanic residents, 15.7% for Black residents, 29.6% for Hispanic or Latino residents, 40.1% for American Indian residents, 23.0% for other race residents, 19.1% for two or more races residents)
According to our research of Illinois and other state lists, there were 19 registered sex offenders living in Park Forest, Illinois as of June 16, 2024. The ratio of all residents to sex offenders in Park Forest is 1,144 to 1. The ratio of registered sex offenders to all residents in this city is lower than the state average.
Crime rates in Park Forest by year
Type
2010
2011
2012
2013
2014
2015
2016
2017
2018
2019
2020
2021
2022
Murders (per 100,000)
4 (18.2)
0 (0.0)
1 (4.5)
1 (4.5)
0 (0.0)
1 (4.5)
2 (9.1)
1 (4.6)
1 (4.6)
1 (4.7)
1 (4.7)
0 (0.0)
4 (19.1)
Rapes (per 100,000)
3 (13.7)
6 (27.2)
8 (36.2)
11 (49.9)
8 (36.2)
15 (68.0)
11 (50.1)
15 (69.0)
4 (18.5)
16 (74.9)
7 (33.1)
3 (14.4)
8 (38.3)
Robberies (per 100,000)
18 (81.9)
24 (108.9)
27 (122.2)
49 (222.2)
30 (135.9)
26 (117.9)
34 (154.9)
27 (124.1)
24 (110.9)
29 (135.8)
12 (56.8)
9 (43.2)
17 (81.4)
Assaults (per 100,000)
25 (113.8)
31 (140.6)
30 (135.8)
36 (163.3)
30 (135.9)
31 (140.6)
28 (127.6)
24 (110.3)
32 (147.9)
39 (182.6)
44 (208.3)
11 (52.8)
36 (172.3)
Burglaries (per 100,000)
186 (846.4)
275 (1,248)
366 (1,657)
141 (639.4)
109 (493.8)
95 (430.9)
110 (501.2)
70 (321.8)
75 (346.6)
70 (327.7)
28 (132.5)
9 (43.2)
26 (124.4)
Thefts (per 100,000)
240 (1,092)
234 (1,062)
307 (1,390)
304 (1,379)
255 (1,155)
283 (1,284)
209 (952.3)
217 (997.7)
218 (1,008)
210 (983.2)
151 (714.8)
87 (417.6)
171 (818.3)
Auto thefts (per 100,000)
7 (31.9)
16 (72.6)
25 (113.2)
23 (104.3)
20 (90.6)
20 (90.7)
34 (154.9)
41 (188.5)
51 (235.7)
43 (201.3)
49 (232.0)
18 (86.4)
90 (430.7)
Arson (per 100,000)
4 (18.2)
5 (22.7)
4 (18.1)
2 (9.1)
1 (4.5)
5 (22.7)
4 (18.2)
3 (13.8)
7 (32.4)
3 (14.0)
1 (4.7)
7 (33.6)
4 (19.1)
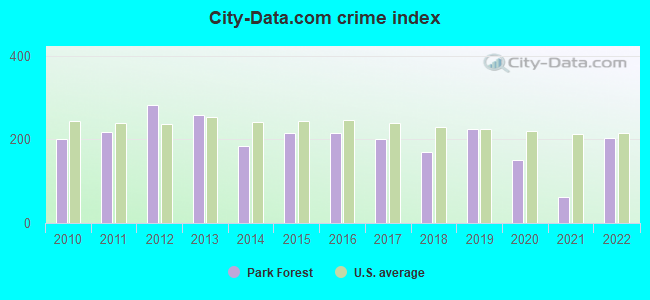
City-Data.com crime index
200.1
218.2
282.5
256.5
185.0
215.8
215.9
201.2
170.3
224.9
151.1
61.7
203.7
The City-Data.com crime index weighs serious crimes and violent crimes more heavily. Higher means more crime, U.S. average is 246.1. It adjusts for the number of visitors and daily workers commuting into cities.
Latest news from Park Forest, IL collected exclusively by city-data.com from local newspapers, TV, and radio stations
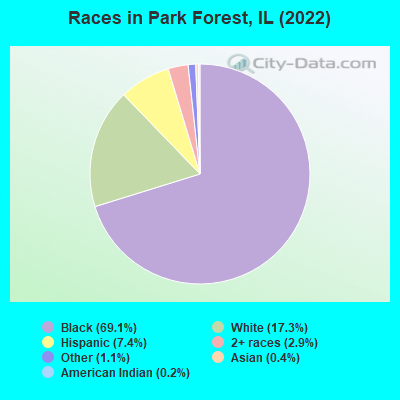
Ancestries: African (3.9%), American (1.3%), German (1.2%), English (1.1%), Irish (1.0%).
Current Local Time: CST time zone
Incorporated on 05/24/1949
Elevation: 720 feet
Land area: 4.93 square miles.
Population density: 4,254 people per square mile (average).
978 residents are foreign born (2.2% Latin America, 1.4% Africa, 0.7% Europe).
This village:
4.8%
Illinois:
14.1%
Median real estate property taxes paid for housing units with mortgages in 2022: $4,272 (3.8%) Median real estate property taxes paid for housing units with no mortgage in 2022: $3,011 (4.2%)
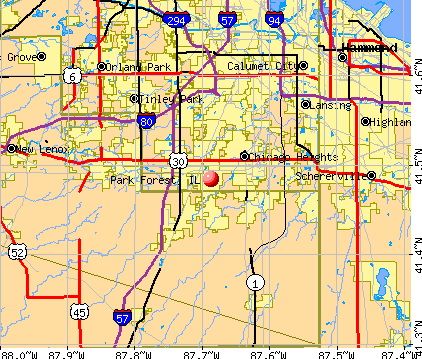
Nearest city with pop. 50,000+: Orland Park, IL (12.4 miles , pop. 51,077).
Nearest city with pop. 200,000+: Chicago, IL (24.7 miles , pop. 2,896,016).
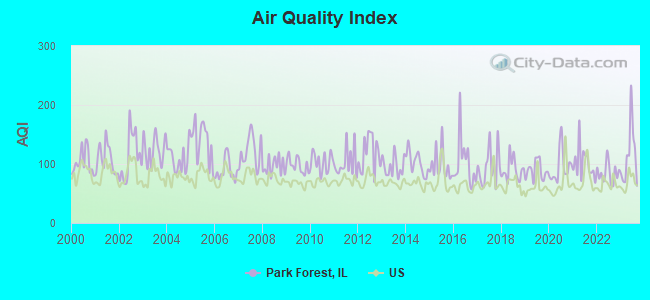
Air Quality Index (AQI) level in 2023 was 114. This is significantly worse than average.
City:
114
U.S.:
73
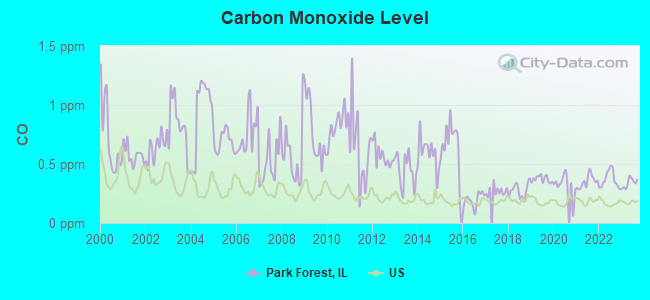
Carbon Monoxide (CO) [ppm] level in 2023 was 0.339. This is worse than average.Closest monitor was 3.0 miles away from the city center.
City:
0.339
U.S.:
0.251
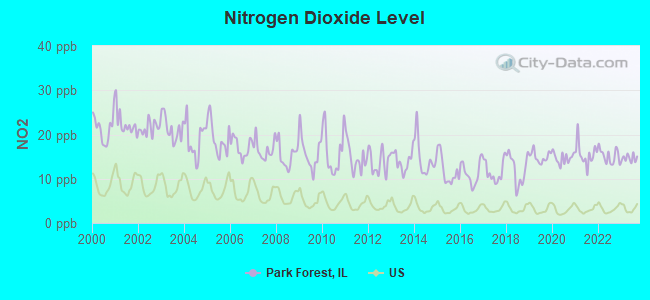
Nitrogen Dioxide (NO2) [ppb] level in 2023 was 14.7. This is significantly worse than average.Closest monitor was 2.5 miles away from the city center.
City:
14.7
U.S.:
5.1
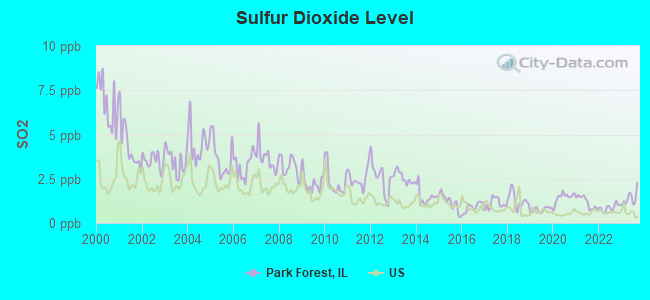
Sulfur Dioxide (SO2) [ppb] level in 2023 was 1.39. This is about average.Closest monitor was 2.5 miles away from the city center.
City:
1.39
U.S.:
1.51
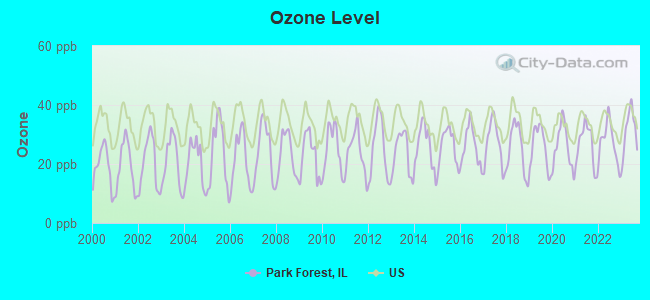
Ozone [ppb] level in 2023 was 31.2. This is about average.Closest monitor was 3.0 miles away from the city center.
City:
31.2
U.S.:
33.3
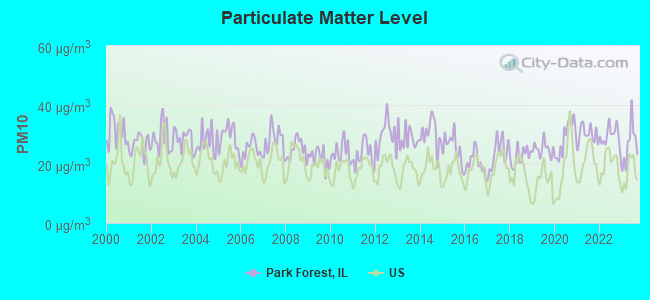
Particulate Matter (PM10) [µg/m3] level in 2023 was 26.5. This is worse than average.Closest monitor was 9.2 miles away from the city center.
City:
26.5
U.S.:
19.2
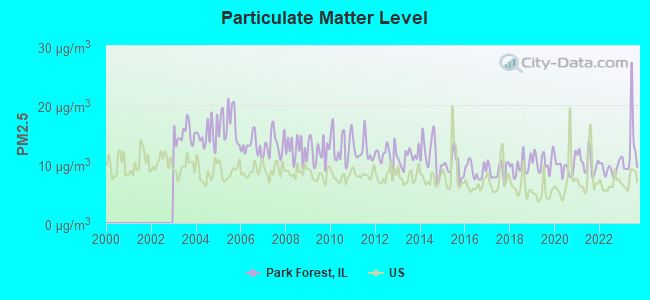
Particulate Matter (PM2.5) [µg/m3] level in 2023 was 12.5. This is significantly worse than average.Closest monitor was 9.4 miles away from the city center.
City:
12.5
U.S.:
8.1
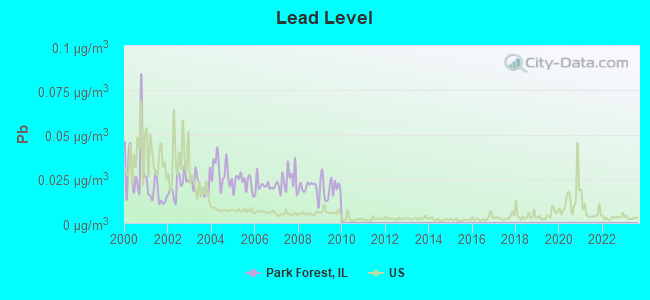
Lead (Pb) [µg/m3] level in 2009 was 0.0201. This is significantly worse than average.Closest monitor was 2.5 miles away from the city center.
City:
0.0201
U.S.:
0.0093
Tornado activity:
Park Forest-area historical tornado activity is near Illinois state average. It is 64% greater than the overall U.S. average.
On 8/28/1990, a category F5 (max. wind speeds 261-318 mph) tornado 21.5 miles away from the Park Forest village center killed 29 peopleand injured 350 peopleand causedbetween $50,000 and $500,000 in damages.
On 4/21/1967, a category F4 (max. wind speeds 207-260 mph) tornado 14.8 miles away from the village center killed 33 peopleand injured 500 peopleand causedbetween $5,000,000 and $50,000,000 in damages.
Earthquake activity:
Park Forest-area historical earthquake activity is significantly above Illinois state average. It is 48% greater than the overall U.S. average.
On 4/18/2008 at 09:36:59, a magnitude 5.4 (5.1 MB, 4.8 MS, 5.4 MW, 5.2 MW, Class: Moderate, Intensity: VI - VII) earthquake occurred 210.0 miles away from the city center On 6/10/1987 at 23:48:54, a magnitude 5.1 (4.9 MB, 4.4 MS, 4.6 MS, 5.1 LG) earthquake occurred 184.5 miles away from Park Forest center On 4/18/2008 at 09:36:59, a magnitude 5.2 (5.2 MW, Depth: 8.9 mi) earthquake occurred 210.0 miles away from the city center On 6/28/2004 at 06:10:52, a magnitude 4.2 (4.2 MW, Depth: 6.2 mi, Class: Light, Intensity: IV - V) earthquake occurred 62.9 miles away from the city center On 6/18/2002 at 17:37:15, a magnitude 5.0 (4.3 MB, 4.6 MW, 5.0 LG) earthquake occurred 241.9 miles away from Park Forest center On 4/18/2008 at 15:14:16, a magnitude 4.8 (4.5 MB, 4.8 MW, 4.6 MW) earthquake occurred 208.2 miles away from Park Forest center Magnitude types: regional Lg-wave magnitude (LG), body-wave magnitude (MB), surface-wave magnitude (MS), moment magnitude (MW)
Natural disasters:
The number of natural disasters in Cook County (20) is greater than the US average (15). Major Disasters (Presidential) Declared: 15 Emergencies Declared: 4
Causes of natural disasters: Floods: 13, Storms: 12, Tornadoes: 3, Snowstorms: 2, Winter Storms: 2, Blizzard: 1, Hurricane: 1, Snow: 1, Wind: 1, Other: 1 (Note: some incidents may be assigned to more than one category).
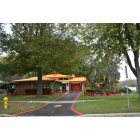
Hospitals and medical centers in Park Forest:
ELISABETH LUDEMAN DEV. CTR. (114 NORTH ORCHARD DRIVE)
ANGELS HOME HEALTHCARE SOLUTIONS (282 MAIN STREET, BUILDING 1 FLOOR 2)
FOREST HOME HEALTHCARE, INC (356 FOREST BLVD)
HIS GRACE HOME HEALTHCARE, INC (318 FOREST BOULEVARD)
NURSES PLUS HOME HEALTHCARE (350 VICTORY DRIVE)
RELIABLE HEALTHCARE SERVICES, LLC (260 MAIN STREET)
Amtrak stations near Park Forest:
6 miles: HOMEWOOD (181 1ST ST. & PARK AVE.) . Services: ticket office, enclosed waiting area, public restrooms, public payphones, paid short-term parking, paid long-term parking, public transit connection.
PARK FOREST PUBLIC LIBRARY (Operating income: $1,688,754; Location: 400 LAKEWOOD BOULEVARD; 137,462 books; 621 e-books; 6,747 audio materials; 6,818 video materials; 4 local licensed databases; 17 state licensed databases; 5 other licensed databases; 645 print serial subscriptions; 6 electronic serial subscriptions)
User-submitted facts and corrections:
Travel: 50th Anniversary House Museum 397 Forest Boulevard Open 1-3 p.m. most Saturdays, or by appointment. Not open on Major holidays. Call 708-481-4252 for appointments and information. Check website for Park Forest Historical Society for a virtual tour. Available via www.pfpl.org. [Society website temporarily down as I am writing this. anticipated to be back up within the next couple of weeks.]
Notable locations in Park Forest: Hidden Meadows Golf Club (A), Elisabeth Ludeman Developmental Center (B), Park Forest Public Library (C), Park Forest Fire Department (D), Park Forest Village Hall (E). Display/hide their locations on the map
Shopping Centers: Lincolnwood Shopping Center (1), Lincolnwood West Shopping Center (2), Central Court Plaza Shopping Center (3), Norwood Plaza Shopping Center (4), Plaza West Shopping Center (5), The Center Shopping Center (6), Tower Shopping Center (7). Display/hide their locations on the map
Churches in Park Forest include: Church of the Holy Family (A), Congregation Am Echod (B), Faith United Protestant Church (C), First Baptist Church (D), First Church of Christ (E), Hallelujah Temple Ministries (F), Saint Irenaeus Church (G), Saint Paul's - Good Shepherd Church (H), Trinity Lutheran Church (I). Display/hide their locations on the map
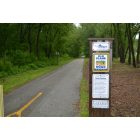
Parks in Park Forest include: Illinois Park (1), Wildwood Park (2), Indiana Park (3), Shabbona Park (4), Logan Park (5), Eastgate Park (6), Cedar Park (7), Algonquin Park (8), Murphy Park (9). Display/hide their locations on the map
Tourist attraction: Universal Dynamics (Art Museums; 148 Elm Street).
Birthplace of: David Liebe Hart - Film actor, Jeff Mariotte - Writer, Tom Spahn - Pianist, Tony Lombardi - Football coach, Ariel Alexandria Davis - Actor, Jibril Hodges - College basketball player (Long Beach State 49ers), Larry McCarren - Football player, Mark Derwin - Soap opera actor.
Cook County has a predicted average indoor radon screening level between 2 and 4 pCi/L (pico curies per liter) - Moderate Potential
Average household size:
This village:
2.5 people
Illinois:
2.6 people
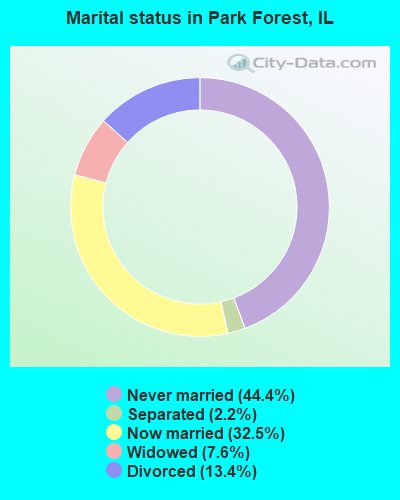
Percentage of family households:
This village:
62.8%
Whole state:
65.8%
Percentage of households with unmarried partners:
This village:
5.7%
Whole state:
6.3%
Likely homosexual households (counted as self-reported same-sex unmarried-partner households)
Lesbian couples: 0.3% of all households
Gay men: 0.2% of all households
People in group quarters in Park Forest in 2010:
398 people in residential treatment centers for adults
15 people in emergency and transitional shelters (with sleeping facilities) for people experiencing homelessness
8 people in group homes for juveniles (non-correctional)
7 people in group homes intended for adults
405 people in schools, hospitals, or wards for the intellectually disabled in 2000
10 people in other group homes in 2000
Banks with branches in Park Forest (2011 data):
JPMorgan Chase Bank, National Association: Park Forest at 202 Forest Boulevard, branch established on 1883/01/01. Info updated 2011/11/10: Bank assets: $1,811,678.0 mil, Deposits: $1,190,738.0 mil, headquarters in Columbus, OH, positive income, International Specialization, 5577 total offices, Holding Company: Jpmorgan Chase & Co.
First Midwest Bank: Park Forest Branch at 2 Main Street, branch established on 2001/11/20. Info updated 2011/12/22: Bank assets: $7,848.0 mil, Deposits: $6,529.2 mil, headquarters in Itasca, IL, positive income, Commercial Lending Specialization, 100 total offices, Holding Company: First Midwest Bancorp, Inc.
U.S. Bank National Association: Park Forest Branch at 99 Indianwood Boulevard, branch established on 1953/04/25. Info updated 2012/01/30: Bank assets: $330,470.8 mil, Deposits: $236,091.5 mil, headquarters in Cincinnati, OH, positive income, 3121 total offices, Holding Company: U.S. Bancorp
Religion statistics for Park Forest, IL (based on Cook County data)
Religion
Adherents
Congregations
Catholic
1,947,223
376
Evangelical Protestant
432,975
1,484
Other
312,636
403
Mainline Protestant
202,114
630
Black Protestant
148,895
395
Orthodox
53,276
66
None
2,097,556
-
Source: Clifford Grammich, Kirk Hadaway, Richard Houseal, Dale E.Jones, Alexei Krindatch, Richie Stanley and Richard H.Taylor. 2012. 2010 U.S.Religion Census: Religious Congregations & Membership Study. Association of Statisticians of American Religious Bodies. Jones, Dale E., et al. 2002. Congregations and Membership in the United States 2000. Nashville, TN: Glenmary Research Center. Graphs represent county-level data
Richard Byrne, 75 Park St (Lat: 41.494750 Lon: -87.677556), Type: 41.7, Overall height: 37 m, Registrant: Towerco Assets LLC, Afry@towerco.Com, , Cary, Phone: (919) 653-5710
Richard Byrne, 75 Park St (Lat: 41.494750 Lon: -87.677556), Type: 41.7, Overall height: 37 m, Registrant: Towerco Assets LLC, Afry@towerco.Com, , Cary, Phone: (919) 653-5710
Brian Meier, 114 N Orchard Rd (Lat: 41.496500 Lon: -87.683167), Type: 35.0, Overall height: 33.5 m, Registrant: Central States Tower Ii, LLC, Brianm@cstower.Org, , Wheat-on, Phone: (630) 221-8500
Edward G Roach, 75 Park St (Lat: 41.494750 Lon: -87.677556), Type: 41.7, Structure height: 17031 m, Overall height: 37 m, Registrant: Sba 2012 Tc Assets, LLC, Eroach@sbasite.Com, , Boca -Raton, Phone: (561) 995-7670
FCC Registered Broadcast Land Mobile Towers:
6
Governors State University Il Rt 54 & Stuenkel Rd (Lat: 41.448917 Lon: -87.715889), Call Sign: KTK647, Assigned Frequencies: 453.600 MHz, 453.650 MHz, 458.600 MHz, 458.650 MHz, Grant Date: 09/16/2021, Expiration Date: 12/05/2031, Registrant: Illinois State Police, 801 S 7th St - Csb Ste 300 Annex, Springfield, IL 62703, Phone: (217) 524-3542, Email:
E Ludeman Development Ctr 114 N Orchard St (Lat: 41.497250 Lon: -87.684778), Call Sign: KUU365, Assigned Frequencies: 453.350 MHz, 453.875 MHz, 458.350 MHz, 458.875 MHz, Grant Date: 09/16/2021, Expiration Date: 12/05/2031, Registrant: Illinois State Police, 801 S 7th St - Csb Ste 300 Annex, Springfield, IL 62703, Phone: (217) 524-3542, Email:
Gov St Univ Rt 54 & Stuenkel Rd (Lat: 41.448917 Lon: -87.698667), Call Sign: KXH777, Assigned Frequencies: 453.600 MHz, 453.650 MHz, Grant Date: 09/16/2021, Expiration Date: 12/05/2031, Registrant: Illinois State Police, 801 S 7th St - Csb Ste 300 Annex, Springfield, IL 62703, Phone: (217) 524-3542, Email:
Lakewood & Forest Blvd (Lat: 41.485306 Lon: -87.679500), Type: Ltower, Structure height: 25 m, Call Sign: KSB646, Assigned Frequencies: 155.190 MHz, 155.370 MHz, Grant Date: 02/21/2023, Expiration Date: 02/19/2033, Registrant: Park Forest Fire Department, 156 Indianwood Blvd, Park Forest, IL 60466, Phone: (708) 481-4549, Email:
Lat: 41.493056 Lon: -87.705556, Call Sign: WPTW445, Assigned Frequencies: 453.487 MHz, Grant Date: 10/05/2021, Expiration Date: 12/31/2031, Certifier: Bruce M Marcheschi, Registrant: Northeast Illinois Regional Commuter Railroad Corporation, 547 West Jackson Boulevard, Chicago, IL 60661, Phone: (312) 322-8267, Fax: (312) 322-6919, Email:
L5 MOBILES, Lat: 41.495028 Lon: -87.679444, Call Sign: WQTC251, Assigned Frequencies: 160.920 MHz, 160.350 MHz, Grant Date: 12/07/2023, Expiration Date: 01/02/2034, Certifier: Theodore K Kalick, Registrant: Cn, 17641 South Ashland Avenue, Homewood, IL 60430, Phone: (708) 332-6750, Email:
FCC Registered Microwave Towers:
4
Rich East H.S., 300 Sauk Trail (Lat: 41.481861 Lon: -87.692194), Type: Building, Structure height: 30.5 m, Overall height: 33.5 m, Call Sign: WQHC913, Assigned Frequencies: 22175.0 MHz, 22425.0 MHz, Grant Date: 04/11/2017, Expiration Date: 06/29/2027, Certifier: Elizabeth Creekmore, Registrant: Intelpath, 50 E 26th St., #404, Chicago, IL 60616, Phone: (312) 841-9188, Email:
CH01YC558, 75 Park Street (Lat: 41.494750 Lon: -87.677528), Type: Tower, Structure height: 38.4 m, Call Sign: WQJS376, Assigned Frequencies: 23025.0 MHz, 23025.0 MHz, 23025.0 MHz, 23025.0 MHz, 23025.0 MHz, 23025.0 MHz, Grant Date: 12/10/2008, Expiration Date: 12/10/2018, Cancellation Date: 01/04/2010, Certifier: Nadja S Sodos-Wallace, Registrant: Clearwire Corporation, 815 Connecticut Avenue, Nw, Suite 610, Washington, DC 20006, Phone: (202) 330-4011, Fax: (202) 330-4008, Email:
IL-CHI5558, 75 Park St (Lat: 41.494750 Lon: -87.677528), Type: Tower, Structure height: 37 m, Overall height: 41.7 m, Call Sign: WQLB959, Assigned Frequencies: 11055.0 MHz, Grant Date: 01/14/2020, Expiration Date: 11/30/2029, Cancellation Date: 09/08/2021, Certifier: Nadja S Sodos-Wallace, Registrant: T-Mobile Usa, Inc., 12920 Se 38th Street, Bellevue, WA 98006, Phone: (425) 383-8401, Fax: (425) 383-4840, Email:
Aircraft: PIPER PA-22-150 (Category: Land, Seats: 4, Weight: Up to 12,499 Pounds, Speed: 94 mph), Engine: LYCOMING 0-320 SERIES (180 HP) (Reciprocating) N-Number: 2344P, N2344P, N-2344P, Serial Number: 22-2755, Year manufactured: 1955, Airworthiness Date: 11/22/1967, Certificate Issue Date: 07/13/2012 Registrant (Individual): James M Vieaux, 340 Oswego St, Park Forest, IL 60466
Aircraft: CESSNA 177B (Category: Land, Seats: 4, Weight: Up to 12,499 Pounds, Speed: 108 mph), Engine: LYCOMING O&VO-360 SER (180 HP) (Reciprocating) N-Number: 30887, N30887, N-30887, Serial Number: 17701525, Year manufactured: 1970, Airworthiness Date: 07/21/1970, Certificate Issue Date: 01/07/2016 Registrant (Individual): Victor T Jr Needham, 105 Warwick St, Park Forest, IL 60466
Aircraft: CESSNA 182N (Category: Land, Seats: 4, Weight: Up to 12,499 Pounds, Speed: 119 mph), Engine: CONT MOTOR O-470 SERIES (230 HP) (Reciprocating) N-Number: 9198G, N9198G, N-9198G, Serial Number: 18260738, Year manufactured: 1971, Airworthiness Date: 08/05/1971, Certificate Issue Date: 08/05/2013 Registrant (Individual): Albert Jr Fenedick, 441 Wildwood Dr, Park Forest, IL 60466
Aircraft: ENGINEERING & RESEARCH 415-C (Category: Land, Seats: 2, Weight: Up to 12,499 Pounds, Speed: 90 mph), Engine: CONT MOTOR A&C75 SERIES (75 HP) (Reciprocating) N-Number: 3413H, N3413H, N-3413H, Serial Number: 4038, Year manufactured: 1946 Registrant (Individual): Robert E Waggaman, 429 Tomahawk St, Park Forest, IL 60466 Deregistered:Cancel Date: 03/13/2020
Aircraft: CESSNA 140 (Category: Land, Seats: 2, Weight: Up to 12,499 Pounds, Speed: 105 mph), Engine: CONT MOTOR C85 SERIES (85 HP) (Reciprocating) N-Number: 72574, N72574, N-72574, Serial Number: 9744, Year manufactured: 1946 Registrant (Individual): Frank Leo Dougher, 131 Nauvoo, Park Forest, IL 60466 Deregistered:Cancel Date: 11/21/2017
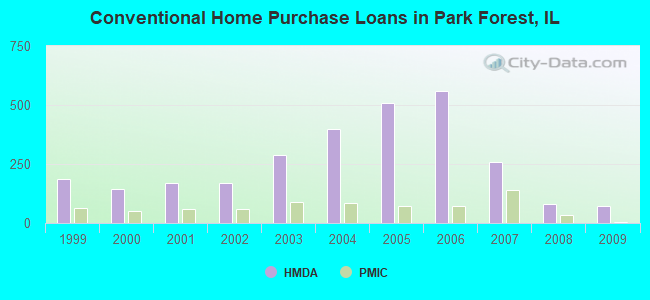
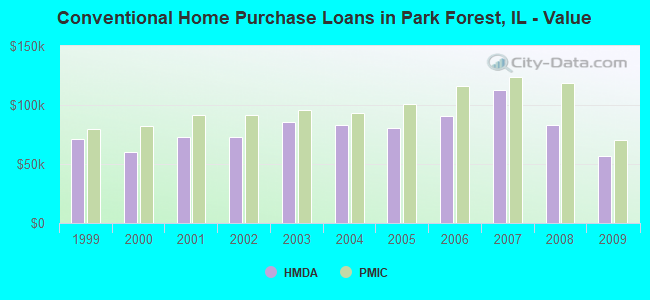
Home Mortgage Disclosure Act Aggregated Statistics For Year 2009 (Based on 3 full and 3 partial tracts)
A) FHA, FSA/RHS & VA Home Purchase Loans
B) Conventional Home Purchase Loans
C) Refinancings
D) Home Improvement Loans
F) Non-occupant Loans on < 5 Family Dwellings (A B C & D)
Number
Average Value
Number
Average Value
Number
Average Value
Number
Average Value
Number
Average Value
LOANS ORIGINATED
56
$113,422
72
$56,518
191
$122,149
8
$28,168
64
$71,633
APPLICATIONS APPROVED, NOT ACCEPTED
4
$92,920
4
$70,200
29
$128,377
0
$0
2
$93,445
APPLICATIONS DENIED
26
$117,415
50
$43,426
119
$120,147
36
$41,247
18
$79,517
APPLICATIONS WITHDRAWN
10
$103,897
0
$0
62
$123,410
3
$64,823
4
$108,032
FILES CLOSED FOR INCOMPLETENESS
6
$134,040
0
$0
32
$123,083
1
$100,000
0
$0
Aggregated Statistics For Year 2008 (Based on 3 full and 3 partial tracts)
A) FHA, FSA/RHS & VA Home Purchase Loans
B) Conventional Home Purchase Loans
C) Refinancings
D) Home Improvement Loans
E) Loans on Dwellings For 5+ Families
F) Non-occupant Loans on < 5 Family Dwellings (A B C & D)
Number
Average Value
Number
Average Value
Number
Average Value
Number
Average Value
Number
Average Value
Number
Average Value
LOANS ORIGINATED
95
$131,704
81
$83,376
237
$123,374
22
$45,191
0
$0
60
$74,973
APPLICATIONS APPROVED, NOT ACCEPTED
5
$139,934
4
$138,505
26
$120,868
9
$37,731
0
$0
1
$54,740
APPLICATIONS DENIED
41
$147,318
39
$90,503
234
$126,096
83
$33,749
1
$850,000
31
$68,033
APPLICATIONS WITHDRAWN
17
$151,281
6
$141,120
63
$130,394
5
$51,544
0
$0
2
$92,795
FILES CLOSED FOR INCOMPLETENESS
1
$146,560
5
$120,940
28
$136,941
3
$102,303
0
$0
1
$85,000
Aggregated Statistics For Year 2007 (Based on 3 full and 3 partial tracts)
A) FHA, FSA/RHS & VA Home Purchase Loans
B) Conventional Home Purchase Loans
C) Refinancings
D) Home Improvement Loans
E) Loans on Dwellings For 5+ Families
F) Non-occupant Loans on < 5 Family Dwellings (A B C & D)
G) Loans On Manufactured Home Dwelling (A B C & D)
Number
Average Value
Number
Average Value
Number
Average Value
Number
Average Value
Number
Average Value
Number
Average Value
Number
Average Value
LOANS ORIGINATED
43
$146,850
260
$112,588
347
$114,629
55
$50,211
3
$1,998,563
90
$84,890
0
$0
APPLICATIONS APPROVED, NOT ACCEPTED
3
$120,573
46
$100,878
89
$110,132
13
$52,502
0
$0
13
$95,051
1
$70,000
APPLICATIONS DENIED
16
$141,059
131
$120,409
376
$124,119
115
$52,015
0
$0
61
$82,516
2
$40,725
APPLICATIONS WITHDRAWN
5
$143,688
38
$123,181
113
$127,110
13
$72,267
0
$0
14
$92,547
0
$0
FILES CLOSED FOR INCOMPLETENESS
2
$114,535
19
$121,109
49
$133,060
2
$76,000
0
$0
4
$104,992
0
$0
Aggregated Statistics For Year 2006 (Based on 3 full and 3 partial tracts)
A) FHA, FSA/RHS & VA Home Purchase Loans
B) Conventional Home Purchase Loans
C) Refinancings
D) Home Improvement Loans
E) Loans on Dwellings For 5+ Families
F) Non-occupant Loans on < 5 Family Dwellings (A B C & D)
Number
Average Value
Number
Average Value
Number
Average Value
Number
Average Value
Number
Average Value
Number
Average Value
LOANS ORIGINATED
35
$137,532
558
$90,260
436
$109,261
61
$57,000
2
$301,000
137
$96,332
APPLICATIONS APPROVED, NOT ACCEPTED
0
$0
117
$84,271
72
$107,159
11
$53,582
1
$21,000
27
$95,918
APPLICATIONS DENIED
10
$146,650
298
$87,343
474
$116,824
94
$66,896
0
$0
71
$83,853
APPLICATIONS WITHDRAWN
6
$123,057
95
$95,605
174
$119,418
11
$94,243
0
$0
26
$93,257
FILES CLOSED FOR INCOMPLETENESS
1
$91,000
39
$100,092
92
$121,237
2
$67,690
0
$0
13
$89,197
Aggregated Statistics For Year 2005 (Based on 3 full and 3 partial tracts)
A) FHA, FSA/RHS & VA Home Purchase Loans
B) Conventional Home Purchase Loans
C) Refinancings
D) Home Improvement Loans
E) Loans on Dwellings For 5+ Families
F) Non-occupant Loans on < 5 Family Dwellings (A B C & D)
G) Loans On Manufactured Home Dwelling (A B C & D)
Number
Average Value
Number
Average Value
Number
Average Value
Number
Average Value
Number
Average Value
Number
Average Value
Number
Average Value
LOANS ORIGINATED
54
$111,233
507
$80,561
479
$98,607
53
$45,071
2
$2,725,065
154
$77,103
2
$8,920
APPLICATIONS APPROVED, NOT ACCEPTED
4
$147,808
105
$86,374
119
$98,626
12
$37,647
0
$0
40
$83,697
2
$73,000
APPLICATIONS DENIED
7
$131,681
235
$83,321
482
$104,748
84
$28,223
0
$0
67
$82,741
1
$47,980
APPLICATIONS WITHDRAWN
3
$131,000
76
$88,034
178
$121,824
16
$131,588
1
$350,000
31
$97,295
0
$0
FILES CLOSED FOR INCOMPLETENESS
2
$102,155
33
$109,319
104
$106,227
2
$25,500
0
$0
5
$90,622
0
$0
Aggregated Statistics For Year 2004 (Based on 3 full and 3 partial tracts)
A) FHA, FSA/RHS & VA Home Purchase Loans
B) Conventional Home Purchase Loans
C) Refinancings
D) Home Improvement Loans
E) Loans on Dwellings For 5+ Families
F) Non-occupant Loans on < 5 Family Dwellings (A B C & D)
G) Loans On Manufactured Home Dwelling (A B C & D)
Number
Average Value
Number
Average Value
Number
Average Value
Number
Average Value
Number
Average Value
Number
Average Value
Number
Average Value
LOANS ORIGINATED
84
$111,719
397
$83,346
489
$93,488
42
$32,047
2
$9,535,000
116
$75,287
0
$0
APPLICATIONS APPROVED, NOT ACCEPTED
4
$175,635
94
$90,111
107
$100,900
12
$45,002
0
$0
25
$89,572
1
$70,000
APPLICATIONS DENIED
15
$121,920
153
$97,826
434
$97,639
73
$36,130
1
$329,280
47
$97,406
0
$0
APPLICATIONS WITHDRAWN
4
$127,408
62
$106,825
190
$105,460
12
$55,613
1
$408,000
15
$102,845
1
$100,000
FILES CLOSED FOR INCOMPLETENESS
4
$121,088
17
$80,713
87
$103,848
2
$54,840
0
$0
2
$71,860
0
$0
Aggregated Statistics For Year 2003 (Based on 3 full and 3 partial tracts)
A) FHA, FSA/RHS & VA Home Purchase Loans
B) Conventional Home Purchase Loans
C) Refinancings
D) Home Improvement Loans
E) Loans on Dwellings For 5+ Families
F) Non-occupant Loans on < 5 Family Dwellings (A B C & D)
Number
Average Value
Number
Average Value
Number
Average Value
Number
Average Value
Number
Average Value
Number
Average Value
LOANS ORIGINATED
90
$98,149
288
$85,869
789
$86,562
33
$19,850
1
$4,150,000
97
$68,173
APPLICATIONS APPROVED, NOT ACCEPTED
6
$90,247
65
$88,586
139
$91,066
10
$24,565
0
$0
15
$69,942
APPLICATIONS DENIED
9
$123,361
94
$83,837
410
$92,242
58
$17,587
0
$0
24
$68,121
APPLICATIONS WITHDRAWN
12
$94,189
39
$107,933
185
$97,044
6
$30,923
0
$0
11
$66,884
FILES CLOSED FOR INCOMPLETENESS
4
$90,932
17
$104,450
47
$98,588
1
$53,060
0
$0
2
$61,500
Aggregated Statistics For Year 2002 (Based on 3 full and 2 partial tracts)
A) FHA, FSA/RHS & VA Home Purchase Loans
B) Conventional Home Purchase Loans
C) Refinancings
D) Home Improvement Loans
E) Loans on Dwellings For 5+ Families
F) Non-occupant Loans on < 5 Family Dwellings (A B C & D)
Number
Average Value
Number
Average Value
Number
Average Value
Number
Average Value
Number
Average Value
Number
Average Value
LOANS ORIGINATED
111
$102,391
168
$72,545
375
$82,708
26
$19,574
1
$57,590
44
$62,792
APPLICATIONS APPROVED, NOT ACCEPTED
4
$99,772
36
$81,112
68
$91,520
5
$26,530
0
$0
14
$69,158
APPLICATIONS DENIED
15
$98,043
56
$63,252
231
$80,225
43
$12,446
0
$0
16
$81,792
APPLICATIONS WITHDRAWN
7
$105,779
28
$83,068
94
$81,593
5
$19,740
0
$0
10
$66,641
FILES CLOSED FOR INCOMPLETENESS
2
$80,995
3
$67,213
91
$75,738
0
$0
0
$0
3
$71,027
Aggregated Statistics For Year 2001 (Based on 3 full and 2 partial tracts)
A) FHA, FSA/RHS & VA Home Purchase Loans
B) Conventional Home Purchase Loans
C) Refinancings
D) Home Improvement Loans
F) Non-occupant Loans on < 5 Family Dwellings (A B C & D)
Number
Average Value
Number
Average Value
Number
Average Value
Number
Average Value
Number
Average Value
LOANS ORIGINATED
139
$93,556
168
$73,217
327
$76,106
39
$18,951
39
$59,124
APPLICATIONS APPROVED, NOT ACCEPTED
7
$74,039
23
$72,241
64
$67,747
15
$14,320
1
$72,680
APPLICATIONS DENIED
14
$99,310
59
$63,470
198
$72,512
44
$13,022
6
$54,717
APPLICATIONS WITHDRAWN
10
$99,231
31
$101,861
85
$82,619
9
$13,023
2
$63,015
FILES CLOSED FOR INCOMPLETENESS
2
$80,540
6
$107,068
28
$91,659
1
$10,000
2
$59,945
Aggregated Statistics For Year 2000 (Based on 3 full and 2 partial tracts)
A) FHA, FSA/RHS & VA Home Purchase Loans
B) Conventional Home Purchase Loans
C) Refinancings
D) Home Improvement Loans
E) Loans on Dwellings For 5+ Families
F) Non-occupant Loans on < 5 Family Dwellings (A B C & D)
Number
Average Value
Number
Average Value
Number
Average Value
Number
Average Value
Number
Average Value
Number
Average Value
LOANS ORIGINATED
121
$90,726
144
$60,346
131
$61,318
49
$17,422
3
$860,470
18
$53,975
APPLICATIONS APPROVED, NOT ACCEPTED
3
$110,797
28
$89,819
35
$72,391
15
$12,646
0
$0
2
$47,010
APPLICATIONS DENIED
11
$90,437
78
$63,538
153
$58,582
79
$14,146
0
$0
13
$59,263
APPLICATIONS WITHDRAWN
6
$84,827
23
$70,230
59
$67,610
14
$26,526
0
$0
6
$58,985
FILES CLOSED FOR INCOMPLETENESS
1
$33,870
9
$84,357
40
$73,464
1
$12,350
0
$0
3
$56,937
Aggregated Statistics For Year 1999 (Based on 4 full and 3 partial tracts)
A) FHA, FSA/RHS & VA Home Purchase Loans
B) Conventional Home Purchase Loans
C) Refinancings
D) Home Improvement Loans
E) Loans on Dwellings For 5+ Families
F) Non-occupant Loans on < 5 Family Dwellings (A B C & D)
2002 - 2018 National Fire Incident Reporting System (NFIRS) incidents
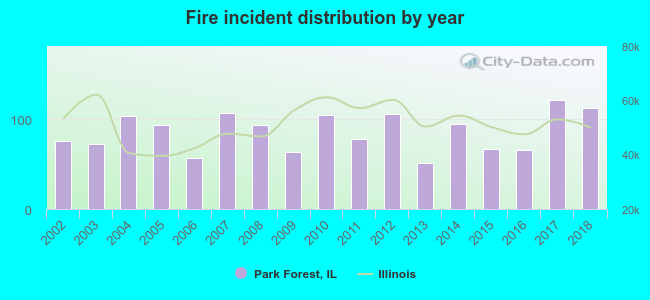
Based on the data from the years 2002 - 2018 the average number of fires per year is 86. The highest number of reported fire incidents - 121 took place in 2017, and the least - 51 in 2013. The data has an increasing trend.
When looking into fire subcategories, the most reports belonged to: Structure Fires (64.3%), and Outside Fires (19.4%).
Fire incident types reported to NFIRS in Park Forest, IL
#36 on the list of "Top 101 cities with the largest percentage of people in schools, hospitals, or wards for the mentally retarded (population 1,000+)"
#61 on the list of "Top 101 cities with largest percentage of males in industries: management of companies and enterprises (population 5,000+)"
#63 on the list of "Top 101 cities with the most people taking railroad to work (population 5,000+)"
#1 on the list of "Top 101 counties with the most Black Protestant congregations"
#1 on the list of "Top 101 counties with the most Catholic congregations"
#1 on the list of "Top 101 counties with the highest surface withdrawal of fresh water for public supply"
#2 on the list of "Top 101 counties with the most Black Protestant adherents"
#2 on the list of "Top 101 counties with the most Orthodox congregations (pop. 50,000+)"


 Recent articles from our blog. Our writers, many of them Ph.D. graduates or candidates, create easy-to-read articles on a wide variety of topics.

 (12.4 miles
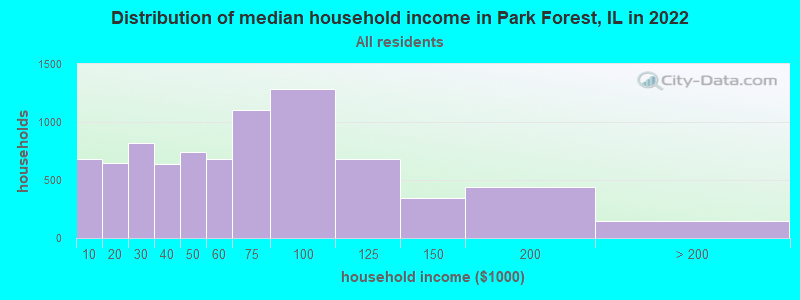
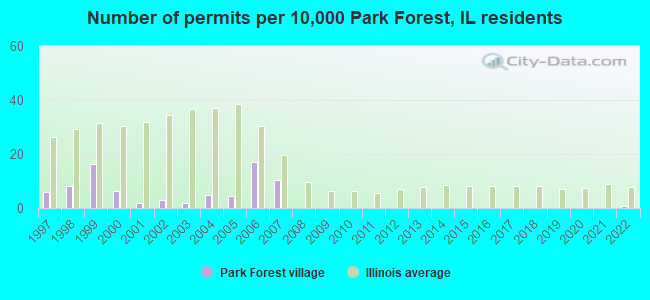


 Based on the data from the years 2002 - 2018 the average number of fires per year is 86. The highest number of reported fire incidents - 121 took place in 2017, and the least - 51 in 2013. The data has an increasing trend.
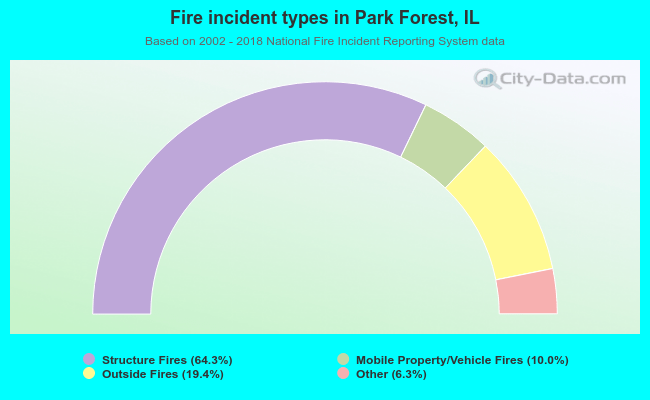 When looking into fire subcategories, the most reports belonged to: Structure Fires (64.3%), and Outside Fires (19.4%).