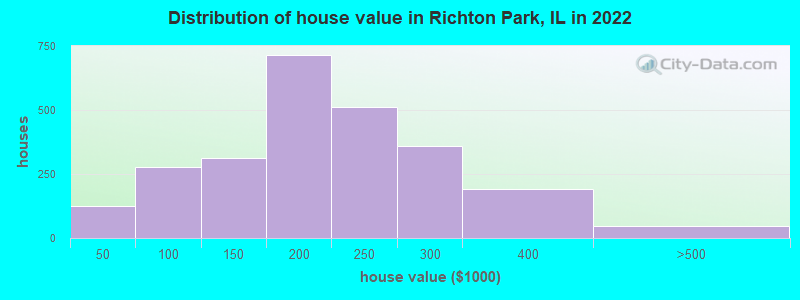
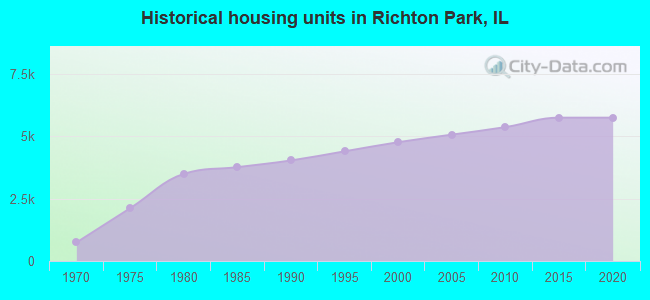
Estimated median house or condo value in 2022: $187,593 (it was $120,100 in 2000)
Richton Park:
$187,593
IL:
$251,600
Mean prices in 2022:all housing units: $375,299; detached houses: $398,817; townhouses or other attached units: $348,645; in 2-unit structures: $310,273; in 3-to-4-unit structures: $366,192; in 5-or-more-unit structures: $341,015; mobile homes: $69,289; occupied boats, rvs, vans, etc.: $126,496
Median gross rent in 2022: $1,230.
March 2022 cost of living index in Richton Park: 99.6 (near average, U.S. average is 100)
Percentage of residents living in poverty in 2022: 9.7%
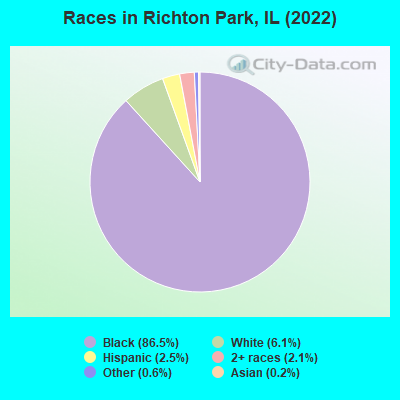
(19.6% for White Non-Hispanic residents, 8.3% for Black residents, 11.6% for Hispanic or Latino residents, 5.1% for other race residents, 42.8% for two or more races residents)
According to our research of Illinois and other state lists, there were 14 registered sex offenders living in Richton Park, Illinois as of June 16, 2024. The ratio of all residents to sex offenders in Richton Park is 972 to 1. The ratio of registered sex offenders to all residents in this city is lower than the state average.
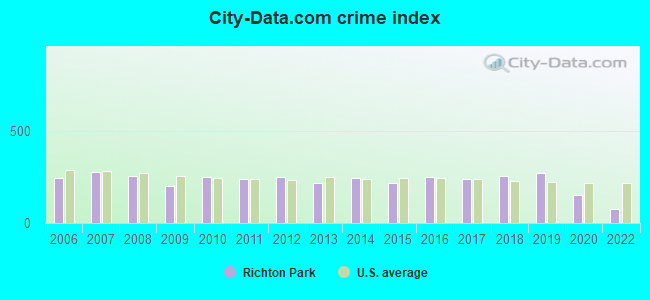
Crime rates in Richton Park by year
Type
2009
2010
2011
2012
2013
2014
2015
2016
2017
2018
2019
2020
2022
Murders (per 100,000)
1 (7.8)
0 (0.0)
0 (0.0)
0 (0.0)
0 (0.0)
2 (14.5)
0 (0.0)
0 (0.0)
0 (0.0)
0 (0.0)
0 (0.0)
1 (7.5)
0 (0.0)
Rapes (per 100,000)
0 (0.0)
7 (51.3)
6 (43.8)
7 (51.1)
4 (29.1)
3 (21.8)
7 (50.8)
7 (51.1)
6 (44.3)
7 (51.9)
13 (97.2)
5 (37.7)
2 (16.3)
Robberies (per 100,000)
13 (101.0)
17 (124.6)
28 (204.6)
22 (160.5)
19 (138.0)
26 (188.5)
25 (181.5)
36 (262.7)
23 (169.8)
27 (200.2)
21 (157.0)
8 (60.4)
5 (40.8)
Assaults (per 100,000)
6 (46.6)
11 (80.6)
10 (73.1)
18 (131.3)
19 (138.0)
18 (130.5)
7 (50.8)
15 (109.5)
12 (88.6)
21 (155.7)
26 (194.4)
25 (188.7)
5 (40.8)
Burglaries (per 100,000)
106 (823.4)
135 (989.3)
112 (818.3)
118 (860.6)
85 (617.4)
82 (594.5)
57 (413.8)
46 (335.7)
60 (443.1)
40 (296.6)
35 (261.7)
14 (105.7)
11 (89.7)
Thefts (per 100,000)
228 (1,771)
205 (1,502)
207 (1,512)
213 (1,553)
243 (1,765)
220 (1,595)
233 (1,691)
220 (1,606)
269 (1,986)
235 (1,743)
227 (1,697)
84 (634.0)
56 (456.8)
Auto thefts (per 100,000)
29 (225.3)
45 (329.8)
19 (138.8)
22 (160.5)
17 (123.5)
24 (174.0)
25 (181.5)
33 (240.8)
40 (295.4)
56 (415.3)
33 (246.7)
32 (241.5)
30 (244.7)
Arson (per 100,000)
1 (7.8)
0 (0.0)
1 (7.3)
2 (14.6)
0 (0.0)
0 (0.0)
0 (0.0)
0 (0.0)
2 (14.8)
0 (0.0)
0 (0.0)
0 (0.0)
0 (0.0)
City-Data.com crime index
201.7
250.3
239.9
250.5
215.9
248.4
216.4
248.6
238.2
256.4
269.7
153.2
77.6
The City-Data.com crime index weighs serious crimes and violent crimes more heavily. Higher means more crime, U.S. average is 246.1. It adjusts for the number of visitors and daily workers commuting into cities.
Latest news from Richton Park, IL collected exclusively by city-data.com from local newspapers, TV, and radio stations
Ancestries: German (2.0%), African (1.6%), Nigerian (1.5%), American (1.0%).
Current Local Time: CST time zone
Incorporated on 09/01/1926
Elevation: 710 feet
Land area: 3.37 square miles.
Population density: 3,687 people per square mile (average).
329 residents are foreign born (1.7% Africa, 0.4% Latin America, 0.3% North America).
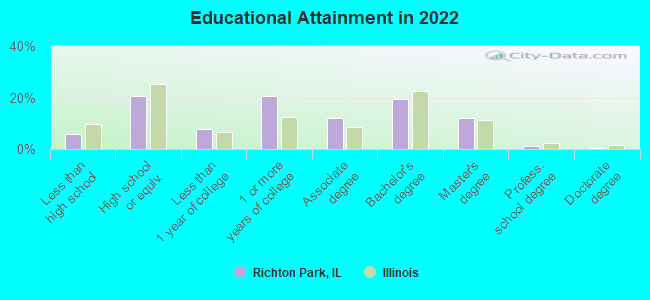
This village:
2.6%
Illinois:
14.1%
Median real estate property taxes paid for housing units with mortgages in 2022: $5,755 (3.0%) Median real estate property taxes paid for housing units with no mortgage in 2022: $4,798 (2.8%)
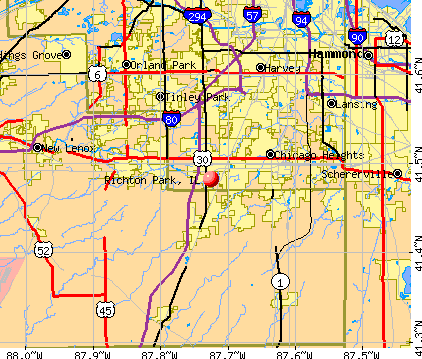
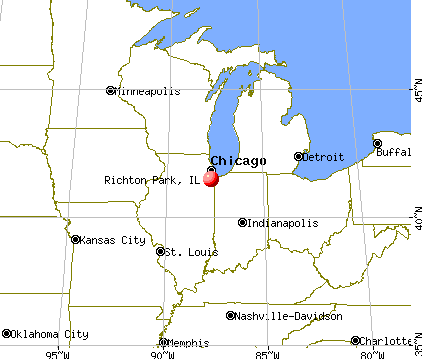
Nearest city with pop. 50,000+: Orland Park, IL (11.2 miles , pop. 51,077).
Nearest city with pop. 200,000+: Chicago, IL (24.9 miles , pop. 2,896,016).
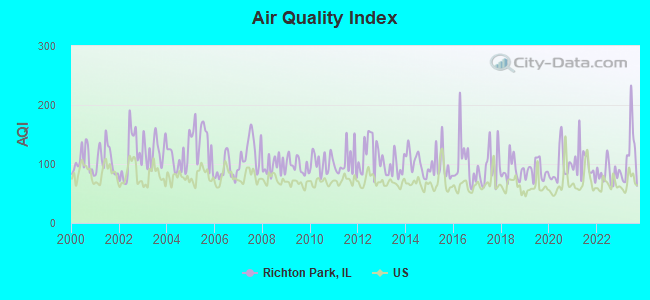
Air Quality Index (AQI) level in 2023 was 114. This is significantly worse than average.
City:
114
U.S.:
73
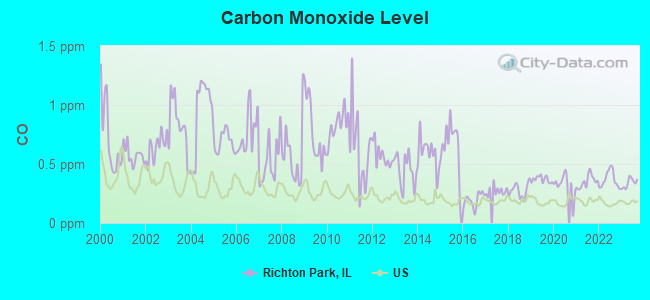
Carbon Monoxide (CO) [ppm] level in 2023 was 0.339. This is worse than average.Closest monitor was 4.7 miles away from the city center.
City:
0.339
U.S.:
0.251
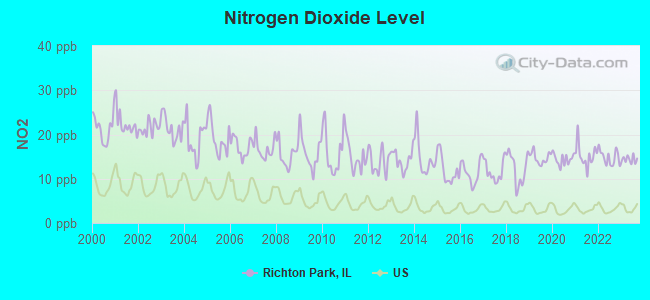
Nitrogen Dioxide (NO2) [ppb] level in 2023 was 14.4. This is significantly worse than average.Closest monitor was 3.4 miles away from the city center.
City:
14.4
U.S.:
5.1
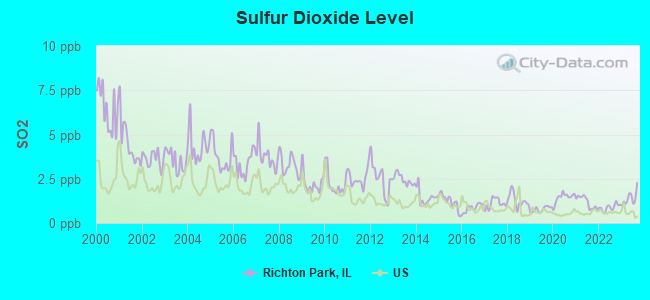
Sulfur Dioxide (SO2) [ppb] level in 2023 was 1.39. This is about average.Closest monitor was 3.4 miles away from the city center.
City:
1.39
U.S.:
1.51
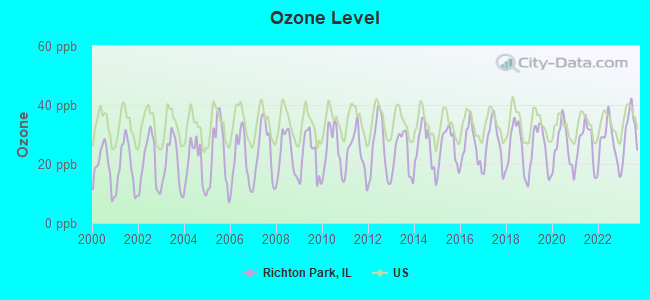
Ozone [ppb] level in 2023 was 31.3. This is about average.Closest monitor was 4.7 miles away from the city center.
City:
31.3
U.S.:
33.3
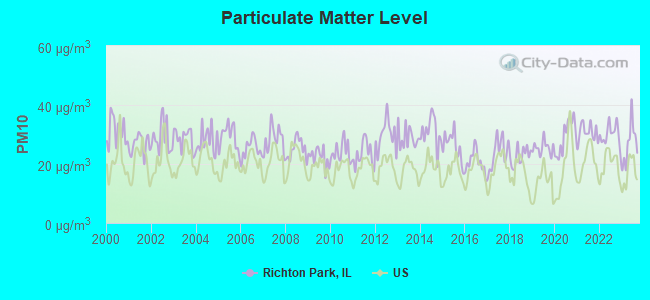
Particulate Matter (PM10) [µg/m3] level in 2023 was 26.7. This is worse than average.Closest monitor was 9.2 miles away from the city center.
City:
26.7
U.S.:
19.2
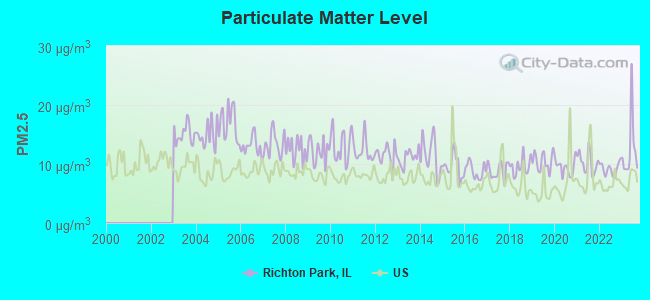
Particulate Matter (PM2.5) [µg/m3] level in 2023 was 12.4. This is significantly worse than average.Closest monitor was 11.0 miles away from the city center.
City:
12.4
U.S.:
8.1
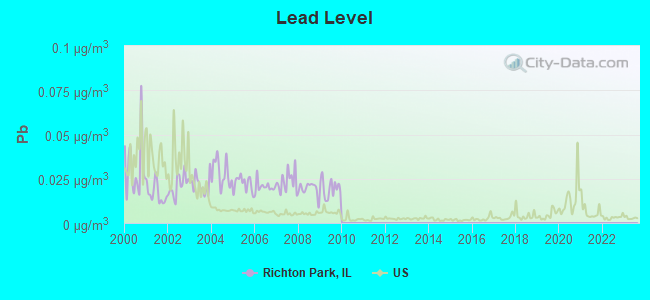
Lead (Pb) [µg/m3] level in 2009 was 0.0196. This is significantly worse than average.Closest monitor was 3.4 miles away from the city center.
City:
0.0196
U.S.:
0.0093
Tornado activity:
Richton Park-area historical tornado activity is near Illinois state average. It is 64% greater than the overall U.S. average.
On 8/28/1990, a category F5 (max. wind speeds 261-318 mph) tornado 19.6 miles away from the Richton Park village center killed 29 peopleand injured 350 peopleand causedbetween $50,000 and $500,000 in damages.
On 4/21/1967, a category F4 (max. wind speeds 207-260 mph) tornado 14.1 miles away from the village center killed 33 peopleand injured 500 peopleand causedbetween $5,000,000 and $50,000,000 in damages.
Earthquake activity:
Richton Park-area historical earthquake activity is significantly above Illinois state average. It is 49% greater than the overall U.S. average.
On 4/18/2008 at 09:36:59, a magnitude 5.4 (5.1 MB, 4.8 MS, 5.4 MW, 5.2 MW, Class: Moderate, Intensity: VI - VII) earthquake occurred 209.7 miles away from the city center On 6/10/1987 at 23:48:54, a magnitude 5.1 (4.9 MB, 4.4 MS, 4.6 MS, 5.1 LG) earthquake occurred 184.2 miles away from the city center On 4/18/2008 at 09:36:59, a magnitude 5.2 (5.2 MW, Depth: 8.9 mi) earthquake occurred 209.8 miles away from Richton Park center On 6/28/2004 at 06:10:52, a magnitude 4.2 (4.2 MW, Depth: 6.2 mi, Class: Light, Intensity: IV - V) earthquake occurred 60.9 miles away from Richton Park center On 6/18/2002 at 17:37:15, a magnitude 5.0 (4.3 MB, 4.6 MW, 5.0 LG) earthquake occurred 241.8 miles away from Richton Park center On 4/18/2008 at 15:14:16, a magnitude 4.8 (4.5 MB, 4.8 MW, 4.6 MW) earthquake occurred 208.0 miles away from the city center Magnitude types: regional Lg-wave magnitude (LG), body-wave magnitude (MB), surface-wave magnitude (MS), moment magnitude (MW)
Natural disasters:
The number of natural disasters in Cook County (20) is greater than the US average (15). Major Disasters (Presidential) Declared: 15 Emergencies Declared: 4
Causes of natural disasters: Floods: 13, Storms: 12, Tornadoes: 3, Snowstorms: 2, Winter Storms: 2, Blizzard: 1, Hurricane: 1, Snow: 1, Wind: 1, Other: 1 (Note: some incidents may be assigned to more than one category).
Hospitals and medical centers in Richton Park:
GLENSHIRE NURSING AND REHAB CTRE (22660 SOUTH CICERO AVENUE)
RICHTON CROSSING CONVALESCENT CENTER (P O BOX 345)
Other hospitals and medical centers near Richton Park:
HEALTHY HEALTH HOME HEALTH, INC (Home Health Center, about 2 miles away; MATTESON, IL)
QUANTUM HEALTHCARE SERVICES, INC (Home Health Center, about 2 miles away; MATTESON, IL)
ABSOLUTE HOME HEALTHCARE, INC (Home Health Center, about 2 miles away; MATTESON, IL)
APPLEWOOD REHABILITATION CENTER (Nursing Home, about 2 miles away; MATTESON, IL)
VITAS CORPORATION (Hospital, about 2 miles away; MATTESON, IL)
COMET HOME HEALTHCARE, INC (Home Health Center, about 2 miles away; MATTESON, IL)
MARI HOME HEALTHCARE SERVICES, LLC (Home Health Center, about 2 miles away; MATTESON, IL)
Amtrak stations near Richton Park:
7 miles: HOMEWOOD (181 1ST ST. & PARK AVE.) . Services: ticket office, enclosed waiting area, public restrooms, public payphones, paid short-term parking, paid long-term parking, public transit connection.
RICHTON PARK PUBLIC LIBRARY DISTRICT (Operating income: $705,528; Location: 4045 SAUK TRAIL; 43,239 books; 2,773 audio materials; 1,362 video materials; 4 local licensed databases; 2 state licensed databases; 168 print serial subscriptions)
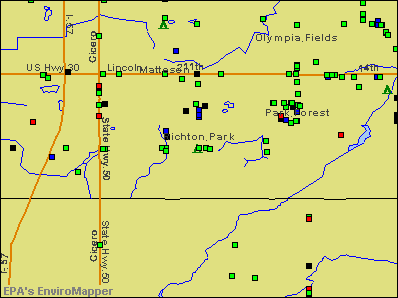
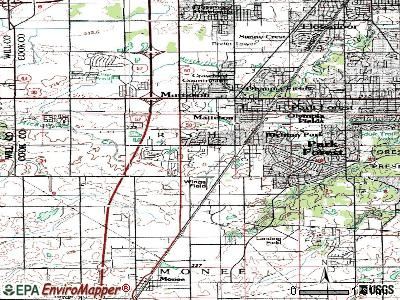
Notable locations in Richton Park: Sinter Metals Industrial Park (A), Richton Park Metrorail Station (B), Richton Park Public Library (C), Richton Park Fire Department Station 1 (D), Richton Park Fire Department (E). Display/hide their locations on the map
Churches in Richton Park include: Christ Church (A), Christian Fellowship Church (B), House of Prayer Ministry (C), Immanuel Evangelical Lutheran Church (D), Sauk Trail Baptist Temple (E), South Suburban Seventh Day Adventist Church (F). Display/hide their locations on the map
Birthplace of: Brandon Cole - College basketball player (Xavier Musketeers).
Cook County has a predicted average indoor radon screening level between 2 and 4 pCi/L (pico curies per liter) - Moderate Potential
Average household size:
This village:
2.7 people
Illinois:
2.6 people
Percentage of family households:
This village:
69.7%
Whole state:
65.8%
Percentage of households with unmarried partners:
This village:
4.9%
Whole state:
6.3%
Likely homosexual households (counted as self-reported same-sex unmarried-partner households)
Lesbian couples: 0.3% of all households
Gay men: 0.2% of all households
216 people in nursing facilities/skilled-nursing facilities in 2010
258 people in nursing homes in 2000
Banks with branches in Richton Park (2011 data):
RBS Citizens, National Association: Richton Park Facility at 22222 S. Governors Hwy., branch established on 1979/01/29. Info updated 2007/09/19: Bank assets: $106,940.6 mil, Deposits: $75,690.2 mil, headquarters in Providence, RI, positive income, 1135 total offices, Holding Company: Uk Financial Investments Limited
Religion statistics for Richton Park, IL (based on Cook County data)
Religion
Adherents
Congregations
Catholic
1,947,223
376
Evangelical Protestant
432,975
1,484
Other
312,636
403
Mainline Protestant
202,114
630
Black Protestant
148,895
395
Orthodox
53,276
66
None
2,097,556
-
Source: Clifford Grammich, Kirk Hadaway, Richard Houseal, Dale E.Jones, Alexei Krindatch, Richie Stanley and Richard H.Taylor. 2012. 2010 U.S.Religion Census: Religious Congregations & Membership Study. Association of Statisticians of American Religious Bodies. Jones, Dale E., et al. 2002. Congregations and Membership in the United States 2000. Nashville, TN: Glenmary Research Center. Graphs represent county-level data
SAUK TR BOOSTER, 5400 Sauk Trail (Lat: 41.484750 Lon: -87.747278), Type: Pole, Structure height: 4.6 m, Call Sign: WRAX768, Assigned Frequencies: 173.225 MHz, Grant Date: 04/05/2018, Expiration Date: 04/05/2028, Certifier: Matt Riechers, Registrant: Tri-R Systems Incorporated, 1804 E Lincoln Hwy, Dekalb, IL 60115, Phone: (815) 787-0830, Fax: (815) 787-0930, Email:
LIFT STATION, 5601 Central Ave (Lat: 41.483917 Lon: -87.752083), Type: Pole, Structure height: 6.1 m, Call Sign: WRBR210, Assigned Frequencies: 173.225 MHz, Grant Date: 05/25/2018, Expiration Date: 05/25/2028, Certifier: Matt Riechers, Registrant: Tri-R Systems Incorporated, 1804 E Lincoln Hwy, Dekalb, IL 60115, Phone: (815) 787-0830, Fax: (815) 787-0930, Email:
FCC Registered Microwave Towers:
4
Various Locations (Lat: 41.483361 Lon: -87.683361), Overall height: 6.1 m, Call Sign: WPJA470, Assigned Frequencies: 956.343 MHz, Grant Date: 10/03/1995, Expiration Date: 10/03/2000, Cancellation Date: 01/07/2001, Phone: (708) 481-8950
Rich South H.S., 5000 Sauk Trail (Lat: 41.486278 Lon: -87.737528), Type: Building, Structure height: 30.5 m, Call Sign: WQHC912, Assigned Frequencies: 22275.0 MHz, 21225.0 MHz, Grant Date: 04/11/2017, Expiration Date: 06/29/2027, Certifier: Elizabeth Creekmore, Registrant: Intelpath, 50 E 26th St., #404, Chicago, IL 60616, Phone: (312) 841-9188, Email:
CH03XC768, 5601 Sauk Trail (Lat: 41.480639 Lon: -87.751722), Type: Pole, Structure height: 29.9 m, Call Sign: WQPT641, Assigned Frequencies: 17865.0 MHz, Grant Date: 10/03/2022, Expiration Date: 08/13/2032, Cancellation Date: 05/11/2023, Certifier: Jenny Knopf, Registrant: T-Mobile Usa, Inc., 12920 Se 38th Street, Bellevue, WA 98006, Phone: (425) 383-8401, Email:
STATION, O.75 Mi Se (Lat: 41.476417 Lon: -87.716417), Overall height: 7.6 m, Call Sign: KSM26, Assigned Frequencies: 2197.60 MHz, Grant Date: 07/08/1991, Expiration Date: 07/08/1996, Cancellation Date: 05/13/1996, Phone: (316) 331-1300
FCC Registered Amateur Radio Licenses:
7
Call Sign: N9NII, Licensee ID: L00421356, Grant Date: 12/18/2012, Expiration Date: 12/18/2022, Registrant: David I Zidel, 4061 Appleby Ln, Richton Park, IL 60471
Call Sign: W9NJC, Grant Date: 06/21/1988, Expiration Date: 06/21/1998, Cancellation Date: 06/22/2000, Registrant: Melvin R Wahlert, 4846 Monterey Dr, Richton Park, IL 60471
Call Sign: W9RX, Licensee ID: L01373650, Grant Date: 02/26/2008, Expiration Date: 04/20/2018, Cancellation Date: 10/18/2017, Certifier: Orlando O Okleshen, Registrant: Orlando O Okleshen, 22637 Ridgeway Ave, Richton Park, IL 60471
Call Sign: WA9FSA, Grant Date: 05/24/1988, Expiration Date: 05/24/1998, Cancellation Date: 05/25/2000, Registrant: Robert C Olszewski, 22218 Scott Dr, Richton Park, IL 60471
Call Sign: WB9JIL, Licensee ID: L01379770, Grant Date: 01/05/2018, Expiration Date: 04/03/2028, Registrant: Joseph E Muszalski, 5135 Arquilla Drive, Richton Park, IL 60471-1517
Call Sign: WB9SVJ, Grant Date: 11/01/1996, Expiration Date: 11/01/2006, Cancellation Date: 11/04/2008, Registrant: Kathleen M Mount, 22942 Bruce Dr, Richton Park, IL 60471
Call Sign: KC9ENS, Licensee ID: L00717108, Grant Date: 07/16/2003, Expiration Date: 07/16/2013, Cancellation Date: 07/17/2015, Certifier: Gary A Mohr, Registrant: Gary A Mohr, 22249 La Tonia Lane, Richton Park, IL 60471
Home Mortgage Disclosure Act Aggregated Statistics For Year 2009 (Based on 2 partial tracts)
A) FHA, FSA/RHS & VA Home Purchase Loans
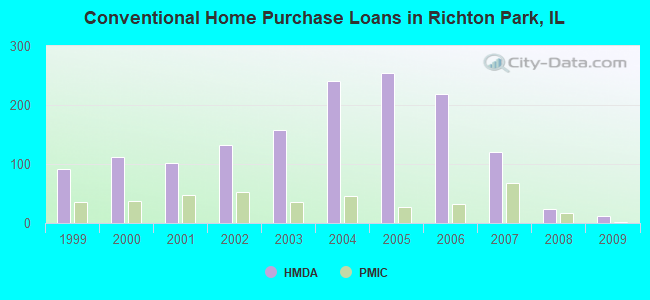
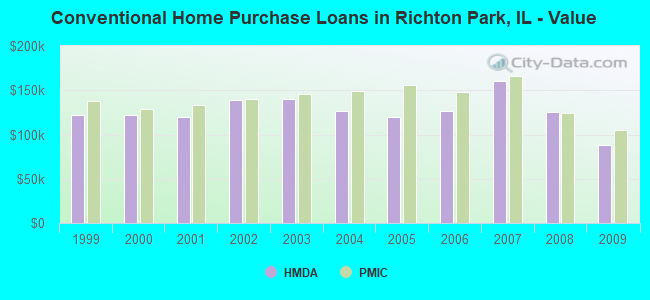
B) Conventional Home Purchase Loans
C) Refinancings
D) Home Improvement Loans
F) Non-occupant Loans on < 5 Family Dwellings (A B C & D)
G) Loans On Manufactured Home Dwelling (A B C & D)
Number
Average Value
Number
Average Value
Number
Average Value
Number
Average Value
Number
Average Value
Number
Average Value
LOANS ORIGINATED
36
$147,821
12
$87,958
84
$161,216
3
$13,920
15
$100,233
0
$0
APPLICATIONS APPROVED, NOT ACCEPTED
2
$178,710
1
$140,080
18
$144,324
1
$1,360
0
$0
0
$0
APPLICATIONS DENIED
21
$168,270
7
$112,943
73
$161,997
13
$33,302
6
$131,963
1
$108,670
APPLICATIONS WITHDRAWN
9
$158,703
2
$129,495
26
$160,196
0
$0
0
$0
0
$0
FILES CLOSED FOR INCOMPLETENESS
1
$154,470
0
$0
21
$166,966
0
$0
0
$0
0
$0
Aggregated Statistics For Year 2008 (Based on 2 partial tracts)
A) FHA, FSA/RHS & VA Home Purchase Loans
B) Conventional Home Purchase Loans
C) Refinancings
D) Home Improvement Loans
E) Loans on Dwellings For 5+ Families
F) Non-occupant Loans on < 5 Family Dwellings (A B C & D)
Number
Average Value
Number
Average Value
Number
Average Value
Number
Average Value
Number
Average Value
Number
Average Value
LOANS ORIGINATED
28
$176,184
23
$125,444
109
$158,536
9
$59,384
2
$201,480
21
$98,570
APPLICATIONS APPROVED, NOT ACCEPTED
4
$119,672
6
$156,957
19
$169,057
2
$123,920
0
$0
3
$93,760
APPLICATIONS DENIED
15
$153,812
21
$201,247
140
$183,379
29
$65,390
0
$0
13
$161,742
APPLICATIONS WITHDRAWN
3
$225,613
5
$120,916
33
$176,413
3
$72,220
0
$0
2
$123,535
FILES CLOSED FOR INCOMPLETENESS
2
$185,495
4
$153,390
14
$206,587
2
$101,570
0
$0
2
$186,815
Aggregated Statistics For Year 2007 (Based on 2 partial tracts)
A) FHA, FSA/RHS & VA Home Purchase Loans
B) Conventional Home Purchase Loans
C) Refinancings
D) Home Improvement Loans
E) Loans on Dwellings For 5+ Families
F) Non-occupant Loans on < 5 Family Dwellings (A B C & D)
Number
Average Value
Number
Average Value
Number
Average Value
Number
Average Value
Number
Average Value
Number
Average Value
LOANS ORIGINATED
8
$147,388
120
$160,176
178
$142,977
27
$64,066
1
$1,018,800
30
$101,172
APPLICATIONS APPROVED, NOT ACCEPTED
0
$0
24
$175,827
49
$167,541
3
$62,413
0
$0
6
$137,090
APPLICATIONS DENIED
4
$151,255
76
$193,199
215
$173,614
50
$49,021
0
$0
14
$117,953
APPLICATIONS WITHDRAWN
4
$132,872
21
$158,217
52
$180,306
4
$101,100
0
$0
5
$158,388
FILES CLOSED FOR INCOMPLETENESS
0
$0
9
$229,506
38
$162,485
1
$134,150
0
$0
2
$165,225
Aggregated Statistics For Year 2006 (Based on 2 partial tracts)
A) FHA, FSA/RHS & VA Home Purchase Loans
B) Conventional Home Purchase Loans
C) Refinancings
D) Home Improvement Loans
E) Loans on Dwellings For 5+ Families
F) Non-occupant Loans on < 5 Family Dwellings (A B C & D)
Number
Average Value
Number
Average Value
Number
Average Value
Number
Average Value
Number
Average Value
Number
Average Value
LOANS ORIGINATED
13
$173,668
219
$126,723
228
$146,960
24
$64,884
2
$4,002,470
42
$127,080
APPLICATIONS APPROVED, NOT ACCEPTED
3
$167,683
40
$138,767
65
$144,449
7
$98,587
0
$0
7
$105,703
APPLICATIONS DENIED
3
$173,370
121
$133,521
240
$155,698
42
$72,153
0
$0
27
$117,172
APPLICATIONS WITHDRAWN
2
$164,200
40
$124,874
114
$151,485
6
$81,273
0
$0
10
$115,322
FILES CLOSED FOR INCOMPLETENESS
0
$0
22
$125,078
46
$147,833
1
$163,010
0
$0
1
$157,010
Aggregated Statistics For Year 2005 (Based on 2 partial tracts)
A) FHA, FSA/RHS & VA Home Purchase Loans
B) Conventional Home Purchase Loans
C) Refinancings
D) Home Improvement Loans
E) Loans on Dwellings For 5+ Families
F) Non-occupant Loans on < 5 Family Dwellings (A B C & D)
G) Loans On Manufactured Home Dwelling (A B C & D)
Number
Average Value
Number
Average Value
Number
Average Value
Number
Average Value
Number
Average Value
Number
Average Value
Number
Average Value
LOANS ORIGINATED
21
$146,980
255
$120,235
272
$144,310
18
$80,007
2
$312,320
54
$103,487
0
$0
APPLICATIONS APPROVED, NOT ACCEPTED
3
$144,453
51
$120,940
59
$163,218
9
$62,486
0
$0
7
$128,410
0
$0
APPLICATIONS DENIED
5
$114,022
121
$134,550
251
$146,240
34
$69,657
0
$0
23
$117,911
1
$1,360
APPLICATIONS WITHDRAWN
1
$175,200
50
$110,390
116
$157,347
11
$163,539
0
$0
14
$103,659
0
$0
FILES CLOSED FOR INCOMPLETENESS
3
$157,483
15
$123,459
61
$149,428
3
$39,930
0
$0
4
$75,802
0
$0
Aggregated Statistics For Year 2004 (Based on 2 partial tracts)
A) FHA, FSA/RHS & VA Home Purchase Loans
B) Conventional Home Purchase Loans
C) Refinancings
D) Home Improvement Loans
E) Loans on Dwellings For 5+ Families
F) Non-occupant Loans on < 5 Family Dwellings (A B C & D)
G) Loans On Manufactured Home Dwelling (A B C & D)
Number
Average Value
Number
Average Value
Number
Average Value
Number
Average Value
Number
Average Value
Number
Average Value
Number
Average Value
LOANS ORIGINATED
25
$137,470
241
$126,690
240
$136,368
18
$71,094
3
$4,518,790
38
$95,110
0
$0
APPLICATIONS APPROVED, NOT ACCEPTED
3
$126,637
57
$127,882
63
$144,672
5
$96,292
0
$0
12
$100,419
0
$0
APPLICATIONS DENIED
9
$121,570
86
$136,722
216
$145,379
43
$59,236
0
$0
12
$125,328
1
$680
APPLICATIONS WITHDRAWN
3
$151,633
33
$136,011
97
$145,436
5
$86,164
0
$0
7
$91,626
0
$0
FILES CLOSED FOR INCOMPLETENESS
2
$111,985
15
$132,376
48
$155,738
2
$62,320
0
$0
2
$64,325
0
$0
Aggregated Statistics For Year 2003 (Based on 2 partial tracts)
A) FHA, FSA/RHS & VA Home Purchase Loans
B) Conventional Home Purchase Loans
C) Refinancings
D) Home Improvement Loans
E) Loans on Dwellings For 5+ Families
F) Non-occupant Loans on < 5 Family Dwellings (A B C & D)
Number
Average Value
Number
Average Value
Number
Average Value
Number
Average Value
Number
Average Value
Number
Average Value
LOANS ORIGINATED
33
$124,303
158
$140,402
394
$125,561
13
$40,357
3
$363,107
35
$83,733
APPLICATIONS APPROVED, NOT ACCEPTED
3
$106,763
38
$152,959
84
$134,201
1
$5,920
0
$0
5
$137,750
APPLICATIONS DENIED
10
$125,813
60
$150,154
238
$129,334
24
$26,633
0
$0
11
$99,142
APPLICATIONS WITHDRAWN
3
$118,073
27
$154,001
107
$133,087
5
$66,550
1
$141,770
6
$122,825
FILES CLOSED FOR INCOMPLETENESS
0
$0
8
$137,229
27
$123,720
0
$0
0
$0
1
$43,470
Aggregated Statistics For Year 2002 (Based on 2 partial tracts)
A) FHA, FSA/RHS & VA Home Purchase Loans
B) Conventional Home Purchase Loans
C) Refinancings
D) Home Improvement Loans
E) Loans on Dwellings For 5+ Families
F) Non-occupant Loans on < 5 Family Dwellings (A B C & D)
Number
Average Value
Number
Average Value
Number
Average Value
Number
Average Value
Number
Average Value
Number
Average Value
LOANS ORIGINATED
65
$130,952
133
$138,905
249
$120,543
12
$23,383
2
$153,835
18
$83,592
APPLICATIONS APPROVED, NOT ACCEPTED
3
$149,100
26
$164,638
46
$128,908
2
$51,840
0
$0
3
$80,253
APPLICATIONS DENIED
8
$116,810
49
$136,760
118
$131,563
16
$11,655
0
$0
6
$70,117
APPLICATIONS WITHDRAWN
8
$122,155
17
$139,231
65
$126,660
3
$35,973
0
$0
3
$88,907
FILES CLOSED FOR INCOMPLETENESS
1
$60,450
7
$134,819
52
$122,826
2
$23,065
0
$0
0
$0
Aggregated Statistics For Year 2001 (Based on 2 partial tracts)
A) FHA, FSA/RHS & VA Home Purchase Loans
B) Conventional Home Purchase Loans
C) Refinancings
D) Home Improvement Loans
E) Loans on Dwellings For 5+ Families
F) Non-occupant Loans on < 5 Family Dwellings (A B C & D)
Number
Average Value
Number
Average Value
Number
Average Value
Number
Average Value
Number
Average Value
Number
Average Value
LOANS ORIGINATED
69
$109,909
102
$119,526
195
$116,453
11
$17,035
2
$197,145
12
$70,575
APPLICATIONS APPROVED, NOT ACCEPTED
1
$147,700
22
$138,983
44
$111,244
1
$16,020
0
$0
0
$0
APPLICATIONS DENIED
7
$152,239
42
$125,607
170
$118,967
24
$24,950
0
$0
5
$98,488
APPLICATIONS WITHDRAWN
8
$139,949
19
$142,953
59
$111,771
8
$13,416
1
$6,792,000
2
$71,400
FILES CLOSED FOR INCOMPLETENESS
2
$63,285
6
$111,022
20
$121,887
0
$0
0
$0
0
$0
Aggregated Statistics For Year 2000 (Based on 2 partial tracts)
A) FHA, FSA/RHS & VA Home Purchase Loans
B) Conventional Home Purchase Loans
C) Refinancings
D) Home Improvement Loans
E) Loans on Dwellings For 5+ Families
F) Non-occupant Loans on < 5 Family Dwellings (A B C & D)
Number
Average Value
Number
Average Value
Number
Average Value
Number
Average Value
Number
Average Value
Number
Average Value
LOANS ORIGINATED
68
$110,468
112
$121,592
84
$101,981
21
$18,826
1
$150,850
7
$89,426
APPLICATIONS APPROVED, NOT ACCEPTED
3
$101,903
17
$119,945
30
$103,416
7
$18,956
0
$0
2
$44,955
APPLICATIONS DENIED
14
$121,058
68
$136,704
128
$96,862
40
$27,362
0
$0
7
$95,537
APPLICATIONS WITHDRAWN
7
$110,706
17
$127,886
45
$98,846
3
$56,307
0
$0
2
$46,975
FILES CLOSED FOR INCOMPLETENESS
2
$82,990
10
$139,124
30
$128,990
0
$0
0
$0
1
$56,290
Aggregated Statistics For Year 1999 (Based on 2 partial tracts)
A) FHA, FSA/RHS & VA Home Purchase Loans
B) Conventional Home Purchase Loans
C) Refinancings
D) Home Improvement Loans
E) Loans on Dwellings For 5+ Families
F) Non-occupant Loans on < 5 Family Dwellings (A B C & D)
Detailed PMIC statistics for the following Tracts:8300.02
, 8302.01
2002 - 2018 National Fire Incident Reporting System (NFIRS) incidents
Based on the data from the years 2002 - 2018 the average number of fires per year is 57. The highest number of reported fire incidents - 132 took place in 2003, and the least - 16 in 2006. The data has an increasing trend.
When looking into fire subcategories, the most reports belonged to: Structure Fires (65.6%), and Outside Fires (16.3%).
Fire incident types reported to NFIRS in Richton Park, IL


 Recent articles from our blog. Our writers, many of them Ph.D. graduates or candidates, create easy-to-read articles on a wide variety of topics.

 (11.2 miles


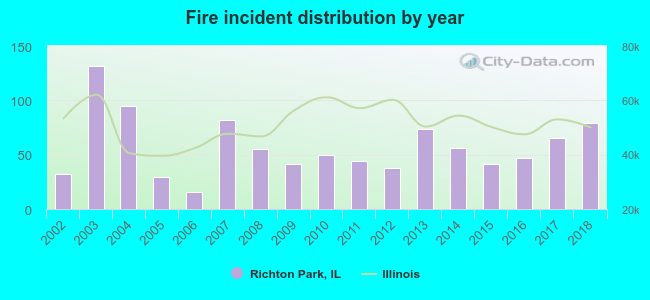 Based on the data from the years 2002 - 2018 the average number of fires per year is 57. The highest number of reported fire incidents - 132 took place in 2003, and the least - 16 in 2006. The data has an increasing trend.
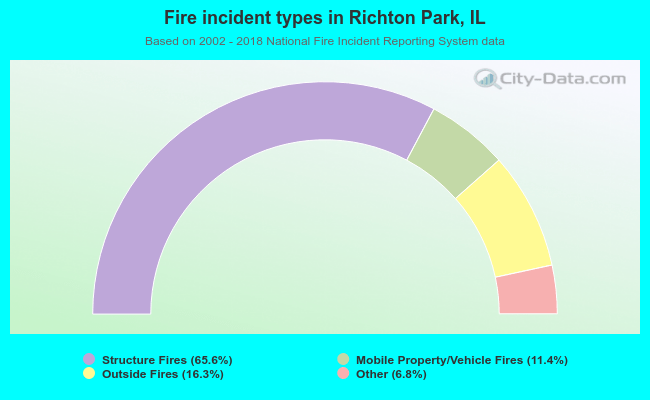 When looking into fire subcategories, the most reports belonged to: Structure Fires (65.6%), and Outside Fires (16.3%).