Seaside, California Submit your own pictures of this city and show them to the world
OSM Map
General Map
Google Map
MSN Map
OSM Map
General Map
Google Map
MSN Map
OSM Map
General Map
Google Map
MSN Map
OSM Map
General Map
Google Map
MSN Map
Please wait while loading the map...
Population in 2022: 31,478 (100% urban, 0% rural). Population change since 2000: -0.7%Males: 15,602 Females: 15,876
March 2022 cost of living index in Seaside: 111.2 (more than average, U.S. average is 100) Percentage of residents living in poverty in 2022: 13.0%for White Non-Hispanic residents , 19.3% for Black residents , 18.1% for Hispanic or Latino residents , 16.7% for American Indian residents , 9.9% for Native Hawaiian and other Pacific Islander residents , 25.3% for other race residents , 12.6% for two or more races residents )
Profiles of local businesses
Business Search - 14 Million verified businesses
Data:
Median household income ($)
Median household income (% change since 2000)
Household income diversity
Ratio of average income to average house value (%)
Ratio of average income to average rent
Median household income ($) - White
Median household income ($) - Black or African American
Median household income ($) - Asian
Median household income ($) - Hispanic or Latino
Median household income ($) - American Indian and Alaska Native
Median household income ($) - Multirace
Median household income ($) - Other Race
Median household income for houses/condos with a mortgage ($)
Median household income for apartments without a mortgage ($)
Races - White alone (%)
Races - White alone (% change since 2000)
Races - Black alone (%)
Races - Black alone (% change since 2000)
Races - American Indian alone (%)
Races - American Indian alone (% change since 2000)
Races - Asian alone (%)
Races - Asian alone (% change since 2000)
Races - Hispanic (%)
Races - Hispanic (% change since 2000)
Races - Native Hawaiian and Other Pacific Islander alone (%)
Races - Native Hawaiian and Other Pacific Islander alone (% change since 2000)
Races - Two or more races (%)
Races - Two or more races (% change since 2000)
Races - Other race alone (%)
Races - Other race alone (% change since 2000)
Racial diversity
Unemployment (%)
Unemployment (% change since 2000)
Unemployment (%) - White
Unemployment (%) - Black or African American
Unemployment (%) - Asian
Unemployment (%) - Hispanic or Latino
Unemployment (%) - American Indian and Alaska Native
Unemployment (%) - Multirace
Unemployment (%) - Other Race
Population density (people per square mile)
Population - Males (%)
Population - Females (%)
Population - Males (%) - White
Population - Males (%) - Black or African American
Population - Males (%) - Asian
Population - Males (%) - Hispanic or Latino
Population - Males (%) - American Indian and Alaska Native
Population - Males (%) - Multirace
Population - Males (%) - Other Race
Population - Females (%) - White
Population - Females (%) - Black or African American
Population - Females (%) - Asian
Population - Females (%) - Hispanic or Latino
Population - Females (%) - American Indian and Alaska Native
Population - Females (%) - Multirace
Population - Females (%) - Other Race
Coronavirus confirmed cases (Jun 16, 2024)
Deaths caused by coronavirus (Jun 16, 2024)
Coronavirus confirmed cases (per 100k population) (Jun 16, 2024)
Deaths caused by coronavirus (per 100k population) (Jun 16, 2024)
Daily increase in number of cases (Jun 16, 2024)
Weekly increase in number of cases (Jun 16, 2024)
Cases doubled (in days) (Jun 16, 2024)
Hospitalized patients (Apr 18, 2022)
Negative test results (Apr 18, 2022)
Total test results (Apr 18, 2022)
COVID Vaccine doses distributed (per 100k population) (Sep 19, 2023)
COVID Vaccine doses administered (per 100k population) (Sep 19, 2023)
COVID Vaccine doses distributed (Sep 19, 2023)
COVID Vaccine doses administered (Sep 19, 2023)
Likely homosexual households (%)
Likely homosexual households (% change since 2000)
Likely homosexual households - Lesbian couples (%)
Likely homosexual households - Lesbian couples (% change since 2000)
Likely homosexual households - Gay men (%)
Likely homosexual households - Gay men (% change since 2000)
Cost of living index
Median gross rent ($)
Median contract rent ($)
Median monthly housing costs ($)
Median house or condo value ($)
Median house or condo value ($ change since 2000)
Mean house or condo value by units in structure - 1, detached ($)
Mean house or condo value by units in structure - 1, attached ($)
Mean house or condo value by units in structure - 2 ($)
Mean house or condo value by units in structure by units in structure - 3 or 4 ($)
Mean house or condo value by units in structure - 5 or more ($)
Mean house or condo value by units in structure - Boat, RV, van, etc. ($)
Mean house or condo value by units in structure - Mobile home ($)
Median house or condo value ($) - White
Median house or condo value ($) - Black or African American
Median house or condo value ($) - Asian
Median house or condo value ($) - Hispanic or Latino
Median house or condo value ($) - American Indian and Alaska Native
Median house or condo value ($) - Multirace
Median house or condo value ($) - Other Race
Median resident age
Resident age diversity
Median resident age - Males
Median resident age - Females
Median resident age - White
Median resident age - Black or African American
Median resident age - Asian
Median resident age - Hispanic or Latino
Median resident age - American Indian and Alaska Native
Median resident age - Multirace
Median resident age - Other Race
Median resident age - Males - White
Median resident age - Males - Black or African American
Median resident age - Males - Asian
Median resident age - Males - Hispanic or Latino
Median resident age - Males - American Indian and Alaska Native
Median resident age - Males - Multirace
Median resident age - Males - Other Race
Median resident age - Females - White
Median resident age - Females - Black or African American
Median resident age - Females - Asian
Median resident age - Females - Hispanic or Latino
Median resident age - Females - American Indian and Alaska Native
Median resident age - Females - Multirace
Median resident age - Females - Other Race
Commute - mean travel time to work (minutes)
Travel time to work - Less than 5 minutes (%)
Travel time to work - Less than 5 minutes (% change since 2000)
Travel time to work - 5 to 9 minutes (%)
Travel time to work - 5 to 9 minutes (% change since 2000)
Travel time to work - 10 to 19 minutes (%)
Travel time to work - 10 to 19 minutes (% change since 2000)
Travel time to work - 20 to 29 minutes (%)
Travel time to work - 20 to 29 minutes (% change since 2000)
Travel time to work - 30 to 39 minutes (%)
Travel time to work - 30 to 39 minutes (% change since 2000)
Travel time to work - 40 to 59 minutes (%)
Travel time to work - 40 to 59 minutes (% change since 2000)
Travel time to work - 60 to 89 minutes (%)
Travel time to work - 60 to 89 minutes (% change since 2000)
Travel time to work - 90 or more minutes (%)
Travel time to work - 90 or more minutes (% change since 2000)
Marital status - Never married (%)
Marital status - Now married (%)
Marital status - Separated (%)
Marital status - Widowed (%)
Marital status - Divorced (%)
Median family income ($)
Median family income (% change since 2000)
Median non-family income ($)
Median non-family income (% change since 2000)
Median per capita income ($)
Median per capita income (% change since 2000)
Median family income ($) - White
Median family income ($) - Black or African American
Median family income ($) - Asian
Median family income ($) - Hispanic or Latino
Median family income ($) - American Indian and Alaska Native
Median family income ($) - Multirace
Median family income ($) - Other Race
Median year house/condo built
Median year apartment built
Year house built - Built 2005 or later (%)
Year house built - Built 2000 to 2004 (%)
Year house built - Built 1990 to 1999 (%)
Year house built - Built 1980 to 1989 (%)
Year house built - Built 1970 to 1979 (%)
Year house built - Built 1960 to 1969 (%)
Year house built - Built 1950 to 1959 (%)
Year house built - Built 1940 to 1949 (%)
Year house built - Built 1939 or earlier (%)
Average household size
Household density (households per square mile)
Average household size - White
Average household size - Black or African American
Average household size - Asian
Average household size - Hispanic or Latino
Average household size - American Indian and Alaska Native
Average household size - Multirace
Average household size - Other Race
Occupied housing units (%)
Vacant housing units (%)
Owner occupied housing units (%)
Renter occupied housing units (%)
Vacancy status - For rent (%)
Vacancy status - For sale only (%)
Vacancy status - Rented or sold, not occupied (%)
Vacancy status - For seasonal, recreational, or occasional use (%)
Vacancy status - For migrant workers (%)
Vacancy status - Other vacant (%)
Residents with income below the poverty level (%)
Residents with income below 50% of the poverty level (%)
Children below poverty level (%)
Poor families by family type - Married-couple family (%)
Poor families by family type - Male, no wife present (%)
Poor families by family type - Female, no husband present (%)
Poverty status for native-born residents (%)
Poverty status for foreign-born residents (%)
Poverty among high school graduates not in families (%)
Poverty among people who did not graduate high school not in families (%)
Residents with income below the poverty level (%) - White
Residents with income below the poverty level (%) - Black or African American
Residents with income below the poverty level (%) - Asian
Residents with income below the poverty level (%) - Hispanic or Latino
Residents with income below the poverty level (%) - American Indian and Alaska Native
Residents with income below the poverty level (%) - Multirace
Residents with income below the poverty level (%) - Other Race
Air pollution - Air Quality Index (AQI)
Air pollution - CO
Air pollution - NO2
Air pollution - SO2
Air pollution - Ozone
Air pollution - PM10
Air pollution - PM25
Air pollution - Pb
Crime - Murders per 100,000 population
Crime - Rapes per 100,000 population
Crime - Robberies per 100,000 population
Crime - Assaults per 100,000 population
Crime - Burglaries per 100,000 population
Crime - Thefts per 100,000 population
Crime - Auto thefts per 100,000 population
Crime - Arson per 100,000 population
Crime - City-data.com crime index
Crime - Violent crime index
Crime - Property crime index
Crime - Murders per 100,000 population (5 year average)
Crime - Rapes per 100,000 population (5 year average)
Crime - Robberies per 100,000 population (5 year average)
Crime - Assaults per 100,000 population (5 year average)
Crime - Burglaries per 100,000 population (5 year average)
Crime - Thefts per 100,000 population (5 year average)
Crime - Auto thefts per 100,000 population (5 year average)
Crime - Arson per 100,000 population (5 year average)
Crime - City-data.com crime index (5 year average)
Crime - Violent crime index (5 year average)
Crime - Property crime index (5 year average)
1996 Presidential Elections Results (%) - Democratic Party (Clinton)
1996 Presidential Elections Results (%) - Republican Party (Dole)
1996 Presidential Elections Results (%) - Other
2000 Presidential Elections Results (%) - Democratic Party (Gore)
2000 Presidential Elections Results (%) - Republican Party (Bush)
2000 Presidential Elections Results (%) - Other
2004 Presidential Elections Results (%) - Democratic Party (Kerry)
2004 Presidential Elections Results (%) - Republican Party (Bush)
2004 Presidential Elections Results (%) - Other
2008 Presidential Elections Results (%) - Democratic Party (Obama)
2008 Presidential Elections Results (%) - Republican Party (McCain)
2008 Presidential Elections Results (%) - Other
2012 Presidential Elections Results (%) - Democratic Party (Obama)
2012 Presidential Elections Results (%) - Republican Party (Romney)
2012 Presidential Elections Results (%) - Other
2016 Presidential Elections Results (%) - Democratic Party (Clinton)
2016 Presidential Elections Results (%) - Republican Party (Trump)
2016 Presidential Elections Results (%) - Other
2020 Presidential Elections Results (%) - Democratic Party (Biden)
2020 Presidential Elections Results (%) - Republican Party (Trump)
2020 Presidential Elections Results (%) - Other
Ancestries Reported - Arab (%)
Ancestries Reported - Czech (%)
Ancestries Reported - Danish (%)
Ancestries Reported - Dutch (%)
Ancestries Reported - English (%)
Ancestries Reported - French (%)
Ancestries Reported - French Canadian (%)
Ancestries Reported - German (%)
Ancestries Reported - Greek (%)
Ancestries Reported - Hungarian (%)
Ancestries Reported - Irish (%)
Ancestries Reported - Italian (%)
Ancestries Reported - Lithuanian (%)
Ancestries Reported - Norwegian (%)
Ancestries Reported - Polish (%)
Ancestries Reported - Portuguese (%)
Ancestries Reported - Russian (%)
Ancestries Reported - Scotch-Irish (%)
Ancestries Reported - Scottish (%)
Ancestries Reported - Slovak (%)
Ancestries Reported - Subsaharan African (%)
Ancestries Reported - Swedish (%)
Ancestries Reported - Swiss (%)
Ancestries Reported - Ukrainian (%)
Ancestries Reported - United States (%)
Ancestries Reported - Welsh (%)
Ancestries Reported - West Indian (%)
Ancestries Reported - Other (%)
Educational Attainment - No schooling completed (%)
Educational Attainment - Less than high school (%)
Educational Attainment - High school or equivalent (%)
Educational Attainment - Less than 1 year of college (%)
Educational Attainment - 1 or more years of college (%)
Educational Attainment - Associate degree (%)
Educational Attainment - Bachelor's degree (%)
Educational Attainment - Master's degree (%)
Educational Attainment - Professional school degree (%)
Educational Attainment - Doctorate degree (%)
School Enrollment - Nursery, preschool (%)
School Enrollment - Kindergarten (%)
School Enrollment - Grade 1 to 4 (%)
School Enrollment - Grade 5 to 8 (%)
School Enrollment - Grade 9 to 12 (%)
School Enrollment - College undergrad (%)
School Enrollment - Graduate or professional (%)
School Enrollment - Not enrolled in school (%)
School enrollment - Public schools (%)
School enrollment - Private schools (%)
School enrollment - Not enrolled (%)
Median number of rooms in houses and condos
Median number of rooms in apartments
Housing units lacking complete plumbing facilities (%)
Housing units lacking complete kitchen facilities (%)
Density of houses
Urban houses (%)
Rural houses (%)
Households with people 60 years and over (%)
Households with people 65 years and over (%)
Households with people 75 years and over (%)
Households with one or more nonrelatives (%)
Households with no nonrelatives (%)
Population in households (%)
Family households (%)
Nonfamily households (%)
Population in families (%)
Family households with own children (%)
Median number of bedrooms in owner occupied houses
Mean number of bedrooms in owner occupied houses
Median number of bedrooms in renter occupied houses
Mean number of bedrooms in renter occupied houses
Median number of vehichles in owner occupied houses
Mean number of vehichles in owner occupied houses
Median number of vehichles in renter occupied houses
Mean number of vehichles in renter occupied houses
Mortgage status - with mortgage (%)
Mortgage status - with second mortgage (%)
Mortgage status - with home equity loan (%)
Mortgage status - with both second mortgage and home equity loan (%)
Mortgage status - without a mortgage (%)
Average family size
Average family size - White
Average family size - Black or African American
Average family size - Asian
Average family size - Hispanic or Latino
Average family size - American Indian and Alaska Native
Average family size - Multirace
Average family size - Other Race
Geographical mobility - Same house 1 year ago (%)
Geographical mobility - Moved within same county (%)
Geographical mobility - Moved from different county within same state (%)
Geographical mobility - Moved from different state (%)
Geographical mobility - Moved from abroad (%)
Place of birth - Born in state of residence (%)
Place of birth - Born in other state (%)
Place of birth - Native, outside of US (%)
Place of birth - Foreign born (%)
Housing units in structures - 1, detached (%)
Housing units in structures - 1, attached (%)
Housing units in structures - 2 (%)
Housing units in structures - 3 or 4 (%)
Housing units in structures - 5 to 9 (%)
Housing units in structures - 10 to 19 (%)
Housing units in structures - 20 to 49 (%)
Housing units in structures - 50 or more (%)
Housing units in structures - Mobile home (%)
Housing units in structures - Boat, RV, van, etc. (%)
House/condo owner moved in on average (years ago)
Renter moved in on average (years ago)
Year householder moved into unit - Moved in 1999 to March 2000 (%)
Year householder moved into unit - Moved in 1995 to 1998 (%)
Year householder moved into unit - Moved in 1990 to 1994 (%)
Year householder moved into unit - Moved in 1980 to 1989 (%)
Year householder moved into unit - Moved in 1970 to 1979 (%)
Year householder moved into unit - Moved in 1969 or earlier (%)
Means of transportation to work - Drove car alone (%)
Means of transportation to work - Carpooled (%)
Means of transportation to work - Public transportation (%)
Means of transportation to work - Bus or trolley bus (%)
Means of transportation to work - Streetcar or trolley car (%)
Means of transportation to work - Subway or elevated (%)
Means of transportation to work - Railroad (%)
Means of transportation to work - Ferryboat (%)
Means of transportation to work - Taxicab (%)
Means of transportation to work - Motorcycle (%)
Means of transportation to work - Bicycle (%)
Means of transportation to work - Walked (%)
Means of transportation to work - Other means (%)
Working at home (%)
Industry diversity
Most Common Industries - Agriculture, forestry, fishing and hunting, and mining (%)
Most Common Industries - Agriculture, forestry, fishing and hunting (%)
Most Common Industries - Mining, quarrying, and oil and gas extraction (%)
Most Common Industries - Construction (%)
Most Common Industries - Manufacturing (%)
Most Common Industries - Wholesale trade (%)
Most Common Industries - Retail trade (%)
Most Common Industries - Transportation and warehousing, and utilities (%)
Most Common Industries - Transportation and warehousing (%)
Most Common Industries - Utilities (%)
Most Common Industries - Information (%)
Most Common Industries - Finance and insurance, and real estate and rental and leasing (%)
Most Common Industries - Finance and insurance (%)
Most Common Industries - Real estate and rental and leasing (%)
Most Common Industries - Professional, scientific, and management, and administrative and waste management services (%)
Most Common Industries - Professional, scientific, and technical services (%)
Most Common Industries - Management of companies and enterprises (%)
Most Common Industries - Administrative and support and waste management services (%)
Most Common Industries - Educational services, and health care and social assistance (%)
Most Common Industries - Educational services (%)
Most Common Industries - Health care and social assistance (%)
Most Common Industries - Arts, entertainment, and recreation, and accommodation and food services (%)
Most Common Industries - Arts, entertainment, and recreation (%)
Most Common Industries - Accommodation and food services (%)
Most Common Industries - Other services, except public administration (%)
Most Common Industries - Public administration (%)
Occupation diversity
Most Common Occupations - Management, business, science, and arts occupations (%)
Most Common Occupations - Management, business, and financial occupations (%)
Most Common Occupations - Management occupations (%)
Most Common Occupations - Business and financial operations occupations (%)
Most Common Occupations - Computer, engineering, and science occupations (%)
Most Common Occupations - Computer and mathematical occupations (%)
Most Common Occupations - Architecture and engineering occupations (%)
Most Common Occupations - Life, physical, and social science occupations (%)
Most Common Occupations - Education, legal, community service, arts, and media occupations (%)
Most Common Occupations - Community and social service occupations (%)
Most Common Occupations - Legal occupations (%)
Most Common Occupations - Education, training, and library occupations (%)
Most Common Occupations - Arts, design, entertainment, sports, and media occupations (%)
Most Common Occupations - Healthcare practitioners and technical occupations (%)
Most Common Occupations - Health diagnosing and treating practitioners and other technical occupations (%)
Most Common Occupations - Health technologists and technicians (%)
Most Common Occupations - Service occupations (%)
Most Common Occupations - Healthcare support occupations (%)
Most Common Occupations - Protective service occupations (%)
Most Common Occupations - Fire fighting and prevention, and other protective service workers including supervisors (%)
Most Common Occupations - Law enforcement workers including supervisors (%)
Most Common Occupations - Food preparation and serving related occupations (%)
Most Common Occupations - Building and grounds cleaning and maintenance occupations (%)
Most Common Occupations - Personal care and service occupations (%)
Most Common Occupations - Sales and office occupations (%)
Most Common Occupations - Sales and related occupations (%)
Most Common Occupations - Office and administrative support occupations (%)
Most Common Occupations - Natural resources, construction, and maintenance occupations (%)
Most Common Occupations - Farming, fishing, and forestry occupations (%)
Most Common Occupations - Construction and extraction occupations (%)
Most Common Occupations - Installation, maintenance, and repair occupations (%)
Most Common Occupations - Production, transportation, and material moving occupations (%)
Most Common Occupations - Production occupations (%)
Most Common Occupations - Transportation occupations (%)
Most Common Occupations - Material moving occupations (%)
People in Group quarters - Institutionalized population (%)
People in Group quarters - Correctional institutions (%)
People in Group quarters - Federal prisons and detention centers (%)
People in Group quarters - Halfway houses (%)
People in Group quarters - Local jails and other confinement facilities (including police lockups) (%)
People in Group quarters - Military disciplinary barracks (%)
People in Group quarters - State prisons (%)
People in Group quarters - Other types of correctional institutions (%)
People in Group quarters - Nursing homes (%)
People in Group quarters - Hospitals/wards, hospices, and schools for the handicapped (%)
People in Group quarters - Hospitals/wards and hospices for chronically ill (%)
People in Group quarters - Hospices or homes for chronically ill (%)
People in Group quarters - Military hospitals or wards for chronically ill (%)
People in Group quarters - Other hospitals or wards for chronically ill (%)
People in Group quarters - Hospitals or wards for drug/alcohol abuse (%)
People in Group quarters - Mental (Psychiatric) hospitals or wards (%)
People in Group quarters - Schools, hospitals, or wards for the mentally retarded (%)
People in Group quarters - Schools, hospitals, or wards for the physically handicapped (%)
People in Group quarters - Institutions for the deaf (%)
People in Group quarters - Institutions for the blind (%)
People in Group quarters - Orthopedic wards and institutions for the physically handicapped (%)
People in Group quarters - Wards in general hospitals for patients who have no usual home elsewhere (%)
People in Group quarters - Wards in military hospitals for patients who have no usual home elsewhere (%)
People in Group quarters - Juvenile institutions (%)
People in Group quarters - Long-term care (%)
People in Group quarters - Homes for abused, dependent, and neglected children (%)
People in Group quarters - Residential treatment centers for emotionally disturbed children (%)
People in Group quarters - Training schools for juvenile delinquents (%)
People in Group quarters - Short-term care, detention or diagnostic centers for delinquent children (%)
People in Group quarters - Type of juvenile institution unknown (%)
People in Group quarters - Noninstitutionalized population (%)
People in Group quarters - College dormitories (includes college quarters off campus) (%)
People in Group quarters - Military quarters (%)
People in Group quarters - On base (%)
People in Group quarters - Barracks, unaccompanied personnel housing (UPH), (Enlisted/Officer), ;and similar group living quarters for military personnel (%)
People in Group quarters - Transient quarters for temporary residents (%)
People in Group quarters - Military ships (%)
People in Group quarters - Group homes (%)
People in Group quarters - Homes or halfway houses for drug/alcohol abuse (%)
People in Group quarters - Homes for the mentally ill (%)
People in Group quarters - Homes for the mentally retarded (%)
People in Group quarters - Homes for the physically handicapped (%)
People in Group quarters - Other group homes (%)
People in Group quarters - Religious group quarters (%)
People in Group quarters - Dormitories (%)
People in Group quarters - Agriculture workers' dormitories on farms (%)
People in Group quarters - Job Corps and vocational training facilities (%)
People in Group quarters - Other workers' dormitories (%)
People in Group quarters - Crews of maritime vessels (%)
People in Group quarters - Other nonhousehold living situations (%)
People in Group quarters - Other noninstitutional group quarters (%)
Residents speaking English at home (%)
Residents speaking English at home - Born in the United States (%)
Residents speaking English at home - Native, born elsewhere (%)
Residents speaking English at home - Foreign born (%)
Residents speaking Spanish at home (%)
Residents speaking Spanish at home - Born in the United States (%)
Residents speaking Spanish at home - Native, born elsewhere (%)
Residents speaking Spanish at home - Foreign born (%)
Residents speaking other language at home (%)
Residents speaking other language at home - Born in the United States (%)
Residents speaking other language at home - Native, born elsewhere (%)
Residents speaking other language at home - Foreign born (%)
Class of Workers - Employee of private company (%)
Class of Workers - Self-employed in own incorporated business (%)
Class of Workers - Private not-for-profit wage and salary workers (%)
Class of Workers - Local government workers (%)
Class of Workers - State government workers (%)
Class of Workers - Federal government workers (%)
Class of Workers - Self-employed workers in own not incorporated business and Unpaid family workers (%)
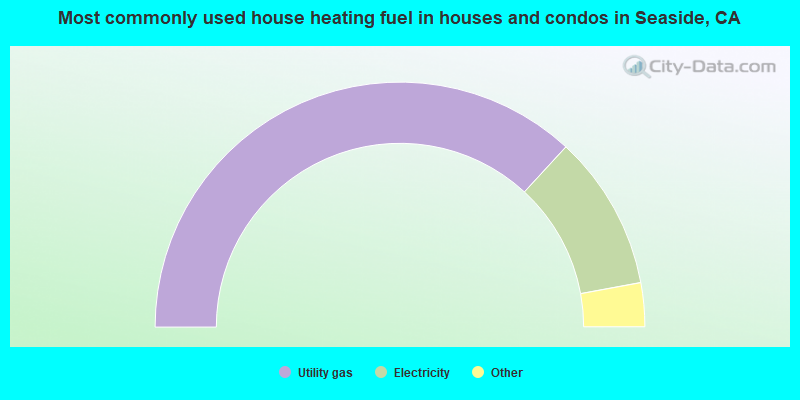
House heating fuel used in houses and condos - Utility gas (%)
House heating fuel used in houses and condos - Bottled, tank, or LP gas (%)
House heating fuel used in houses and condos - Electricity (%)
House heating fuel used in houses and condos - Fuel oil, kerosene, etc. (%)
House heating fuel used in houses and condos - Coal or coke (%)
House heating fuel used in houses and condos - Wood (%)
House heating fuel used in houses and condos - Solar energy (%)
House heating fuel used in houses and condos - Other fuel (%)
House heating fuel used in houses and condos - No fuel used (%)
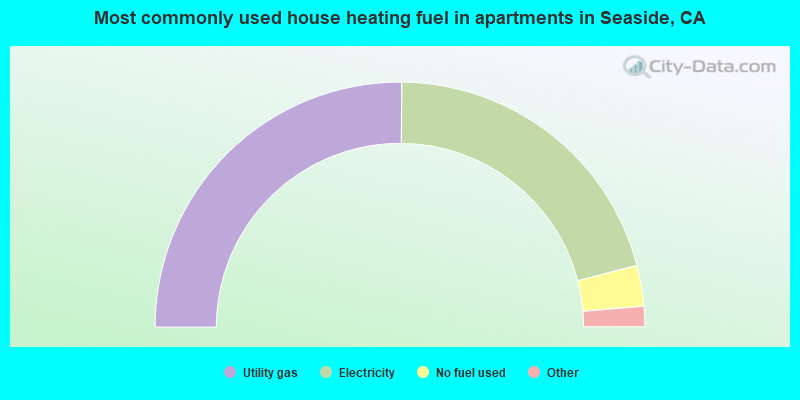
House heating fuel used in apartments - Utility gas (%)
House heating fuel used in apartments - Bottled, tank, or LP gas (%)
House heating fuel used in apartments - Electricity (%)
House heating fuel used in apartments - Fuel oil, kerosene, etc. (%)
House heating fuel used in apartments - Coal or coke (%)
House heating fuel used in apartments - Wood (%)
House heating fuel used in apartments - Solar energy (%)
House heating fuel used in apartments - Other fuel (%)
House heating fuel used in apartments - No fuel used (%)
Armed forces status - In Armed Forces (%)
Armed forces status - Civilian (%)
Armed forces status - Civilian - Veteran (%)
Armed forces status - Civilian - Nonveteran (%)
Fatal accidents locations in years 2005-2021
Fatal accidents locations in 2005
Fatal accidents locations in 2006
Fatal accidents locations in 2007
Fatal accidents locations in 2008
Fatal accidents locations in 2009
Fatal accidents locations in 2010
Fatal accidents locations in 2011
Fatal accidents locations in 2012
Fatal accidents locations in 2013
Fatal accidents locations in 2014
Fatal accidents locations in 2015
Fatal accidents locations in 2016
Fatal accidents locations in 2017
Fatal accidents locations in 2018
Fatal accidents locations in 2019
Fatal accidents locations in 2020
Fatal accidents locations in 2021
Alcohol use - People drinking some alcohol every month (%)
Alcohol use - People not drinking at all (%)
Alcohol use - Average days/month drinking alcohol
Alcohol use - Average drinks/week
Alcohol use - Average days/year people drink much
Audiometry - Average condition of hearing (%)
Audiometry - People that can hear a whisper from across a quiet room (%)
Audiometry - People that can hear normal voice from across a quiet room (%)
Audiometry - Ears ringing, roaring, buzzing (%)
Audiometry - Had a job exposure to loud noise (%)
Audiometry - Had off-work exposure to loud noise (%)
Blood Pressure & Cholesterol - Has high blood pressure (%)
Blood Pressure & Cholesterol - Checking blood pressure at home (%)
Blood Pressure & Cholesterol - Frequently checking blood cholesterol (%)
Blood Pressure & Cholesterol - Has high cholesterol level (%)
Consumer Behavior - Money monthly spent on food at supermarket/grocery store
Consumer Behavior - Money monthly spent on food at other stores
Consumer Behavior - Money monthly spent on eating out
Consumer Behavior - Money monthly spent on carryout/delivered foods
Consumer Behavior - Income spent on food at supermarket/grocery store (%)
Consumer Behavior - Income spent on food at other stores (%)
Consumer Behavior - Income spent on eating out (%)
Consumer Behavior - Income spent on carryout/delivered foods (%)
Current Health Status - General health condition (%)
Current Health Status - Blood donors (%)
Current Health Status - Has blood ever tested for HIV virus (%)
Current Health Status - Left-handed people (%)
Dermatology - People using sunscreen (%)
Diabetes - Diabetics (%)
Diabetes - Had a blood test for high blood sugar (%)
Diabetes - People taking insulin (%)
Diet Behavior & Nutrition - Diet health (%)
Diet Behavior & Nutrition - Milk product consumption (# of products/month)
Diet Behavior & Nutrition - Meals not home prepared (#/week)
Diet Behavior & Nutrition - Meals from fast food or pizza place (#/week)
Diet Behavior & Nutrition - Ready-to-eat foods (#/month)
Diet Behavior & Nutrition - Frozen meals/pizza (#/month)
Drug Use - People that ever used marijuana or hashish (%)
Drug Use - Ever used hard drugs (%)
Drug Use - Ever used any form of cocaine (%)
Drug Use - Ever used heroin (%)
Drug Use - Ever used methamphetamine (%)
Health Insurance - People covered by health insurance (%)
Kidney Conditions-Urology - Avg. # of times urinating at night
Medical Conditions - People with asthma (%)
Medical Conditions - People with anemia (%)
Medical Conditions - People with psoriasis (%)
Medical Conditions - People with overweight (%)
Medical Conditions - Elderly people having difficulties in thinking or remembering (%)
Medical Conditions - People who ever received blood transfusion (%)
Medical Conditions - People having trouble seeing even with glass/contacts (%)
Medical Conditions - People with arthritis (%)
Medical Conditions - People with gout (%)
Medical Conditions - People with congestive heart failure (%)
Medical Conditions - People with coronary heart disease (%)
Medical Conditions - People with angina pectoris (%)
Medical Conditions - People who ever had heart attack (%)
Medical Conditions - People who ever had stroke (%)
Medical Conditions - People with emphysema (%)
Medical Conditions - People with thyroid problem (%)
Medical Conditions - People with chronic bronchitis (%)
Medical Conditions - People with any liver condition (%)
Medical Conditions - People who ever had cancer or malignancy (%)
Mental Health - People who have little interest in doing things (%)
Mental Health - People feeling down, depressed, or hopeless (%)
Mental Health - People who have trouble sleeping or sleeping too much (%)
Mental Health - People feeling tired or having little energy (%)
Mental Health - People with poor appetite or overeating (%)
Mental Health - People feeling bad about themself (%)
Mental Health - People who have trouble concentrating on things (%)
Mental Health - People moving or speaking slowly or too fast (%)
Mental Health - People having thoughts they would be better off dead (%)
Oral Health - Average years since last visit a dentist
Oral Health - People embarrassed because of mouth (%)
Oral Health - People with gum disease (%)
Oral Health - General health of teeth and gums (%)
Oral Health - Average days a week using dental floss/device
Oral Health - Average days a week using mouthwash for dental problem
Oral Health - Average number of teeth
Pesticide Use - Households using pesticides to control insects (%)
Pesticide Use - Households using pesticides to kill weeds (%)
Physical Activity - People doing vigorous-intensity work activities (%)
Physical Activity - People doing moderate-intensity work activities (%)
Physical Activity - People walking or bicycling (%)
Physical Activity - People doing vigorous-intensity recreational activities (%)
Physical Activity - People doing moderate-intensity recreational activities (%)
Physical Activity - Average hours a day doing sedentary activities
Physical Activity - Average hours a day watching TV or videos
Physical Activity - Average hours a day using computer
Physical Functioning - People having limitations keeping them from working (%)
Physical Functioning - People limited in amount of work they can do (%)
Physical Functioning - People that need special equipment to walk (%)
Physical Functioning - People experiencing confusion/memory problems (%)
Physical Functioning - People requiring special healthcare equipment (%)
Prescription Medications - Average number of prescription medicines taking
Preventive Aspirin Use - Adults 40+ taking low-dose aspirin (%)
Reproductive Health - Vaginal deliveries (%)
Reproductive Health - Cesarean deliveries (%)
Reproductive Health - Deliveries resulted in a live birth (%)
Reproductive Health - Pregnancies resulted in a delivery (%)
Reproductive Health - Women breastfeeding newborns (%)
Reproductive Health - Women that had a hysterectomy (%)
Reproductive Health - Women that had both ovaries removed (%)
Reproductive Health - Women that have ever taken birth control pills (%)
Reproductive Health - Women taking birth control pills (%)
Reproductive Health - Women that have ever used Depo-Provera or injectables (%)
Reproductive Health - Women that have ever used female hormones (%)
Sexual Behavior - People 18+ that ever had sex (vaginal, anal, or oral) (%)
Sexual Behavior - Males 18+ that ever had vaginal sex with a woman (%)
Sexual Behavior - Males 18+ that ever performed oral sex on a woman (%)
Sexual Behavior - Males 18+ that ever had anal sex with a woman (%)
Sexual Behavior - Males 18+ that ever had any sex with a man (%)
Sexual Behavior - Females 18+ that ever had vaginal sex with a man (%)
Sexual Behavior - Females 18+ that ever performed oral sex on a man (%)
Sexual Behavior - Females 18+ that ever had anal sex with a man (%)
Sexual Behavior - Females 18+ that ever had any kind of sex with a woman (%)
Sexual Behavior - Average age people first had sex
Sexual Behavior - Average number of female sex partners in lifetime (males 18+)
Sexual Behavior - Average number of female vaginal sex partners in lifetime (males 18+)
Sexual Behavior - Average age people first performed oral sex on a woman (18+)
Sexual Behavior - Average number of woman performed oral sex on in lifetime (18+)
Sexual Behavior - Average number of male sex partners in lifetime (males 18+)
Sexual Behavior - Average number of male anal sex partners in lifetime (males 18+)
Sexual Behavior - Average age people first performed oral sex on a man (18+)
Sexual Behavior - Average number of male oral sex partners in lifetime (18+)
Sexual Behavior - People using protection when performing oral sex (%)
Sexual Behavior - Average number of times people have vaginal or anal sex a year
Sexual Behavior - People having sex without condom (%)
Sexual Behavior - Average number of male sex partners in lifetime (females 18+)
Sexual Behavior - Average number of male vaginal sex partners in lifetime (females 18+)
Sexual Behavior - Average number of female sex partners in lifetime (females 18+)
Sexual Behavior - Circumcised males 18+ (%)
Sleep Disorders - Average hours sleeping at night
Sleep Disorders - People that has trouble sleeping (%)
Smoking-Cigarette Use - People smoking cigarettes (%)
Taste & Smell - People 40+ having problems with smell (%)
Taste & Smell - People 40+ having problems with taste (%)
Taste & Smell - People 40+ that ever had wisdom teeth removed (%)
Taste & Smell - People 40+ that ever had tonsils teeth removed (%)
Taste & Smell - People 40+ that ever had a loss of consciousness because of a head injury (%)
Taste & Smell - People 40+ that ever had a broken nose or other serious injury to face or skull (%)
Taste & Smell - People 40+ that ever had two or more sinus infections (%)
Weight - Average height (inches)
Weight - Average weight (pounds)
Weight - Average BMI
Weight - People that are obese (%)
Weight - People that ever were obese (%)
Weight - People trying to lose weight (%)
14,475 45.3% Hispanic 9,399 29.4% White alone 3,114 9.7% Asian alone 2,001 6.3% Two or more races 1,565 4.9% Black alone 883 2.8% Native Hawaiian and Other 335 1.0% Other race alone 12 0.04% American Indian alone
According to our research of California and other state lists, there were 47 registered sex offenders living in Seaside, California as of June 16, 2024 . The ratio of all residents to sex offenders in Seaside is 734 to 1.The ratio of registered sex offenders to all residents in this city is near the state average.
Officers per 1,000 residents here:
0.82California average:
2.30
Latest news from Seaside, CA collected exclusively by city-data.com from local newspapers, TV, and radio stations
Ancestries: English (6.2%), German (3.7%), American (3.1%), Irish (2.4%), Italian (2.1%), European (2.0%).
Current Local Time:
Land area: 8.83 square miles.
Population density: 3,567 people per square mile (average).
8,442 residents are foreign born (17.0% Latin America , 6.8% Asia ).
This city:
26.4%California:
26.5%
Median real estate property taxes paid for housing units with mortgages in 2022: $3,984 (0.6%)Median real estate property taxes paid for housing units with no mortgage in 2022: $1,826 (0.3%)
Nearest city with pop. 50,000+: Salinas, CA
Nearest city with pop. 200,000+: San Jose, CA
Nearest city with pop. 1,000,000+: Los Angeles, CA
Nearest cities:
Latitude: 36.62 N, Longitude: 121.83 W
Daytime population change due to commuting: -8,548 (-26.8%)Workers who live and work in this city: 2,906 (19.6%)
Area code commonly used in this area: 831
Property values in Seaside, CA
Single-family new house construction building permits:
2013: 4 buildings , average cost: $360,7002010: 4 buildings , average cost: $194,2002009: 12 buildings , average cost: $178,1002007: 6 buildings , average cost: $313,1002006: 1 building , cost: $289,1002005: 208 buildings , average cost: $439,3002004: 202 buildings , average cost: $439,3002003: 210 buildings , average cost: $398,1002002: 5 buildings , average cost: $152,6002001: 4 buildings , average cost: $137,8002000: 9 buildings , average cost: $123,4001999: 5 buildings , average cost: $101,8001998: 14 buildings , average cost: $112,7001997: 13 buildings , average cost: $112,800Unemployment in December 2023:
Most common occupations in Seaside, CA (%)
Both Males Females
Building and grounds cleaning and maintenance occupations (13.6%)
Cooks and food preparation workers (4.0%)
Other management occupations, except farmers and farm managers (3.9%)
Other food preparation and serving workers, including supervisors (3.8%)
Retail sales workers, except cashiers (3.6%)
Waiters and waitresses (3.5%)
Information and record clerks, except customer service representatives (2.8%)
Building and grounds cleaning and maintenance occupations (14.3%)
Cooks and food preparation workers (6.2%)
Other food preparation and serving workers, including supervisors (5.5%)
Other management occupations, except farmers and farm managers (3.8%)
Retail sales workers, except cashiers (3.7%)
Waiters and waitresses (3.6%)
Vehicle and mobile equipment mechanics, installers, and repairers (3.6%)
Building and grounds cleaning and maintenance occupations (12.7%)
Secretaries and administrative assistants (5.7%)
Information and record clerks, except customer service representatives (5.0%)
Other office and administrative support workers, including supervisors (4.2%)
Other management occupations, except farmers and farm managers (4.0%)
Retail sales workers, except cashiers (3.6%)
Waiters and waitresses (3.4%)
Earthquake activity:
Seaside-area historical earthquake activity is significantly above California state average. It is 7388% greater than the overall U.S. average. On 4/18/1906 at 13:12:21, a magnitude 7.9 (7.9 UK, Class: Major, Intensity: VIII - XII) earthquake occurred 115.2 miles away from the city center, causing $524,000,000 total damage On 11/4/1927 at 13:51:53, a magnitude 7.5 (7.5 UK) earthquake occurred 126.0 miles away from the city center On 10/18/1989 at 00:04:15, a magnitude 7.1 (6.5 MB, 7.1 MS, 6.9 MW, 7.0 ML) earthquake occurred 34.4 miles away from the city center, causing 62 deaths ( 62 shaking deaths) and 3757 injuries, causing $1,305,032,704 total damage On 7/21/1952 at 11:52:14, a magnitude 7.7 (7.7 UK) earthquake occurred 194.3 miles away from the city center, causing $50,000,000 total damage On 5/2/1983 at 23:42:37, a magnitude 6.7 (6.2 MB, 6.5 MS, 6.5 MW, 6.7 ML, Class: Strong, Intensity: VII - IX) earthquake occurred 89.5 miles away from the city center, causing $31,000,000 total damage On 12/22/2003 at 19:15:56, a magnitude 6.6 (6.1 MB, 6.4 MS, 6.6 MW, 6.4 MW) earthquake occurred 81.0 miles away from the city center, causing 2 deaths ( 2 shaking deaths) and 40 injuries, causing $200,000,000 total damage Magnitude types: body-wave magnitude (MB), local magnitude (ML), surface-wave magnitude (MS), moment magnitude (MW) Natural disasters: The number of natural disasters in Monterey County (23) is greater than the US average (15).Major Disasters (Presidential) Declared: 14Emergencies Declared: 3Floods: 12, Winter Storms: 7, Storms: 6, Fires: 4, Landslides: 4, Mudslides: 4, Freezes: 2, Drought: 1, Earthquake: 1, Hurricane: 1, Tornado: 1, Tsunami Wave: 1, Other: 1 (Note: some incidents may be assigned to more than one category). Hospitals and medical centers near Seaside: CENTRAL COAST VNA AND HOSPICE INC (Hospital, about 2 miles away; SALINAS, CA)
MONTEREY PENINSULA DIALYSIS (Dialysis Facility, about 3 miles away; MONTEREY, CA)
CHOICE HOME HEALTH CARE (Home Health Center, about 3 miles away; MONTEREY, CA)
ADOBE HOME HEALTH CARE (Home Health Center, about 3 miles away; MONTEREY, CA)
CENTRAL COAST VNA AND HOSPICE, INC (Home Health Center, about 3 miles away; MONTEREY, CA)
COMMUNITY HOSPITAL HOME HEALTH SERVICES (Home Health Center, about 4 miles away; MONTEREY, CA)
GOOD LIFE HOME CARE (Home Health Center, about 4 miles away; MONTEREY, CA)
Amtrak station: SEASIDE (BLDG. T-1176, 4TH ST.) - Bus Station
.
Services: fully wheelchair accessible, public payphones, free short-term parking, call for taxi service, public transit connection.
College/University in Seaside: California State University-Monterey Bay Full-time enrollment: 5,125; Location: 100 Campus Center; Public; Website: www.csumb.edu; Offers Master's degree )
Other colleges/universities with over 2000 students near Seaside:
Naval Postgraduate School (about 3 miles; Monterey, CA ; Full-time enrollment: 4,951)
Monterey Peninsula College (about 4 miles; Monterey, CA ; FT enrollment: 4,588)
Hartnell College (about 10 miles; Salinas, CA ; FT enrollment: 5,506)
Cabrillo College (about 27 miles; Aptos, CA ; FT enrollment: 7,729)
Gavilan College (about 29 miles; Gilroy, CA ; FT enrollment: 3,327)
University of California-Santa Cruz (about 30 miles; Santa Cruz, CA ; FT enrollment: 17,751)
West Valley College (about 46 miles; Saratoga, CA ; FT enrollment: 6,128)
Public high schools in Seaside:
Public elementary/middle schools in Seaside: MARTIN LUTHER KING Students: 581, Location: 1713 BRD.WAY, Grades: KG-5)SEASIDE MIDDLE Students: 563, Location: 999 COE AVE., Grades: 6-8)ORD TERRACE ELEMENTARY Students: 358, Location: 1755 LA SALLE AVE., Grades: KG-5)DEL REY WOODS ELEMENTARY Students: 316, Location: 1281 PLUMAS AVE., Grades: KG-5)INTERNATIONAL SCHOOL OF MONTEREY Students: 305, Location: 1720 YOSEMITE ST., Grades: KG-8, Charter school )HIGHLAND ELEMENTARY Location: 1650 SONOMA AVE., Grades: KG-5)
GEORGE C. MARSHALL ELEMENTARY Location: 300 NORMANDY RD., Grades: KG-5)
MONTEREY PENINSULA USD COMM DAY MIDDLE Location: 200 COE AVE., Grades: 6-8)
DUAL LANGUAGE ACADEMY OF THE MONTEREY PENINSULA Location: 225 NORMANDY RD., Grades: KG-8, Charter school )
Private elementary/middle schools in Seaside: MONTEREY BAY CHRISTIAN SCHOOL Students: 162, Location: 1184 HILBY AVE, Grades: KG-8)
CHARTWELL SCHOOL Students: 80, Location: 2511 NUMA WATSON RD, Grades: 3-8)
PENINSULA ADVENTIST SCHOOL Students: 22, Location: 1025 MESCAL ST, Grades: KG-8)
See full list of schools located in Seaside
Notable locations in Seaside: (A) , Bayonet and Black Horse Golf Courses (B) , Workfield Siding (C) , Kimble Gate (D) , Grove Gate (E) , Seaside City Hall (F) , Seaside Chamber of Commerce (G) , Sand City City Hall (H) , Oldemeyer Center (I) , Monterey Institute of Research Astronomy (J) , Presidio of Monterey Fire Department (K) , City of Seaside Fire Department (L) . Display/hide their locations on the map
Shopping Centers: (1) , Laguna Grande Shopping Center (2) . Display/hide their locations on the map
Churches in Seaside include: (A) , The Church of Jesus Christ of Latter Day Saints (B) , Faith Lutheran Church (C) , First Baptist Church of Seaside (D) , First Southern Baptist Church (E) , Greater Faith Missionary Baptist Church (F) , Hilltop-Marina United Methodist Church (G) , New Hope Baptist Church (H) , Pentecostal Outreach Center (I) . Display/hide their locations on the map
Cemetery: (1) . Display/hide its location on the map
Lakes: (A) , Roberts Lake (B) . Display/hide their locations on the map
Parks in Seaside include: (1) , Beta Park (2) , David Cutino Park (3) , Encanto Park (4) , Farallones Park (5) , Juarez Park (6) , Mescal Neil Park (7) , Metz Park (8) , Portola Leslie Park (9) . Display/hide their locations on the map
Hotel:
Birthplace of: Mason Foster - Football player, Bashir Levingston - Player of and football, Henry Lusk - Football player.
Monterey County has a predicted average indoor radon screening level between 2 and 4 pCi/L (pico curies per liter) - Moderate Potential Average household size: This city:
3.2 peopleCalifornia:
2.9 people
Percentage of family households: This city:
73.1%Whole state:
68.7%
Percentage of households with unmarried partners: This city:
7.9%Whole state:
7.2%
Likely homosexual households (counted as self-reported same-sex unmarried-partner households)
Lesbian couples: 0.4% of all households Gay men: 0.3% of all households
People in group quarters in Seaside in 2010:
976 people in college/university student housing
65 people in emergency and transitional shelters (with sleeping facilities) for people experiencing homelessness
39 people in group homes intended for adults
32 people in residential treatment centers for adults
15 people in other noninstitutional facilities
People in group quarters in Seaside in 2000:
35 people in homes or halfway houses for drug/alcohol abuse
28 people in nursing homes
19 people in homes for the mentally ill
16 people in other noninstitutional group quarters
5 people in other group homes
Banks with branches in Seaside (2011 data):
Bank of America, National Association: Seaside Branch at 1451 Fremont Boulevard, branch established on 1949/07/25. Info updated 2009/11/18: Bank assets: $1,451,969.3 mil, Deposits: $1,077,176.8 mil, headquarters in Charlotte, NC, positive income , 5782 total offices , Holding Company: Bank Of America Corporation
Rabobank, National Association: Seaside Branch at 1658 Fremont Blvd, branch established on 1990/07/02. Info updated 2011/01/27: Bank assets: $11,745.0 mil, Deposits: $8,446.0 mil, headquarters in Roseville, CA, positive income , Agricultural Specialization, 124 total offices , Holding Company: Cooperatieve Centrale Raiffeisen-Boerenleenbank B.A., "rabobank Nederland
JPMorgan Chase Bank, National Association: Seaside Branch at 800 Broadway Avenue, Suite A-2, branch established on 2007/10/15. Info updated 2011/11/10: Bank assets: $1,811,678.0 mil, Deposits: $1,190,738.0 mil, headquarters in Columbus, OH, positive income , International Specialization, 5577 total offices , Holding Company: Jpmorgan Chase & Co.
For population 15 years and over in Seaside:
Never married: 41.3%Now married: 43.8%Separated: 1.0%Widowed: 4.2%Divorced: 9.6% For population 25 years and over in Seaside:
High school or higher: 82.4%Bachelor's degree or higher: 24.9%Graduate or professional degree: 9.1%Unemployed: 5.2%Mean travel time to work (commute): 19.6 minutes
Education Gini index (Inequality in education) Here:
15.8California average:
15.5
Religion statistics for Seaside, CA (based on Monterey County data)
Religion Adherents Congregations Catholic 150,050 26 Evangelical Protestant 23,624 154 Other 18,309 48 Mainline Protestant 11,244 48 Black Protestant 1,199 8 Orthodox 640 3 None 209,991 -
Source: Clifford Grammich, Kirk Hadaway, Richard Houseal, Dale E.Jones, Alexei Krindatch, Richie Stanley and Richard H.Taylor. 2012. 2010 U.S.Religion Census: Religious Congregations & Membership Study. Association of Statisticians of American Religious Bodies. Jones, Dale E., et al. 2002. Congregations and Membership in the United States 2000. Nashville, TN: Glenmary Research Center. Graphs represent county-level data
Food Environment Statistics: Number of grocery stores : 114This county :
2.82 / 10,000 pop.California :
2.14 / 10,000 pop.
Number of supercenters and club stores : 2Monterey County :
0.05 / 10,000 pop.California :
0.04 / 10,000 pop.
Number of convenience stores (no gas) : 37Monterey County :
0.91 / 10,000 pop.State :
0.62 / 10,000 pop.
Number of convenience stores (with gas) : 81Monterey County :
2.00 / 10,000 pop.California :
1.49 / 10,000 pop.
Number of full-service restaurants : 374Here :
9.24 / 10,000 pop.State :
7.42 / 10,000 pop.
Adult diabetes rate : Monterey County :
7.5%California :
7.3%
Adult obesity rate : Monterey County :
21.8%State :
21.3%
Low-income preschool obesity rate : Here :
18.4%California :
17.9%
Health and Nutrition: Healthy diet rate : This city:
47.8%California:
49.4%
Average overall health of teeth and gums : This city:
46.6%California:
48.0%
People feeling badly about themselves : Seaside:
20.3%California:
20.2%
People not drinking alcohol at all : Here:
11.6%California:
11.2%
Average hours sleeping at night : Overweight people : This city:
29.9%California:
31.5%
General health condition : Average condition of hearing : More about Health and Nutrition of Seaside, CA Residents
Local government employment and payroll (March 2022)
Function
Full-time employees
Monthly full-time payroll
Average yearly full-time wage
Part-time employees
Monthly part-time payroll
Police Protection - Officers
30 $450,913 $180,365 0 $0 Firefighters
22 $172,382 $94,027 0 $0 Streets and Highways
21 $141,061 $80,606 0 $0 Parks and Recreation
12 $35,608 $35,608 80 $113,828 Other and Unallocable
11 $148,913 $162,451 3 $3,464 Police - Other
9 $62,102 $82,803 0 $0 Other Government Administration
8 $99,997 $149,996 7 $3,092 Financial Administration
8 $74,883 $112,325 0 $0 Housing and Community Development (Local)
5 $53,364 $128,074 0 $0 Sewerage
4 $28,699 $86,097 0 $0 Judicial and Legal
2 $24,255 $145,530 0 $0 Solid Waste Management
2 $13,937 $83,622 0 $0 Fire - Other
0 $0 1 $5,102
Totals for Government
134 $1,306,114 $116,965 91 $125,486
Seaside government finances - Expenditure in 2017 (per resident):
Construction - Regular Highways: $1,645,000 ($52.26)
Police Protection: $1,631,000 ($51.81)Housing and Community Development: $1,092,000 ($34.69)Local Fire Protection: $701,000 ($22.27)Parks and Recreation: $488,000 ($15.50)Protective Inspection and Regulation - Other: $379,000 ($12.04)Current Operations - Police Protection: $9,683,000 ($307.61)
Local Fire Protection: $6,718,000 ($213.42)Parks and Recreation: $2,384,000 ($75.74)Central Staff Services: $2,006,000 ($63.73)Regular Highways: $1,638,000 ($52.04)Financial Administration: $1,051,000 ($33.39)Water Utilities: $753,000 ($23.92)Protective Inspection and Regulation - Other: $453,000 ($14.39)Housing and Community Development: $212,000 ($6.73)Health - Other: $195,000 ($6.19)General - Other: $94,000 ($2.99)General - Interest on Debt: $587,000 ($18.65)
Other Capital Outlay - Housing and Community Development: $579,000 ($18.39)
Parks and Recreation: $445,000 ($14.14)Health - Other: $19,000 ($0.60)General - Other: $12,000 ($0.38)Libraries: $8,000 ($0.25)
Seaside government finances - Revenue in 2017 (per resident):
Charges - Parks and Recreation: $695,000 ($22.08)
Other: $634,000 ($20.14)Housing and Community Development: $37,000 ($1.18)Federal Intergovernmental - Housing and Community Development: $457,000 ($14.52)
Other: $56,000 ($1.78)Miscellaneous - General Revenue - Other: $2,229,000 ($70.81)
Rents: $269,000 ($8.55)Sale of Property: $231,000 ($7.34)Fines and Forfeits: $191,000 ($6.07)Interest Earnings: $82,000 ($2.60)Revenue - Water Utilities: $663,000 ($21.06)
State Intergovernmental - Other: $1,440,000 ($45.75)
Highways: $738,000 ($23.44)General Local Government Support: $8,000 ($0.25)Tax - General Sales and Gross Receipts: $11,183,000 ($355.26)
Property: $6,702,000 ($212.91)Public Utilities Sales: $3,957,000 ($125.71)Other Selective Sales: $2,702,000 ($85.84)Occupation and Business License - Other: $586,000 ($18.62)Other License: $538,000 ($17.09)Documentary and Stock Transfer: $81,000 ($2.57)
Seaside government finances - Debt in 2017 (per resident):
Long Term Debt - Beginning Outstanding - Unspecified Public Purpose: $14,577,000 ($463.09)
Outstanding Unspecified Public Purpose: $13,249,000 ($420.90)Retired Unspecified Public Purpose: $1,328,000 ($42.19)
Seaside government finances - Cash and Securities in 2017 (per resident):
Bond Funds - Cash and Securities: $1,611,000 ($51.18)
Other Funds - Cash and Securities: $21,502,000 ($683.08)
Sinking Funds - Cash and Securities: $556,000 ($17.66)
4.96% of this county's 2021 resident taxpayers lived in other counties in 2020 ($91,945 average adjusted gross income )
Here:
4.96%California average:
5.19%
0.08% of residents moved from foreign countries ($1,276 average AGI )Monterey County:
0.08%California average:
0.03%
Top counties from which taxpayers relocated into this county between 2020 and 2021:
6.17% of this county's 2020 resident taxpayers moved to other counties in 2021 ($76,219 average adjusted gross income )
Here:
6.17%California average:
6.14%
0.08% of residents moved to foreign countries ($1,055 average AGI )Monterey County:
0.08%California average:
0.02%
Top counties to which taxpayers relocated from this county between 2020 and 2021:
Businesses in Seaside, CA
Name Count Name Count
7-Eleven 3 KFC 1 Audi 1 Kroger 1 AutoZone 1 Little Caesars Pizza 1 BMW 1 Long John Silver's 1 Baskin-Robbins 1 Mazda 1 Burger King 1 McDonald's 1 Carl\s Jr. 1 Nissan 1 Chevrolet 1 Panda Express 1 Church's Chicken 1 Pizza Hut 1 DHL 1 Quiznos 1 Domino's Pizza 1 RadioShack 1 Econo Lodge 1 Staples 1 FedEx 3 Starbucks 1 Ford 1 Subaru 1 Goodwill 1 Subway 1 H&R Block 2 T-Mobile 1 Hilton 1 Taco Bell 1 Holiday Inn 1 Toyota 1 Home Depot 1 U-Haul 1 Honda 1 UPS 1 Howard Johnson 1 Walgreens 1 Jack In The Box 1 Wendy's 1 Jones New York 1
Strongest AM radio stations in Seaside:
KYAA (1200 AM; 25 kW; SOQUEL, CA; Owner: PEOPLE'S RADIO, INC.)
KNRY (1240 AM; 1 kW; MONTEREY, CA; Owner: PEOPLE'S RADIO, INC.)
KSRK (540 AM; 10 kW; CARMEL VALLEY, CA; Owner: PEOPLE'S RADIO, INC.)
KIDD (630 AM; 1 kW; MONTEREY, CA; Owner: BUCKLEY COMMUNICATIONS, INC.)
KDBV (980 AM; 10 kW; SALINAS, CA; Owner: WOLFHOUSE RADIO GROUP, INC.)
KRML (1410 AM; 2 kW; CARMEL, CA; Owner: WISDOM BROADCASTING CO, INC.)
KION (1460 AM; 10 kW; SALINAS, CA)
KKMC (880 AM; 10 kW; GONZALES, CA; Owner: MONTEREY COUNTY BROADCASTERS, INC.)
KTOM (1380 AM; 5 kW; SALINAS, CA; Owner: CLEAR CHANNEL BROADCASTING LICENSES, INC.)
KLOK (1170 AM; 50 kW; SAN JOSE, CA; Owner: ENTRAVISION HOLDINGS, LLC)
KNBR (680 AM; 50 kW; SAN FRANCISCO, CA; Owner: KNBR LICO, INC.)
KSCO (1080 AM; 10 kW; SANTA CRUZ, CA)
KGO (810 AM; 50 kW; SAN FRANCISCO, CA; Owner: KGO-AM RADIO, INC.)
Strongest FM radio stations in Seaside:
KMBY-FM (103.9 FM; SEASIDE, CA; Owner: MAPLETON COMMUNICATIONS, LLC)
KUSP (88.9 FM; SANTA CRUZ, CA; Owner: PATAPHYSICAL B/CING. FOUNDATION,INC.)
K260AA (99.9 FM; CARMEL VALLEY, CA; Owner: ENTRAVISION HOLDINGS, LLC)
KWAV (96.9 FM; MONTEREY, CA; Owner: BUCKLEY BROADCASTING OF MONTEREY)
KTOM-FM (100.7 FM; SALINAS, CA; Owner: CLEAR CHANNEL BROADCASTING LICENSES, INC.)
K291AE (106.1 FM; SEASIDE, CA; Owner: MAPELTON COMMUNICATIONS, LLC)
KBOQ (95.5 FM; CARMEL, CA; Owner: J & M BROADCASTING, INC.)
KMJO (92.7 FM; MARINA, CA; Owner: CLEAR CHANNEL BROADCASTING LICENSES, INC.)
KSES-FM (107.1 FM; SEASIDE, CA; Owner: ENTRAVISION HOLDINGS, LLC)
KAZU (90.3 FM; PACIFIC GROVE, CA; Owner: FOUNDATION OF CALIFORNIA STATE UNIVERSITY, MONTEREY BAY)
KCDU (101.7 FM; CARMEL, CA; Owner: MAPLETON COMMUNICATIONS, L.L.C.)
KSPB (91.9 FM; PEBBLE BEACH, CA; Owner: ROBERT LOUIS STEVENSON SCHOOL)
KDON-FM (102.5 FM; SALINAS, CA; Owner: CLEAR CHANNEL BROADCASTING LICENSES, INC.)
KOCN (105.1 FM; PACIFIC GROVE, CA; Owner: CLEAR CHANNEL BROADCASTING LICENSES, INC.)
K202DU (88.3 FM; SAN JUAN BAUTISTA, CA; Owner: CALVARY CHAPEL OF TWIN FALLS, INC.)
KBTU (93.5 FM; HOLLISTER, CA; Owner: MAPLETON COMMUNICATIONS, L.L.C.)
KLVM (89.7 FM; PRUNEDALE, CA; Owner: PRUNEDALE EDUCATIONAL ASSOCIATION)
K265DG (100.9 FM; HOLLISTER, CA; Owner: CLEAR CHANNEL BROADCASTING LICENSES, INC.)
K206BQ (89.1 FM; HOLLISTER, CA; Owner: PATAPHYSICAL BROADCASTING FOUNDATION, INC.)
KSQL (99.1 FM; SANTA CRUZ, CA; Owner: TMS LICENSE CALIFORNIA, INC)
TV broadcast stations around Seaside:
K53DT (Channel 53; MONTEREY, CA; Owner: TRINITY BROADCASTING NETWORK)
KION-TV (Channel 46; MONTEREY, CA; Owner: ACKERLEY MEDIA GROUP, INC.)
KSBW (Channel 8; SALINAS, CA; Owner: HEARST-ARGYLE STATIONS, INC.)
KCBA (Channel 35; SALINAS, CA; Owner: SEAL ROCK BROADCASTERS, L.L.C.)
KCAH (Channel 25; WATSONVILLE, CA; Owner: KTEH FOUNDATION)
Home Mortgage Disclosure Act Aggregated Statistics For Year 2009(Based on 5 full and 3 partial tracts) A) FHA, FSA/RHS & VA B) Conventional C) Refinancings D) Home Improvement Loans E) Loans on Dwellings For 5+ Families F) Non-occupant Loans on G) Loans On Manufactured Number Average Value Number Average Value Number Average Value Number Average Value Number Average Value Number Average Value Number Average Value
LOANS ORIGINATED 81 $272,460 123 $237,234 234 $241,984 11 $169,751 0 $0 56 $209,039 2 $73,000 APPLICATIONS APPROVED, NOT ACCEPTED 5 $297,600 21 $225,826 28 $257,104 1 $126,360 0 $0 13 $182,026 0 $0 APPLICATIONS DENIED 18 $299,720 29 $238,424 143 $270,411 6 $90,500 1 $300,000 23 $227,959 1 $1,000 APPLICATIONS WITHDRAWN 16 $265,546 17 $218,594 66 $249,705 2 $158,405 0 $0 15 $212,324 0 $0 FILES CLOSED FOR INCOMPLETENESS 3 $343,260 8 $263,750 22 $313,884 3 $270,317 0 $0 7 $260,267 0 $0
Aggregated Statistics For Year 2008(Based on 5 full and 3 partial tracts) A) FHA, FSA/RHS & VA B) Conventional C) Refinancings D) Home Improvement Loans E) Loans on Dwellings For 5+ Families F) Non-occupant Loans on G) Loans On Manufactured Number Average Value Number Average Value Number Average Value Number Average Value Number Average Value Number Average Value Number Average Value
LOANS ORIGINATED 25 $313,868 169 $255,231 161 $269,519 12 $184,667 6 $363,833 73 $232,884 4 $54,250 APPLICATIONS APPROVED, NOT ACCEPTED 4 $292,000 26 $257,887 44 $313,325 3 $42,333 0 $0 16 $239,869 3 $85,193 APPLICATIONS DENIED 13 $332,075 46 $238,313 177 $349,672 30 $210,196 0 $0 43 $312,310 3 $76,580 APPLICATIONS WITHDRAWN 6 $232,998 26 $254,707 57 $330,376 5 $203,400 1 $600,000 13 $262,602 0 $0 FILES CLOSED FOR INCOMPLETENESS 1 $347,000 12 $232,092 24 $360,772 2 $69,535 0 $0 4 $400,795 1 $69,000
Aggregated Statistics For Year 2007(Based on 5 full and 3 partial tracts) B) Conventional C) Refinancings D) Home Improvement Loans E) Loans on Dwellings For 5+ Families F) Non-occupant Loans on G) Loans On Manufactured Number Average Value Number Average Value Number Average Value Number Average Value Number Average Value Number Average Value
LOANS ORIGINATED 104 $371,002 445 $379,426 60 $329,479 7 $2,370,899 90 $361,475 2 $48,500 APPLICATIONS APPROVED, NOT ACCEPTED 15 $424,200 147 $408,770 12 $296,431 0 $0 22 $413,047 2 $77,035 APPLICATIONS DENIED 59 $394,093 386 $445,644 57 $252,311 0 $0 51 $402,549 8 $77,876 APPLICATIONS WITHDRAWN 11 $486,906 133 $433,071 17 $310,199 1 $420,000 18 $399,822 0 $0 FILES CLOSED FOR INCOMPLETENESS 11 $474,025 56 $401,488 4 $509,500 0 $0 10 $409,230 0 $0
Aggregated Statistics For Year 2006(Based on 5 full and 3 partial tracts) B) Conventional C) Refinancings D) Home Improvement Loans E) Loans on Dwellings For 5+ Families F) Non-occupant Loans on G) Loans On Manufactured Number Average Value Number Average Value Number Average Value Number Average Value Number Average Value Number Average Value
LOANS ORIGINATED 277 $386,837 804 $394,503 111 $313,520 2 $810,000 156 $399,446 2 $129,000 APPLICATIONS APPROVED, NOT ACCEPTED 50 $382,702 197 $408,577 18 $186,042 0 $0 36 $415,090 0 $0 APPLICATIONS DENIED 195 $378,287 443 $438,303 65 $281,780 0 $0 84 $485,415 3 $117,723 APPLICATIONS WITHDRAWN 58 $379,263 251 $411,075 15 $218,379 0 $0 31 $389,921 1 $40,000 FILES CLOSED FOR INCOMPLETENESS 16 $328,518 53 $425,211 7 $242,429 0 $0 8 $406,426 1 $114,000
Aggregated Statistics For Year 2005(Based on 5 full and 3 partial tracts) B) Conventional C) Refinancings D) Home Improvement Loans E) Loans on Dwellings For 5+ Families F) Non-occupant Loans on G) Loans On Manufactured Number Average Value Number Average Value Number Average Value Number Average Value Number Average Value Number Average Value
LOANS ORIGINATED 426 $390,418 848 $364,642 86 $351,090 6 $906,667 190 $355,759 3 $50,667 APPLICATIONS APPROVED, NOT ACCEPTED 102 $379,212 144 $377,832 15 $252,021 2 $800,000 23 $383,331 4 $52,100 APPLICATIONS DENIED 215 $372,245 404 $402,856 52 $276,833 0 $0 73 $428,627 8 $59,000 APPLICATIONS WITHDRAWN 95 $416,582 291 $366,346 35 $276,788 0 $0 50 $358,628 0 $0 FILES CLOSED FOR INCOMPLETENESS 19 $380,263 68 $410,494 5 $267,064 0 $0 7 $436,731 0 $0
Aggregated Statistics For Year 2004(Based on 5 full and 3 partial tracts) B) Conventional C) Refinancings D) Home Improvement Loans E) Loans on Dwellings For 5+ Families F) Non-occupant Loans on G) Loans On Manufactured Number Average Value Number Average Value Number Average Value Number Average Value Number Average Value Number Average Value
LOANS ORIGINATED 483 $330,320 941 $295,636 75 $231,346 12 $1,071,492 206 $279,529 5 $115,466 APPLICATIONS APPROVED, NOT ACCEPTED 88 $342,819 178 $286,132 18 $227,767 1 $390,000 24 $291,386 1 $93,940 APPLICATIONS DENIED 150 $318,700 358 $310,194 47 $152,546 1 $585,000 49 $283,304 8 $83,531 APPLICATIONS WITHDRAWN 108 $445,019 223 $278,729 13 $219,935 0 $0 25 $322,935 0 $0 FILES CLOSED FOR INCOMPLETENESS 16 $370,461 59 $300,784 2 $387,500 1 $475,000 6 $370,768 0 $0
Aggregated Statistics For Year 2003(Based on 5 full and 3 partial tracts) B) Conventional C) Refinancings D) Home Improvement Loans E) Loans on Dwellings For 5+ Families F) Non-occupant Loans on Number Average Value Number Average Value Number Average Value Number Average Value Number Average Value
LOANS ORIGINATED 372 $268,066 1,441 $214,071 22 $64,450 8 $1,634,000 261 $216,000 APPLICATIONS APPROVED, NOT ACCEPTED 79 $329,698 223 $231,212 5 $186,800 0 $0 38 $276,097 APPLICATIONS DENIED 115 $247,012 395 $235,299 24 $77,638 0 $0 65 $233,997 APPLICATIONS WITHDRAWN 125 $394,696 249 $222,811 5 $61,000 0 $0 30 $235,300 FILES CLOSED FOR INCOMPLETENESS 11 $367,537 75 $233,071 1 $50,000 1 $1,600,000 10 $188,429
Aggregated Statistics For Year 2002(Based on 5 full and 1 partial tracts) A) FHA, FSA/RHS & VA B) Conventional C) Refinancings D) Home Improvement Loans E) Loans on Dwellings For 5+ Families F) Non-occupant Loans on Number Average Value Number Average Value Number Average Value Number Average Value Number Average Value Number Average Value
LOANS ORIGINATED 6 $104,918 362 $216,251 995 $198,519 18 $28,951 5 $459,474 182 $186,280 APPLICATIONS APPROVED, NOT ACCEPTED 1 $54,000 55 $238,686 176 $194,774 9 $38,100 1 $700,000 27 $191,097 APPLICATIONS DENIED 1 $61,000 108 $206,077 267 $220,555 34 $28,199 2 $622,500 41 $198,675 APPLICATIONS WITHDRAWN 0 $0 43 $187,615 205 $218,595 7 $55,143 1 $5,500,000 17 $201,131 FILES CLOSED FOR INCOMPLETENESS 0 $0 11 $198,662 54 $201,987 1 $40,000 0 $0 4 $179,710
Aggregated Statistics For Year 2001(Based on 5 full and 1 partial tracts) A) FHA, FSA/RHS & VA B) Conventional C) Refinancings D) Home Improvement Loans E) Loans on Dwellings For 5+ Families F) Non-occupant Loans on Number Average Value Number Average Value Number Average Value Number Average Value Number Average Value Number Average Value
LOANS ORIGINATED 1 $175,000 277 $195,933 936 $189,863 53 $45,711 2 $886,175 131 $184,114 APPLICATIONS APPROVED, NOT ACCEPTED 1 $228,000 57 $201,487 156 $193,599 9 $45,222 0 $0 24 $177,978 APPLICATIONS DENIED 0 $0 105 $189,546 298 $188,231 41 $39,898 3 $522,667 37 $212,744 APPLICATIONS WITHDRAWN 2 $197,000 61 $206,504 310 $203,935 21 $53,291 0 $0 17 $176,881 FILES CLOSED FOR INCOMPLETENESS 0 $0 15 $219,608 79 $183,853 3 $55,667 0 $0 8 $253,500
Aggregated Statistics For Year 2000(Based on 5 full and 1 partial tracts) A) FHA, FSA/RHS & VA B) Conventional C) Refinancings D) Home Improvement Loans E) Loans on Dwellings For 5+ Families F) Non-occupant Loans on Number Average Value Number Average Value Number Average Value Number Average Value Number Average Value Number Average Value
LOANS ORIGINATED 10 $194,000 254 $168,519 379 $151,877 62 $41,171 5 $417,800 92 $157,012 APPLICATIONS APPROVED, NOT ACCEPTED 0 $0 41 $187,822 79 $155,566 16 $54,625 0 $0 13 $161,843 APPLICATIONS DENIED 4 $186,000 81 $164,320 189 $154,936 39 $38,416 0 $0 28 $144,762 APPLICATIONS WITHDRAWN 1 $149,000 27 $161,399 138 $143,598 18 $46,604 1 $635,000 17 $144,610 FILES CLOSED FOR INCOMPLETENESS 1 $150,000 15 $134,687 82 $159,978 4 $50,250 2 $513,000 5 $187,200
Aggregated Statistics For Year 1999(Based on 5 full and 2 partial tracts) A) FHA, FSA/RHS & VA B) Conventional C) Refinancings D) Home Improvement Loans E) Loans on Dwellings For 5+ Families F) Non-occupant Loans on Number Average Value Number Average Value Number Average Value Number Average Value Number Average Value Number Average Value
LOANS ORIGINATED 36 $163,287 298 $148,750 502 $125,919 54 $33,274 8 $808,609 107 $125,576 APPLICATIONS APPROVED, NOT ACCEPTED 8 $144,319 37 $138,858 121 $124,388 19 $43,889 2 $248,000 19 $103,053 APPLICATIONS DENIED 5 $126,108 98 $142,474 223 $125,886 38 $32,023 0 $0 27 $124,100 APPLICATIONS WITHDRAWN 9 $151,820 56 $126,484 181 $128,261 9 $82,626 1 $360,000 16 $100,118 FILES CLOSED FOR INCOMPLETENESS 0 $0 8 $122,658 85 $136,841 1 $150,000 2 $4,031,440 4 $114,250
Detailed HMDA statistics for the following Tracts:
0135.00
, 0136.00 , 0137.00 , 0138.00 , 0139.00 , 0140.00 , 0141.01 , 0141.03
Private Mortgage Insurance Companies Aggregated Statistics For Year 2009(Based on 5 full and 3 partial tracts) A) Conventional B) Refinancings Number Average Value Number Average Value
LOANS ORIGINATED 23 $250,127 3 $304,190 APPLICATIONS APPROVED, NOT ACCEPTED 11 $261,969 2 $322,000 APPLICATIONS DENIED 0 $0 0 $0 APPLICATIONS WITHDRAWN 0 $0 0 $0 FILES CLOSED FOR INCOMPLETENESS 1 $378,000 0 $0
Aggregated Statistics For Year 2008(Based on 5 full and 3 partial tracts) A) Conventional B) Refinancings C) Non-occupant Loans on Number Average Value Number Average Value Number Average Value
LOANS ORIGINATED 38 $292,807 5 $411,600 1 $268,000 APPLICATIONS APPROVED, NOT ACCEPTED 7 $320,659 1 $407,000 0 $0 APPLICATIONS DENIED 8 $290,875 3 $255,650 3 $229,333 APPLICATIONS WITHDRAWN 0 $0 1 $407,000 0 $0 FILES CLOSED FOR INCOMPLETENESS 0 $0 0 $0 0 $0
Aggregated Statistics For Year 2007(Based on 4 full and 3 partial tracts) A) Conventional B) Refinancings C) Non-occupant Loans on Number Average Value Number Average Value Number Average Value
LOANS ORIGINATED 4 $386,762 7 $580,286 0 $0 APPLICATIONS APPROVED, NOT ACCEPTED 0 $0 2 $558,000 1 $504,000 APPLICATIONS DENIED 0 $0 0 $0 0 $0 APPLICATIONS WITHDRAWN 0 $0 0 $0 0 $0 FILES CLOSED FOR INCOMPLETENESS 0 $0 0 $0 0 $0
Aggregated Statistics For Year 2006(Based on 4 full and 2 partial tracts) A) Conventional B) Refinancings Number Average Value Number Average Value
LOANS ORIGINATED 4 $489,038 2 $557,015 APPLICATIONS APPROVED, NOT ACCEPTED 0 $0 0 $0 APPLICATIONS DENIED 0 $0 2 $684,500 APPLICATIONS WITHDRAWN 0 $0 0 $0 FILES CLOSED FOR INCOMPLETENESS 0 $0 1 $555,000
Aggregated Statistics For Year 2005(Based on 3 full and 3 partial tracts) A) Conventional B) Refinancings Number Average Value Number Average Value
LOANS ORIGINATED 2 $398,840 4 $471,000 APPLICATIONS APPROVED, NOT ACCEPTED 0 $0 1 $192,000 APPLICATIONS DENIED 0 $0 0 $0 APPLICATIONS WITHDRAWN 0 $0 0 $0 FILES CLOSED FOR INCOMPLETENESS 0 $0 0 $0
Aggregated Statistics For Year 2004(Based on 3 full and 2 partial tracts) A) Conventional B) Refinancings C) Non-occupant Loans on Number Average Value Number Average Value Number Average Value
LOANS ORIGINATED 6 $372,333 3 $431,470 2 $299,500 APPLICATIONS APPROVED, NOT ACCEPTED 1 $455,950 2 $328,185 0 $0 APPLICATIONS DENIED 1 $473,000 0 $0 0 $0 APPLICATIONS WITHDRAWN 0 $0 0 $0 0 $0 FILES CLOSED FOR INCOMPLETENESS 0 $0 0 $0 0 $0
Aggregated Statistics For Year 2003(Based on 5 full and 2 partial tracts) A) Conventional B) Refinancings C) Non-occupant Loans on Number Average Value Number Average Value Number Average Value
LOANS ORIGINATED 11 $290,267 15 $275,339 0 $0 APPLICATIONS APPROVED, NOT ACCEPTED 6 $319,015 7 $289,421 2 $326,000 APPLICATIONS DENIED 0 $0 0 $0 0 $0 APPLICATIONS WITHDRAWN 0 $0 2 $339,345 0 $0 FILES CLOSED FOR INCOMPLETENESS 0 $0 0 $0 0 $0
Aggregated Statistics For Year 2002(Based on 5 full and 1 partial tracts) A) Conventional B) Refinancings C) Non-occupant Loans on Number Average Value Number Average Value Number Average Value
LOANS ORIGINATED 28 $285,480 14 $258,843 2 $325,400 APPLICATIONS APPROVED, NOT ACCEPTED 10 $275,600 9 $267,556 1 $262,000 APPLICATIONS DENIED 1 $328,000 0 $0 0 $0 APPLICATIONS WITHDRAWN 1 $180,000 4 $292,500 1 $288,000 FILES CLOSED FOR INCOMPLETENESS 1 $276,000 0 $0 0 $0
Aggregated Statistics For Year 2001(Based on 5 full and 1 partial tracts) A) Conventional B) Refinancings C) Non-occupant Loans on Number Average Value Number Average Value Number Average Value
LOANS ORIGINATED 22 $263,182 20 $255,612 2 $242,500 APPLICATIONS APPROVED, NOT ACCEPTED 7 $248,143 6 $224,500 0 $0 APPLICATIONS DENIED 1 $325,000 3 $245,667 0 $0 APPLICATIONS WITHDRAWN 2 $271,500 1 $239,000 1 $305,000 FILES CLOSED FOR INCOMPLETENESS 0 $0 0 $0 0 $0
Aggregated Statistics For Year 2000(Based on 5 full and 1 partial tracts) A) Conventional B) Refinancings C) Non-occupant Loans on Number Average Value Number Average Value Number Average Value
LOANS ORIGINATED 60 $199,788 29 $173,200 6 $164,500 APPLICATIONS APPROVED, NOT ACCEPTED 9 $197,567 1 $265,470 3 $143,333 APPLICATIONS DENIED 4 $197,672 2 $184,500 1 $113,000 APPLICATIONS WITHDRAWN 4 $217,250 2 $193,500 1 $202,000 FILES CLOSED FOR INCOMPLETENESS 0 $0 0 $0 0 $0
Aggregated Statistics For Year 1999(Based on 5 full and 2 partial tracts) A) Conventional B) Refinancings C) Non-occupant Loans on Number Average Value Number Average Value Number Average Value
LOANS ORIGINATED 89 $163,609 26 $161,885 9 $121,970 APPLICATIONS APPROVED, NOT ACCEPTED 11 $132,517 8 $135,625 2 $87,485 APPLICATIONS DENIED 4 $273,755 0 $0 0 $0 APPLICATIONS WITHDRAWN 4 $138,242 1 $275,000 0 $0 FILES CLOSED FOR INCOMPLETENESS 2 $135,000 2 $129,705 0 $0
Detailed PMIC statistics for the following Tracts:
0135.00
, 0136.00 , 0137.00 , 0138.00 , 0139.00 , 0140.00 , 0141.01 , 0141.03 Fire-safe hotels and motels in Seaside, California:
Embassy Suites Hotel, 1441 Cyn Del Rey Blvd, Seaside, California 93955 Phone: (831) 393-1115, Fax: (831) 393-1113
Econo Lodge Bay Breeze, 2049 Fremont Blvd, Seaside, California 93955 Phone: (831) 899-7111, Fax: (831) 899-7211
Americas Best Value Inn North, 2201 Del Monte Blvd, Seaside, California 93955 Phone: (831) 394-6786, Fax: (831) 394-0500
Americas Best Value Inn South, 1141 Fremont Blvd, Seaside, California 93955 Phone: (831) 899-1881, Fax: (831) 392-1300
All 4 fire-safe hotels and motels in Seaside, California Seaside compared to California state average:
Unemployed percentage significantly below state average. Length of stay since moving in significantly above state average.
#16 on the list of "Top 101 cities with largest percentage of females in occupations: building and grounds cleaning and maintenance occupations (population 5,000+)"
#37 on the list of "Top 101 cities with largest percentage of males in occupations: food preparation and serving related occupations (population 5,000+)"
#42 on the list of "Top 101 cities with largest percentage of males in industries: accommodation and food services (population 5,000+)"
#58 on the list of "Top 100 most racially diverse cities (pop. 5,000+)"
#68 on the list of "Top 101 cities with largest percentage of females in industries: accommodation and food services (population 5,000+)"
#70 on the list of "Top 100 cities with strongest arts, entertainment, recreation, accommodation and food services industries (pop. 5,000+)"
#74 on the list of "Top 101 cities with largest percentage of males in occupations: building and grounds cleaning and maintenance occupations (population 5,000+)"
#95 on the list of "Top 101 cities with the smallest racial income disparities between White and Black householders (with at least 200 householders)"
#15 on the list of "Top 101 counties with the highest Nitrogen Dioxide air pollution readings in 2012 (ppm)"
#20 on the list of "Top 101 counties with the lowest surface withdrawal of fresh water for public supply (pop. 50,000+)"
#33 on the list of "Top 101 counties with the highest number of births per 1000 residents 2007-2013"
#44 on the list of "Top 101 counties with the lowest Particulate Matter (PM2.5 ) Annual air pollution readings in 2012 (µg/m3 )"
#54 on the list of "Top 101 counties with the highest Particulate Matter (PM10 ) Annual air pollution readings in 2012 (µg/m3 )"
Top Patent Applicants
John William Kesterson (15)
Oleg Yakimenko (6)
John W. Kesterson (5)
Howard C. Mitzel (4)
Paul Mcreynolds (2)
Zaki Goumandakoye (2)
John Lewellen (2)
Jonathan David Johnson (1)
Christopher Yost (1)
Raymond R. Buettner (1)
Total of 58 patent applications in 2008-2024.

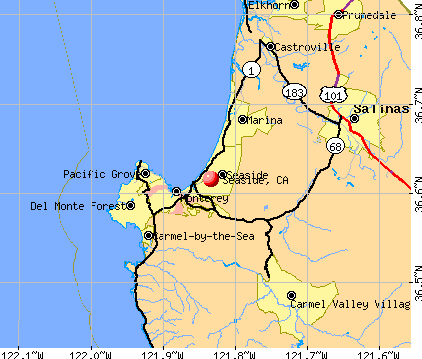


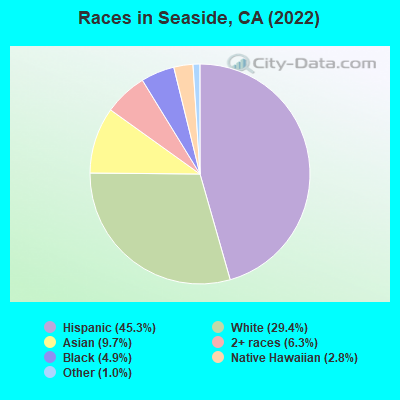
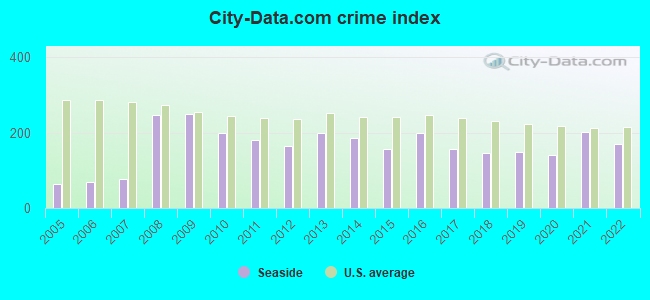
 Recent articles from our blog. Our writers, many of them Ph.D. graduates or candidates, create easy-to-read articles on a wide variety of topics.

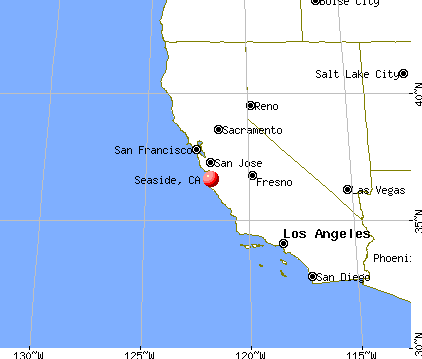
 (11.6 miles
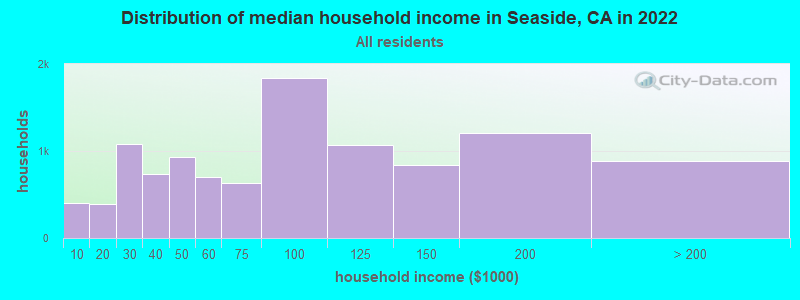
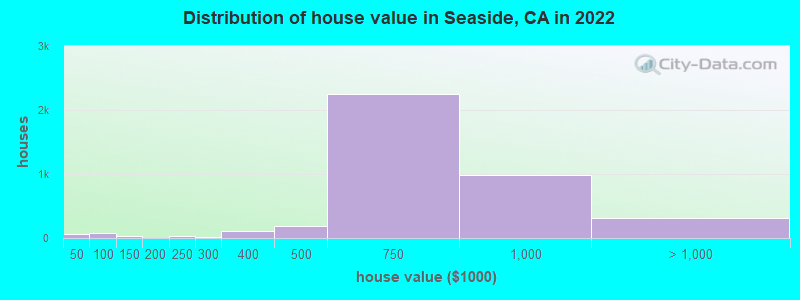

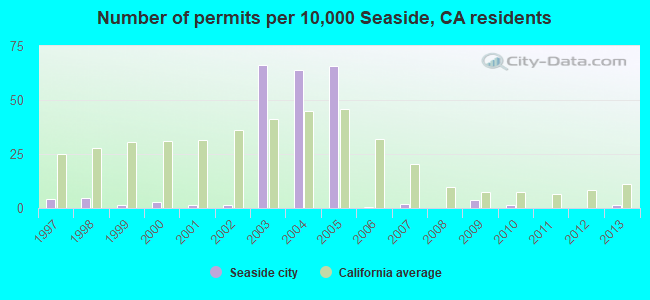
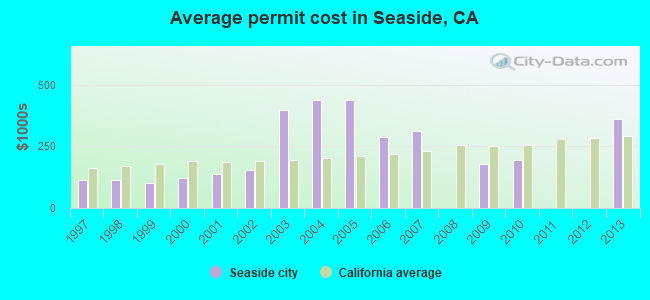
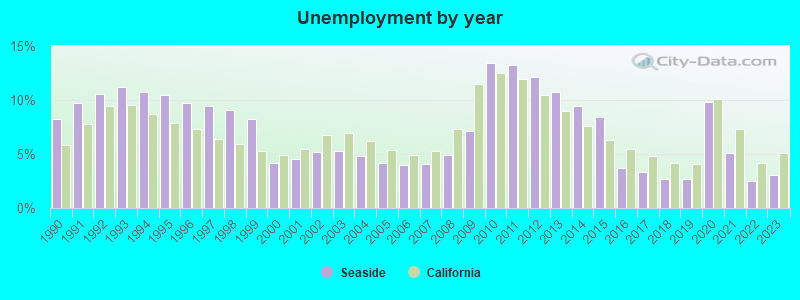
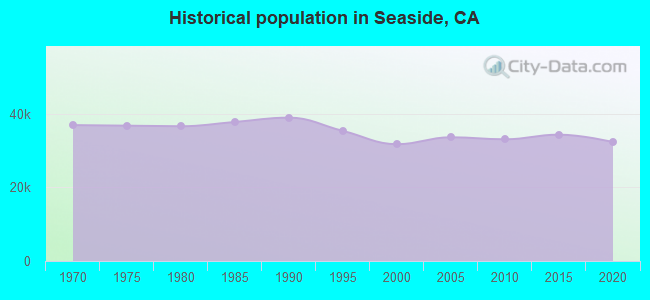
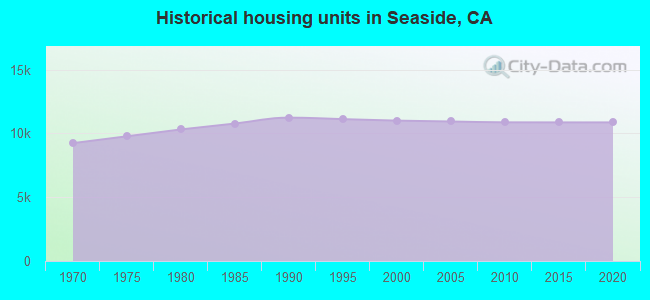
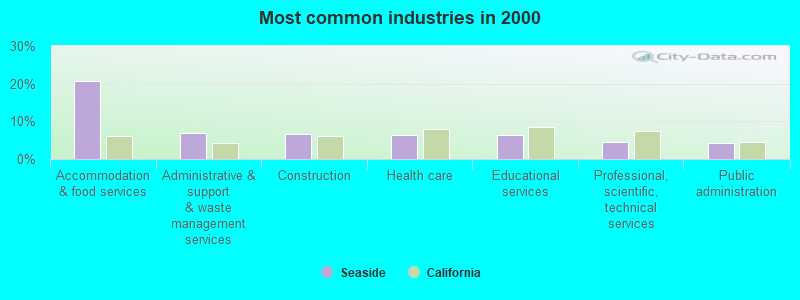
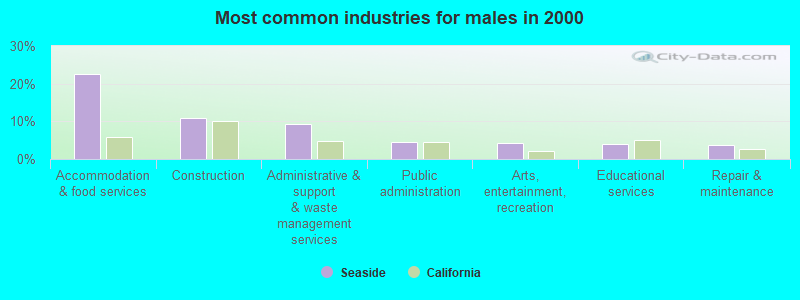
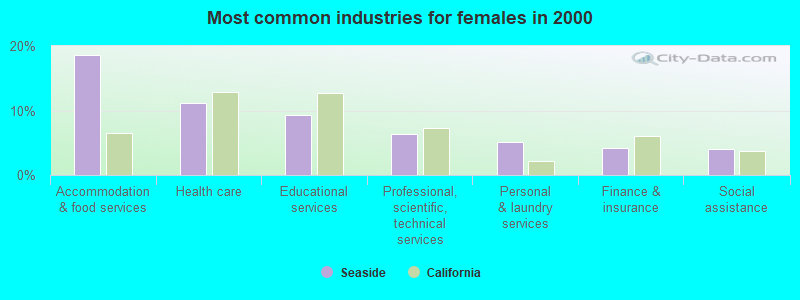
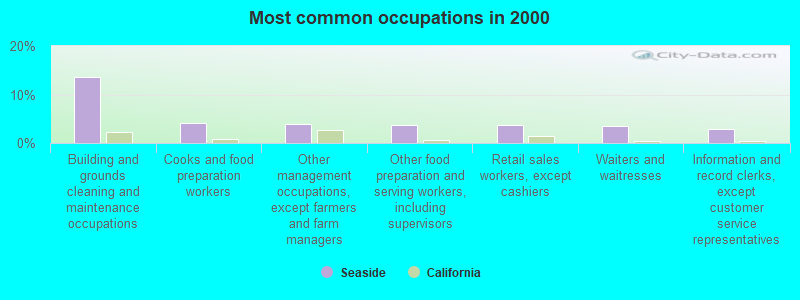
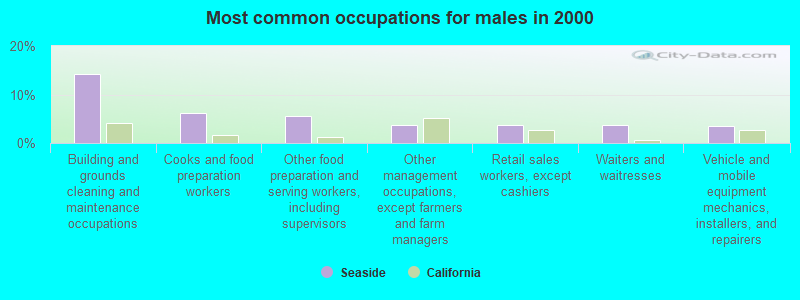
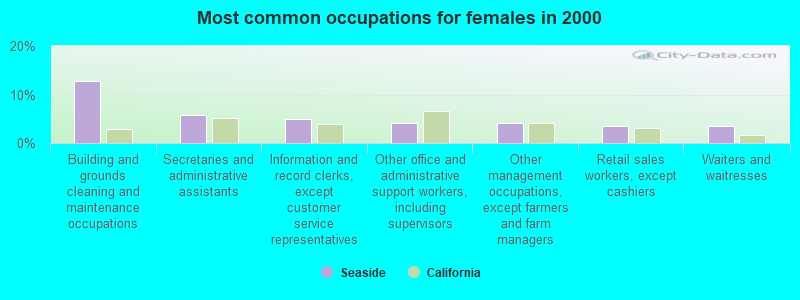


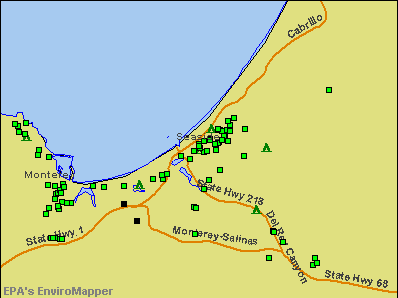

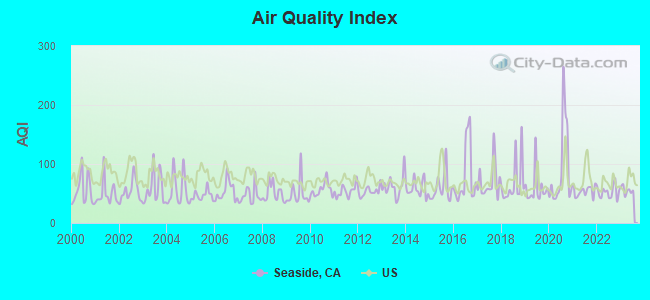
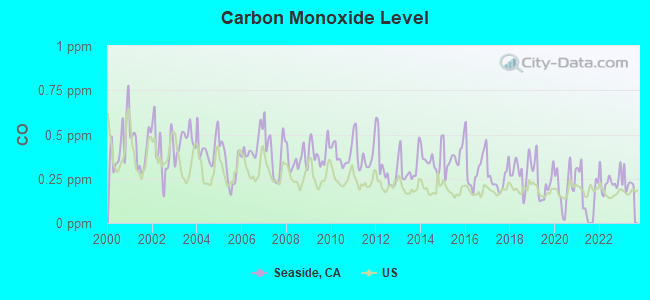
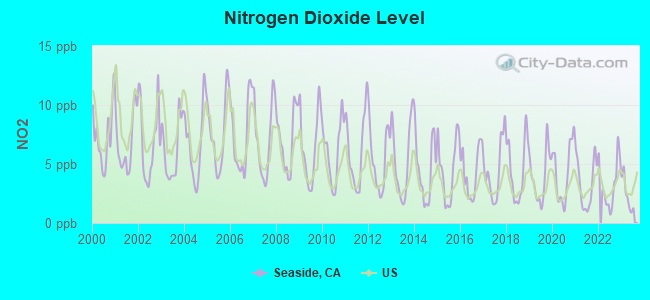
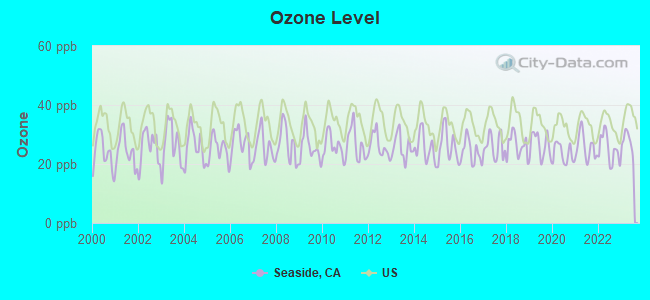
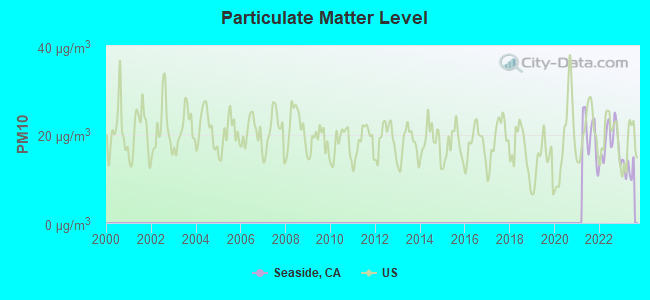
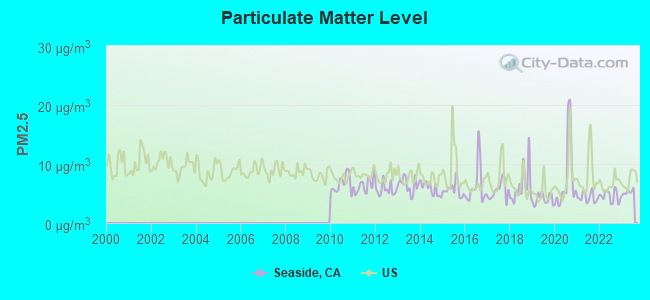
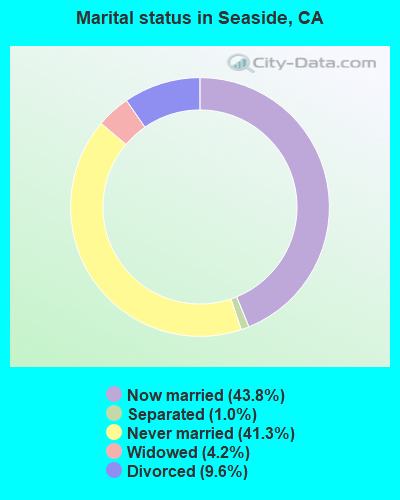
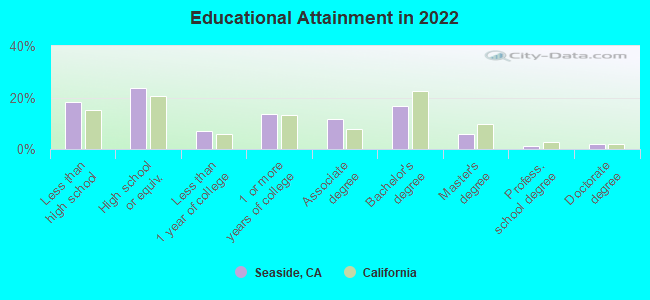
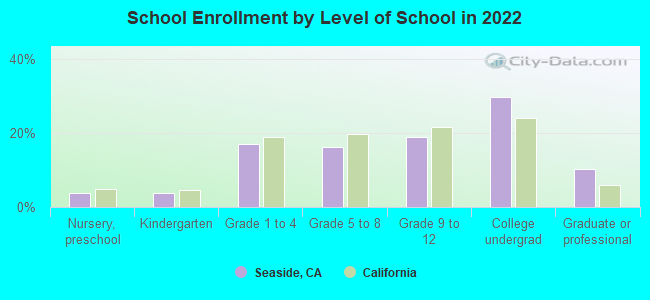
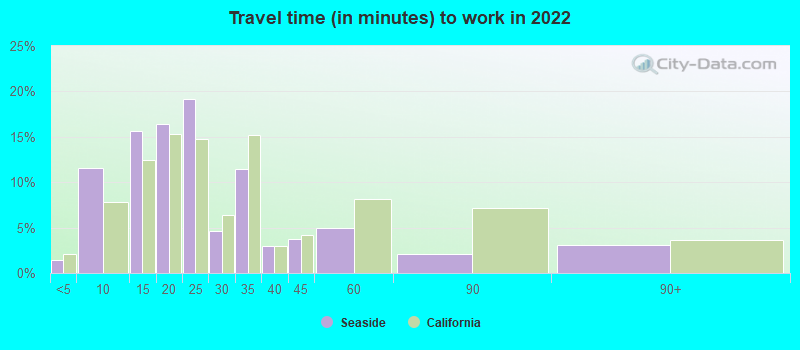
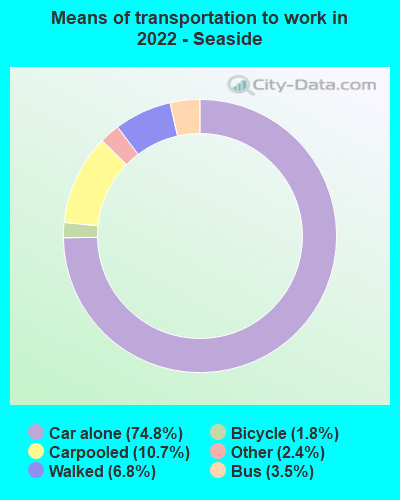
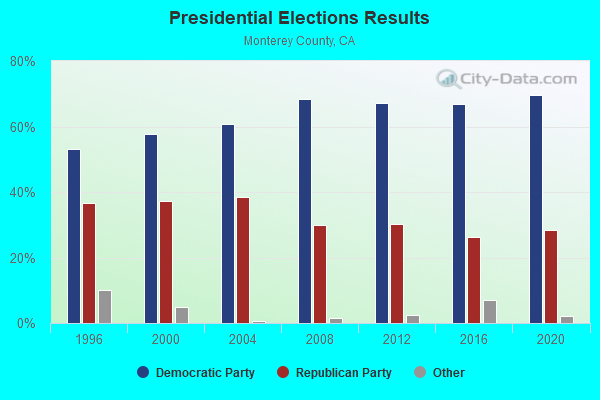
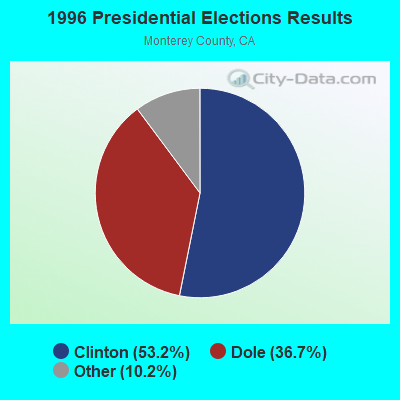
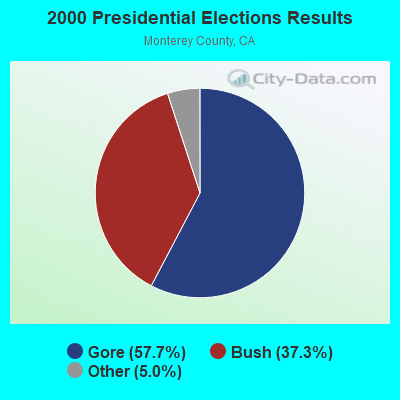
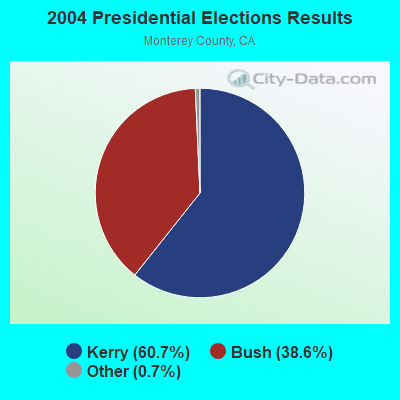
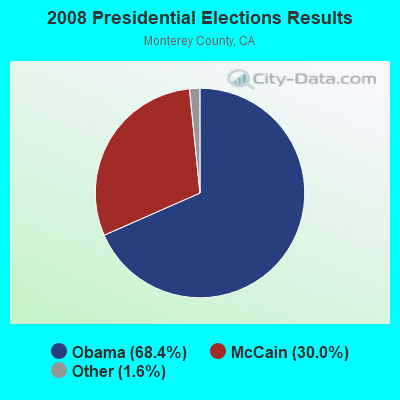
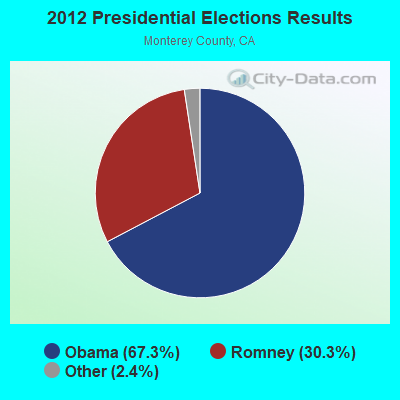
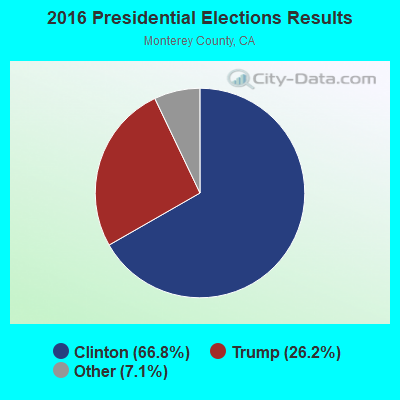
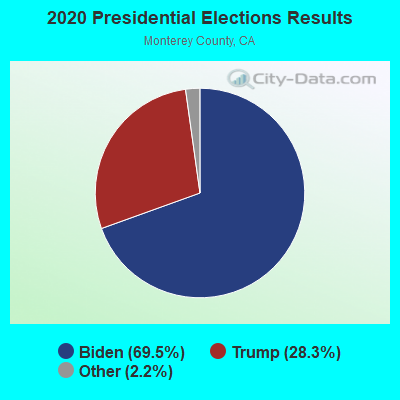
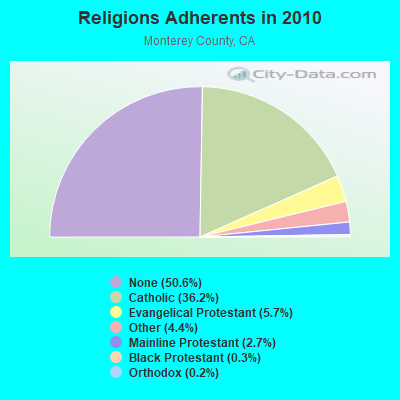
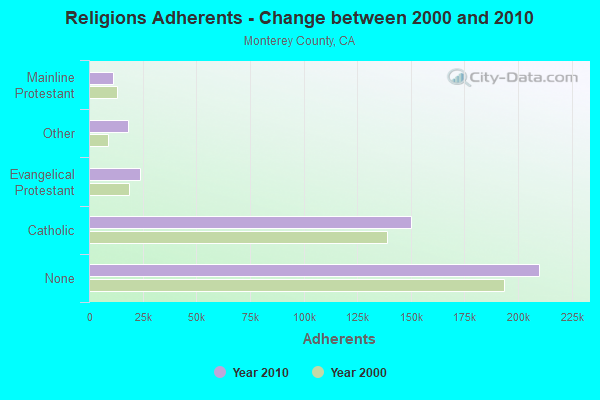
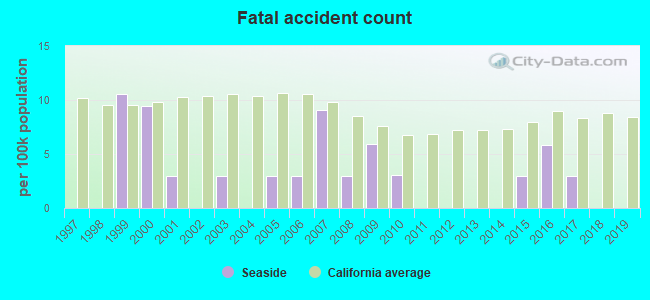
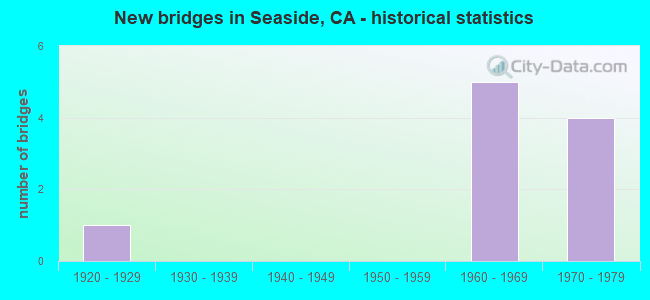
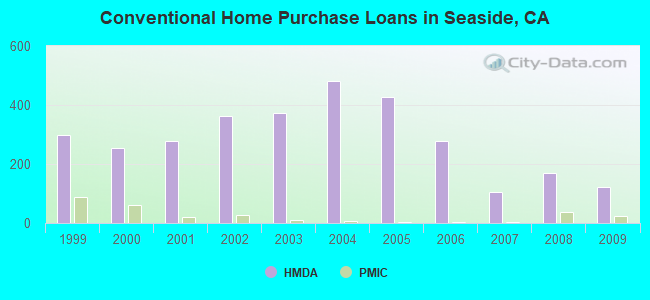
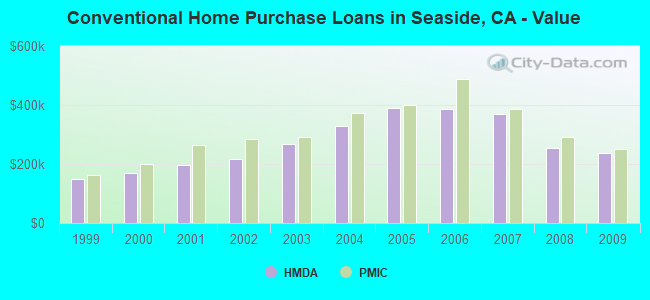
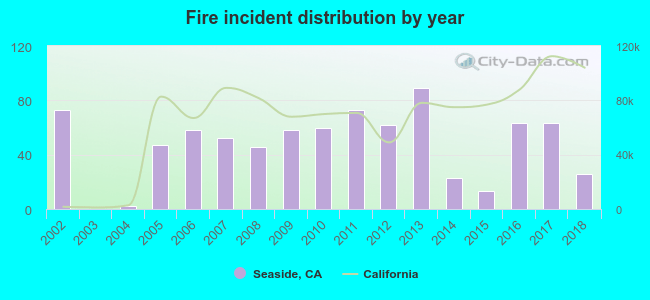 Based on the data from the years 2002 - 2018 the average number of fire incidents per year is 48. The highest number of fires - 89 took place in 2013, and the least - 0 in 2003. The data has a dropping trend.
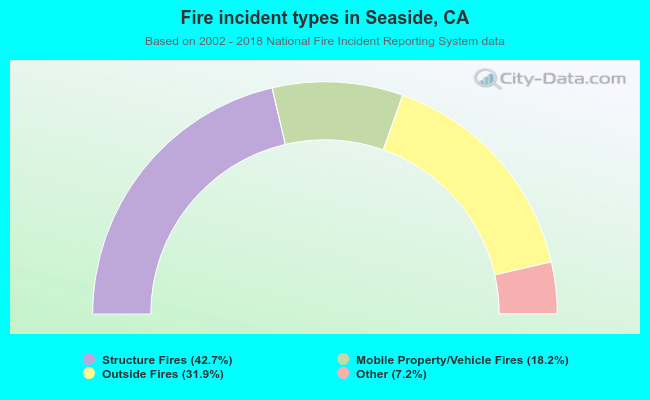 When looking into fire subcategories, the most incidents belonged to: Structure Fires (42.7%), and Outside Fires (31.9%).