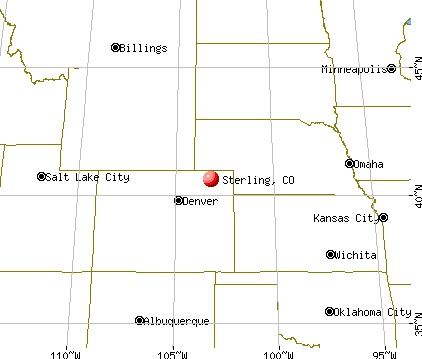
Sterling, Colorado

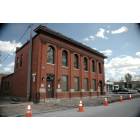
Sterling: Courthouse
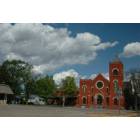
Sterling: church

Sterling: Sugar Beet Train

Sterling: Elevator

Sterling: Sterling city limits seen from U.S. 138 southbound from Julesburg
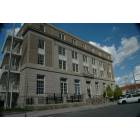
Sterling: Office Space
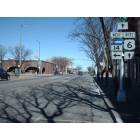
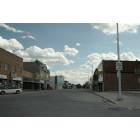
Sterling: 3rd Street

Sterling: sterling lake

Sterling: Main Street
Sterling: Post Office
Sterling: Main Street
- see
20
more - add
your
Submit your own pictures of this city and show them to the world
- OSM Map
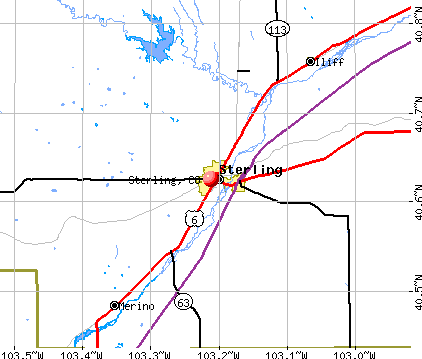
- General Map
- Google Map
- MSN Map
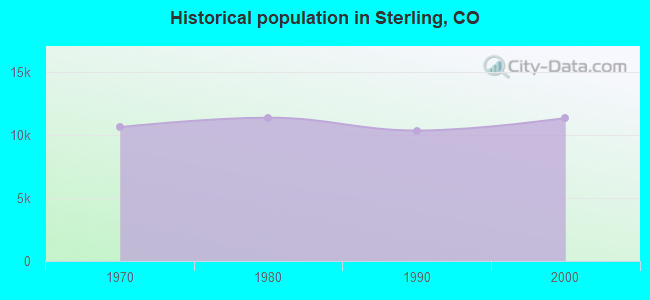
Population change since 2000: +15.3%
| Males: 7,145 | |
| Females: 5,957 |
| Median resident age: | 38.1 years |
| Colorado median age: | 37.7 years |
Zip codes: 80751.
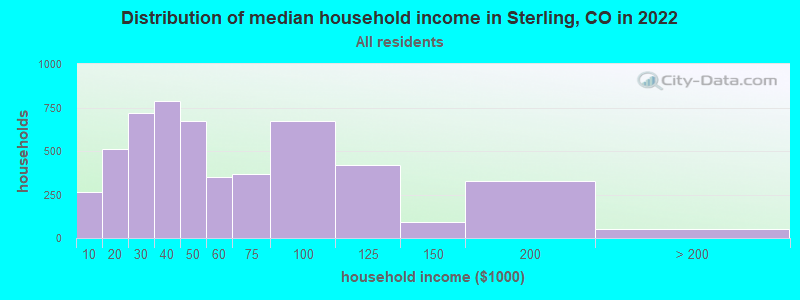
| Sterling: | $45,423 |
| CO: | $89,302 |
Estimated per capita income in 2022: $25,825 (it was $15,287 in 2000)
Sterling city income, earnings, and wages data
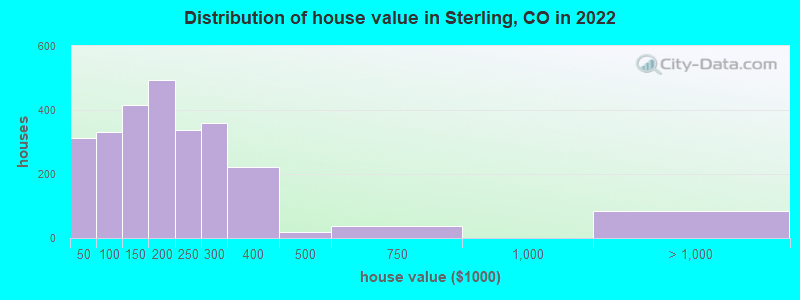
Estimated median house or condo value in 2022: $208,610 (it was $75,800 in 2000)
| Sterling: | $208,610 |
| CO: | $531,100 |
Median gross rent in 2022: $865.
(14.9% for White Non-Hispanic residents, 11.3% for Black residents, 10.7% for Hispanic or Latino residents, 1.6% for other race residents, 13.0% for two or more races residents)
Detailed information about poverty and poor residents in Sterling, CO
Compare current foreclosures near Sterling, CO:
| Photo | Address | Area | Beds / Baths | Price | Details |
|---|---|---|---|---|---|

|
#1
Main St
Sterling, CO 80751
|
1,164 sq. feet
|
1 baths 2 beds |
show details | |

|
#2
Denver St
Sterling, CO 80751
|
775 sq. feet
|
1 baths 2 beds |
show details | |

|
#3
California St
Sterling, CO 80751
|
832 sq. feet
|
1 baths 2 beds |
show details | |

|
#4
Taylor St
Sterling, CO 80751
|
1,298 sq. feet
|
2 baths 3 beds |
show details | |

|
#5
Castle Dr
Sterling, CO 80751
|
1,216 sq. feet
|
2 baths 3 beds |
show details | |

|
#6
N 7th Ave
Sterling, CO 80751
|
1,264 sq. feet
|
1 baths 3 beds |
show details | |

|
#7
S 5th Ave
Sterling, CO 80751
|
910 sq. feet
|
1 baths 1 beds |
show details | |

|
#8
Jackson St
Sterling, CO 80751
|
1,824 sq. feet
|
1 baths 2 beds |
show details | |

|
#9
W Main St
Sterling, CO 80751
|
1,164 sq. feet
|
1 baths 2 beds |
show details | |

|
#10
Skyline Ct
Sterling, CO 80751
|
1,522 sq. feet
|
2 baths 3 beds |
show details |
| Photo | Address | Area | Beds / Baths | Price | Details |
|---|---|---|---|---|---|

|
#11
S 3rd Ave
Sterling, CO 80751
|
1,107 sq. feet
|
2 baths 2 beds |
show details | |

|
#12
Glenora St
Sterling, CO 80751
|
2,120 sq. feet
|
2 baths 3 beds |
show details | |

|
#13
California St
Sterling, CO 80751
|
2,424 sq. feet
|
3 baths 3 beds |
show details | |

|
#14
N 7th Ave
Sterling, CO 80751
|
1,264 sq. feet
|
1 baths 3 beds |
show details | |

|
#15
Denver St
Sterling, CO 80751
|
1,564 sq. feet
|
1 baths 2 beds |
show details | |

|
#16
Dawes St
Sterling, CO 80751
|
2,408 sq. feet
|
2 baths 3 beds |
show details | |

|
#17
Dawes St
Sterling, CO 80751
|
2,408 sq. feet
|
2 baths 3 beds |
show details | |

|
#18
King St
Sterling, CO 80751
|
1,088 sq. feet
|
1 baths 3 beds |
show details | |

|
#19
Castle Dr
Sterling, CO 80751
|
- sq. feet
|
- baths - beds |
show details | |

|
#20
County Road 33
Sterling, CO 80751
|
- sq. feet
|
- baths - beds |
show details |
| Photo | Address | Area | Beds / Baths | Price | Details |
|---|---|---|---|---|---|

|
#21
County Road 24
Sterling, CO 80751
|
- sq. feet
|
- baths - beds |
show details | |

|
#22
N 6th Ave
Sterling, CO 80751
|
- sq. feet
|
- baths - beds |
show details | |

|
#23
County Road 30
Sterling, CO 80751
|
- sq. feet
|
- baths - beds |
show details | |

|
#24
N Division Ave
Sterling, CO 80751
|
- sq. feet
|
- baths - beds |
show details | |

|
#25
Park St
Sterling, CO 80751
|
- sq. feet
|
- baths - beds |
show details | |

|
#26
County Road 59
Iliff, CO 80736
|
1,076 sq. feet
|
1 baths 2 beds |
show details | |

|
#27
Sterling Ave
Padroni, CO 80745
|
- sq. feet
|
- baths - beds |
show details | |

|
#28
W Logan Ave
Iliff, CO 80736
|
- sq. feet
|
- baths - beds |
show details | |

|
#29
Logan Ave
Iliff, CO 80736
|
- sq. feet
|
- baths - beds |
show details | |

|
Check over 1 million property listings on Foreclosure.com!
|
browse all offers | |||


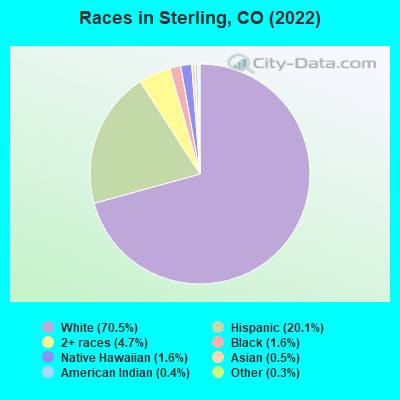
- 9,60370.5%White alone
- 2,73720.1%Hispanic
- 6384.7%Two or more races
- 2181.6%Black alone
- 2141.6%Native Hawaiian and Other
Pacific Islander alone - 620.5%Asian alone
- 580.4%American Indian alone
- 420.3%Other race alone
According to our research of Colorado and other state lists, there were 139 registered sex offenders living in Sterling, Colorado as of June 15, 2024.
The ratio of all residents to sex offenders in Sterling is 104 to 1.
Type |
2009 |
2010 |
2011 |
2012 |
2013 |
2014 |
2015 |
2016 |
2017 |
2018 |
2019 |
2020 |
2021 |
2022 |
|---|---|---|---|---|---|---|---|---|---|---|---|---|---|---|
| Murders (per 100,000) | 0 (0.0) | 0 (0.0) | 0 (0.0) | 1 (6.7) | 0 (0.0) | 2 (13.7) | 0 (0.0) | 0 (0.0) | 1 (7.2) | 1 (7.2) | 0 (0.0) | 0 (0.0) | 1 (7.1) | 0 (0.0) |
| Rapes (per 100,000) | 5 (39.1) | 18 (121.8) | 2 (13.3) | 3 (20.1) | 17 (115.7) | 25 (171.4) | 28 (192.1) | 24 (170.4) | 20 (143.3) | 31 (222.6) | 19 (140.0) | 15 (103.7) | 22 (157.1) | 8 (58.3) |
| Robberies (per 100,000) | 1 (7.8) | 0 (0.0) | 0 (0.0) | 3 (20.1) | 1 (6.8) | 5 (34.3) | 4 (27.4) | 2 (14.2) | 3 (21.5) | 2 (14.4) | 3 (22.1) | 3 (20.7) | 4 (28.6) | 2 (14.6) |
| Assaults (per 100,000) | 43 (335.9) | 45 (304.5) | 11 (73.2) | 24 (160.8) | 10 (68.1) | 29 (198.8) | 31 (212.7) | 23 (163.3) | 44 (315.3) | 64 (459.5) | 43 (316.8) | 49 (338.9) | 32 (228.5) | 30 (218.8) |
| Burglaries (per 100,000) | 74 (578.1) | 119 (805.3) | 90 (598.6) | 110 (736.8) | 114 (776.0) | 60 (411.4) | 77 (528.3) | 92 (653.1) | 84 (601.9) | 77 (552.8) | 94 (692.6) | 94 (650.1) | 87 (621.2) | 60 (437.5) |
| Thefts (per 100,000) | 249 (1,945) | 293 (1,983) | 255 (1,696) | 310 (2,076) | 354 (2,410) | 369 (2,530) | 457 (3,136) | 381 (2,705) | 351 (2,515) | 387 (2,779) | 356 (2,623) | 400 (2,766) | 352 (2,513) | 284 (2,071) |
| Auto thefts (per 100,000) | 12 (93.8) | 19 (128.6) | 9 (59.9) | 11 (73.7) | 12 (81.7) | 17 (116.6) | 20 (137.2) | 29 (205.9) | 21 (150.5) | 33 (236.9) | 18 (132.6) | 38 (262.8) | 30 (214.2) | 24 (175.0) |
| Arson (per 100,000) | 6 (46.9) | 2 (13.5) | 3 (20.0) | 1 (6.7) | 2 (13.6) | 0 (0.0) | 4 (27.4) | 5 (35.5) | 4 (28.7) | 3 (21.5) | 7 (51.6) | 5 (34.6) | 4 (28.6) | 4 (29.2) |
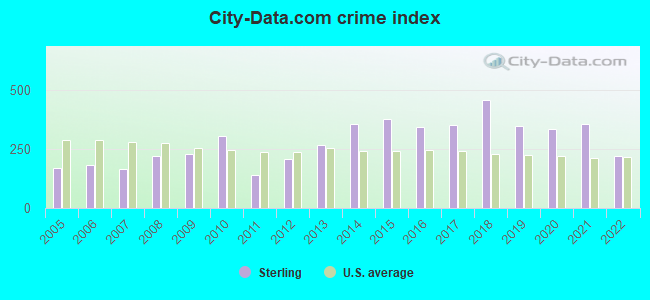
| City-Data.com crime index | 226.6 | 304.3 | 139.8 | 208.2 | 265.5 | 353.9 | 377.9 | 343.6 | 353.3 | 457.4 | 346.0 | 334.2 | 355.3 | 222.3 |
The City-Data.com crime index weighs serious crimes and violent crimes more heavily. Higher means more crime, U.S. average is 246.1. It adjusts for the number of visitors and daily workers commuting into cities.
Crime rate in Sterling detailed stats: murders, rapes, robberies, assaults, burglaries, thefts, arson
Full-time law enforcement employees in 2021, including police officers: 24 (19 officers - 14 male; 5 female).
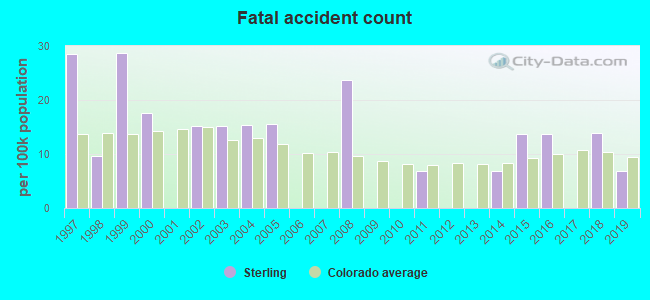
| Officers per 1,000 residents here: | 1.36 |
| Colorado average: | 2.14 |
 Recent articles from our blog. Our writers, many of them Ph.D. graduates or candidates, create easy-to-read articles on a wide variety of topics.

 | What's the commute like between Fort Morgan and Sterling? (4 replies) |
| Can we discuss HOAs? (97 replies) |
| Lamar or La Junta???? (18 replies) |
| COVID-19 General Colorado Thread (845 replies) |
| Sterling, Limon, Buena Vista, or Trinidad for job? (6 replies) |
| Sterling, Colorado fire (1 reply) |
Latest news from Sterling, CO collected exclusively by city-data.com from local newspapers, TV, and radio stations
Ancestries: German (27.2%), English (8.2%), Scotch-Irish (3.5%), Irish (2.6%), American (2.1%), European (2.0%).
Current Local Time: MST time zone
Incorporated on 12/3/1884
Elevation: 3939 feet
Land area: 6.87 square miles.
Population density: 1,907 people per square mile (low).
515 residents are foreign born (2.7% Latin America, 0.6% Africa).
| This city: | 3.8% |
| Colorado: | 9.5% |
Median real estate property taxes paid for housing units with mortgages in 2022: $1,097 (0.5%)
Median real estate property taxes paid for housing units with no mortgage in 2022: $770 (0.4%)
Nearest city with pop. 50,000+: Greeley, CO  (80.8 miles , pop. 76,930).
Nearest city with pop. 200,000+: Aurora, CO (106.1 miles , pop. 276,393).
Nearest city with pop. 1,000,000+: Dallas, TX (647.6 miles , pop. 1,188,580).
Nearest cities:
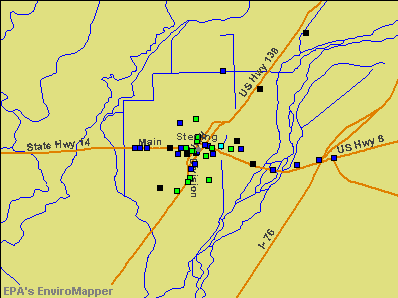
Latitude: 40.63 N, Longitude: 103.21 W
Daytime population change due to commuting: +1,446 (+10.6%)
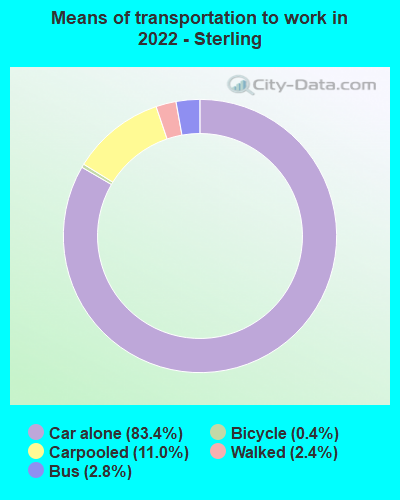
Workers who live and work in this city: 5,345 (83.6%)
Area code: 970

Sterling, Colorado accommodation & food services, waste management - Economy and Business Data
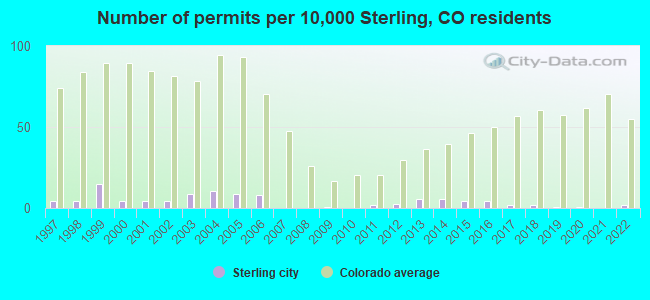
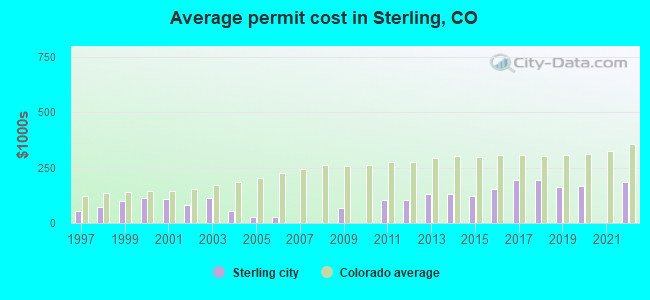
Single-family new house construction building permits:
- 2022: 2 buildings, average cost: $183,500
- 2020: 1 building, cost: $169,000
- 2019: 1 building, cost: $163,000
- 2018: 2 buildings, average cost: $196,000
- 2017: 2 buildings, average cost: $196,000
- 2016: 5 buildings, average cost: $154,000
- 2015: 5 buildings, average cost: $122,200
- 2014: 6 buildings, average cost: $128,500
- 2013: 6 buildings, average cost: $128,500
- 2012: 3 buildings, average cost: $102,200
- 2011: 2 buildings, average cost: $102,200
- 2009: 1 building, cost: $66,000
- 2006: 9 buildings, average cost: $29,000
- 2005: 10 buildings, average cost: $29,000
- 2004: 12 buildings, average cost: $52,100
- 2003: 10 buildings, average cost: $111,400
- 2002: 5 buildings, average cost: $79,900
- 2001: 5 buildings, average cost: $106,600
- 2000: 5 buildings, average cost: $112,900
- 1999: 17 buildings, average cost: $98,300
- 1998: 5 buildings, average cost: $73,800
- 1997: 5 buildings, average cost: $52,800
| Here: | 2.5% |
| Colorado: | 3.2% |
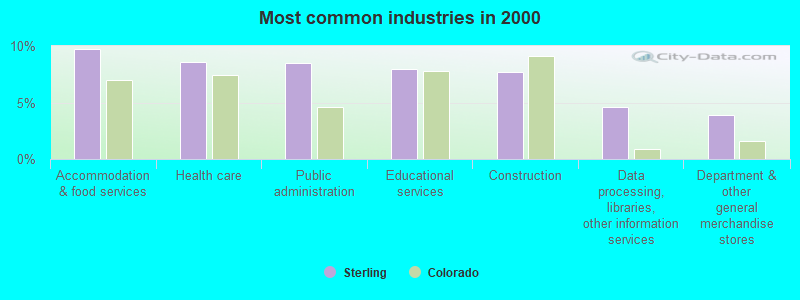
- Accommodation & food services (9.8%)
- Health care (8.6%)
- Public administration (8.5%)
- Educational services (7.9%)
- Construction (7.7%)
- Data processing, libraries, other information services (4.6%)
- Department & other general merchandise stores (3.9%)
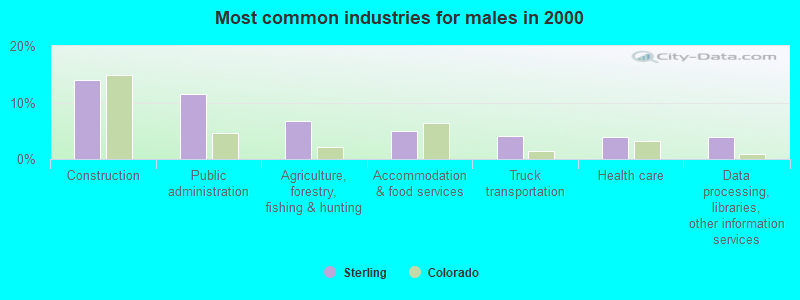
- Construction (14.1%)
- Public administration (11.5%)
- Agriculture, forestry, fishing & hunting (6.7%)
- Accommodation & food services (4.9%)
- Truck transportation (4.1%)
- Health care (4.0%)
- Data processing, libraries, other information services (3.9%)
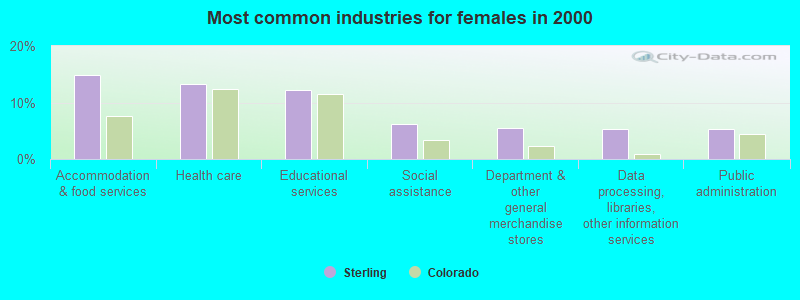
- Accommodation & food services (14.8%)
- Health care (13.4%)
- Educational services (12.2%)
- Social assistance (6.2%)
- Department & other general merchandise stores (5.6%)
- Data processing, libraries, other information services (5.3%)
- Public administration (5.3%)
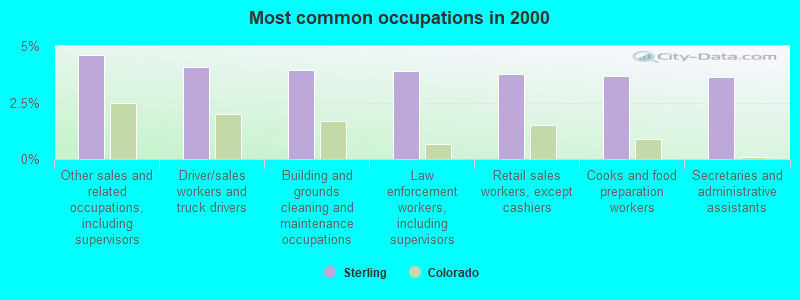
- Other sales and related occupations, including supervisors (4.6%)
- Driver/sales workers and truck drivers (4.1%)
- Building and grounds cleaning and maintenance occupations (3.9%)
- Law enforcement workers, including supervisors (3.9%)
- Retail sales workers, except cashiers (3.7%)
- Cooks and food preparation workers (3.7%)
- Secretaries and administrative assistants (3.6%)
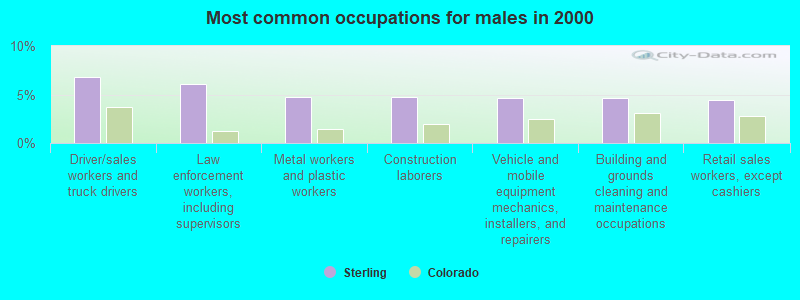
- Driver/sales workers and truck drivers (6.8%)
- Law enforcement workers, including supervisors (6.1%)
- Metal workers and plastic workers (4.8%)
- Construction laborers (4.7%)
- Vehicle and mobile equipment mechanics, installers, and repairers (4.7%)
- Building and grounds cleaning and maintenance occupations (4.6%)
- Retail sales workers, except cashiers (4.5%)
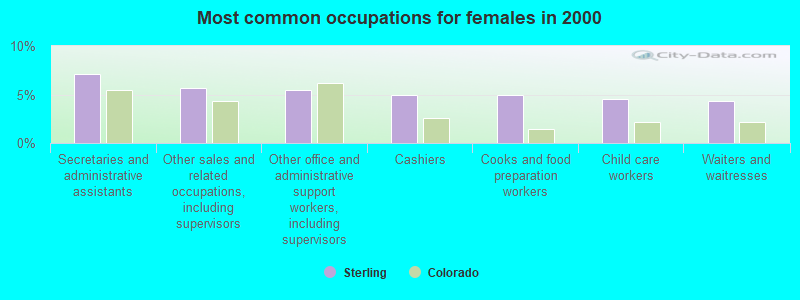
- Secretaries and administrative assistants (7.2%)
- Other sales and related occupations, including supervisors (5.7%)
- Other office and administrative support workers, including supervisors (5.4%)
- Cashiers (4.9%)
- Cooks and food preparation workers (4.9%)
- Child care workers (4.5%)
- Waiters and waitresses (4.3%)
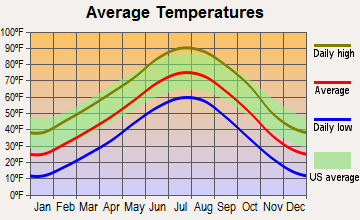
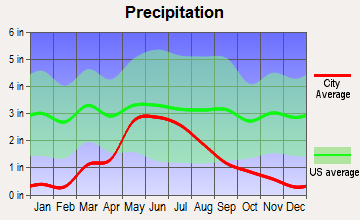
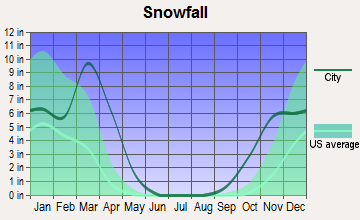
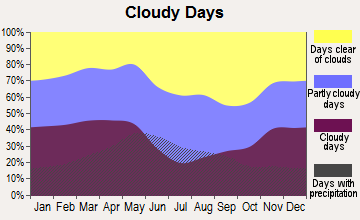
Average climate in Sterling, Colorado
Based on data reported by over 4,000 weather stations


|
|

Tornado activity:
Sterling-area historical tornado activity is above Colorado state average. It is 17% greater than the overall U.S. average.
On 8/15/1974, a category F3 (max. wind speeds 158-206 mph) tornado 4.4 miles away from the Sterling city center caused between $50,000 and $500,000 in damages.
On 7/5/2000, a category F3 tornado 25.9 miles away from the city center injured 2 people and caused $750,000 in damages.
Earthquake activity:
Sterling-area historical earthquake activity is significantly above Colorado state average. It is 513% greater than the overall U.S. average.On 8/18/1959 at 06:37:13, a magnitude 7.7 (7.7 UK, Class: Major, Intensity: VIII - XII) earthquake occurred 466.5 miles away from the city center, causing $26,000,000 total damage
On 10/18/1984 at 15:30:23, a magnitude 5.5 (5.4 MB, 5.1 MS, 5.5 ML, Class: Moderate, Intensity: VI - VII) earthquake occurred 172.8 miles away from Sterling center
On 8/23/2011 at 05:46:18, a magnitude 5.3 (5.3 MW, Depth: 2.5 mi) earthquake occurred 259.1 miles away from the city center
On 10/28/1983 at 14:06:06, a magnitude 7.3 (6.2 MB, 7.3 MS, 7.0 MW) earthquake occurred 591.1 miles away from the city center, causing 2 deaths (2 shaking deaths) and 3 injuries, causing $15,000,000 total damage
On 9/8/1984 at 00:59:31, a magnitude 5.1 (5.1 MB) earthquake occurred 285.1 miles away from the city center
On 8/10/2005 at 22:08:22, a magnitude 5.0 (5.0 MW, Depth: 3.1 mi) earthquake occurred 269.0 miles away from Sterling center
Magnitude types: body-wave magnitude (MB), local magnitude (ML), surface-wave magnitude (MS), moment magnitude (MW)
Natural disasters:
The number of natural disasters in Logan County (10) is smaller than the US average (15).Major Disasters (Presidential) Declared: 7
Emergencies Declared: 2
Causes of natural disasters: Floods: 7, Storms: 6, Landslides: 3, Mudslides: 3, Tornadoes: 2, Heavy Rain: 1, Hurricane: 1, Snow: 1, Other: 1 (Note: some incidents may be assigned to more than one category).
Hospitals and medical centers in Sterling:
- LHS HOME AND COMMUNITY CARE HOSPICE (615 FAIRHURST, P O BOX 3500)
- STERLING REGIONAL MEDCENTER (Voluntary non-profit - Other, 615 FAIRHURST ST)
- DEVONSHIRE ACRES (1330 NORTH SIDNEY AVENUE)
- STERLING LIVING CENTER (1420 SOUTH 3RD AVENUE)
- NORTHEASTERN COLORADO DIALYSIS (603 HOLLY DRIVE)
- NORTHEAST PLAINS HOME HEALTH CARE LLC (228 S 3RD STREET #3)
- STERLING MEDCARE HOME HEALTH INC (614 S 10TH AVE)
Airports and heliports located in Sterling:
- Sterling Municipal Airport (STK) (Runways: 2, Air Taxi Ops: 196, Itinerant Ops: 1,311, Local Ops: 526, Military Ops: 132)
- Mertens Airport (3CO2) (Runways: 1)
- Sterling Regional Med Center Heliport (3CO3)
College/University in Sterling:
Colleges/universities with over 2000 students nearest to Sterling:
- University of Northern Colorado (about 80 miles; Greeley, CO; Full-time enrollment: 11,469)
- Aims Community College (about 83 miles; Greeley, CO; FT enrollment: 3,598)
- Laramie County Community College (about 89 miles; Cheyenne, WY; FT enrollment: 3,288)
- Colorado State University-Fort Collins (about 99 miles; Fort Collins, CO; FT enrollment: 25,099)
- Community College of Aurora (about 105 miles; Aurora, CO; FT enrollment: 4,730)
- Front Range Community College (about 109 miles; Westminster, CO; FT enrollment: 14,756)
- Regis University (about 113 miles; Denver, CO; FT enrollment: 6,975)
Public high school in Sterling:
- STERLING HIGH SCHOOL (Students: 653, Location: 407 WEST BROADWAY, Grades: 9-12)
Public elementary/middle schools in Sterling:
- STERLING MIDDLE SCHOOL (Students: 503, Location: 1177 PAWNEE STREET, Grades: 6-8)
- AYRES ELEMENTARY SCHOOL (Students: 467, Location: 1812 ROBIN ROAD, Grades: KG-2)
- CAMPBELL ELEMENTARY SCHOOL (Location: 902 CLARK, Grades: 3-5)
Private elementary/middle school in Sterling:
Points of interest:
Notable locations in Sterling: Camp Bright (A), Life Care Medical Ambulance (B), Overland Trail Museum (C), Sterling Fire Department (D). Display/hide their locations on the map
Parks in Sterling include: Overland Trail Park and Museum (1), Columbine Park (2), Cheairs Park (3), Pioneer Park (4). Display/hide their locations on the map
Tourist attractions: Tourist Information Center (12510 County Road 370) (1), Roundup Music CO (219 North 10th Avenue) (2). Display/hide their approximate locations on the map
Hotels: First Interstate Inn (20930 US Highway 6) (1), Best Western Sundowner (Overland Trail Street Route 1) (2), Fountain Lodge (619 North 3) (3), Country Kitchen (USHighway 6 & # # I76) (4), Crest Motel (516 South Division Avenue) (5), Days Inn (12881 Highway 61) (6), Fireside Inn (229 South Front Street) (7), Blue Bird Inn (300 Iris Drive) (8), Ramada Inn (Us Highway 6 And I76) (9). Display/hide their approximate locations on the map
Birthplace of: Don Marostica - Politician, Frederick Libby - World War I flying ace, Donald G. Brotzman - Congressman for Colorado, Cynthia Makris - Singer, Dustin Fitzsimons - Actor.
Drinking water stations with addresses in Sterling and their reported violations in the past:
REATA PETROLEUM CORP THE (Population served: 262, Groundwater):Past health violations:NORTHEASTERN 18 (Population served: 142, Groundwater):Past monitoring violations:
- MCL, Average - Between JAN-2011 and DEC-2011, Contaminant: Nitrate. Follow-up actions: St Public Notif requested (APR-11-2011), St Boil Water Order (APR-11-2011), St Violation/Reminder Notice (APR-11-2011), St Public Notif received (APR-12-2011), St Compliance achieved (JUL-19-2011)
- One routine major monitoring violation
Past monitoring violations:BUFFALO HILLS CG (Population served: 96, Groundwater):
- One routine major monitoring violation
- One regular monitoring violation
Past health violations:Past monitoring violations:
- MCL, Monthly (TCR) - In JUN-2012, Contaminant: Coliform. Follow-up actions: St Boil Water Order (JUN-28-2012), St Public Notif received (JUN-29-2012), St Public Notif requested (JUL-02-2012), St Violation/Reminder Notice (JUL-02-2012)
- MCL, Monthly (TCR) - In JUL-2005, Contaminant: Coliform. Follow-up actions: St Public Notif requested (JUL-18-2005), St Violation/Reminder Notice (JUL-18-2005), St Public Notif received (AUG-17-2005), St Compliance achieved (JAN-11-2007)
- Monitoring and Reporting (DBP) - Between JUL-2014 and SEP-2014, Contaminant: Chlorine. Follow-up actions: St Violation/Reminder Notice (SEP-02-2014), St Public Notif requested (SEP-02-2014)
- Follow-up Or Routine LCR Tap M/R - In OCT-01-2011, Contaminant: Lead and Copper Rule. Follow-up actions: St Public Notif requested (DEC-15-2011), St Violation/Reminder Notice (DEC-15-2011), St Public Notif received (JUN-29-2012), St Compliance achieved (OCT-02-2012)
- Follow-up Or Routine LCR Tap M/R - In OCT-01-2006, Contaminant: Lead and Copper Rule. Follow-up actions: St Public Notif requested (FEB-09-2007), St Violation/Reminder Notice (FEB-09-2007), St Compliance achieved (AUG-26-2008)
- 4 routine major monitoring violations
- 67 regular monitoring violations
Drinking water stations with addresses in Sterling that have no violations reported:
- NORTH STERLING RES SP SOUTH (Population served: 462, Primary Water Source Type: Groundwater)
- NORTH STERLING RES SP NORTH (Population served: 288, Primary Water Source Type: Groundwater)
| This city: | 2.2 people |
| Colorado: | 2.5 people |
| This city: | 55.5% |
| Whole state: | 63.9% |
| This city: | 6.9% |
| Whole state: | 6.5% |
Likely homosexual households (counted as self-reported same-sex unmarried-partner households)
- Lesbian couples: 0.2% of all households
- Gay men: 0.2% of all households
People in group quarters in Sterling in 2010:
- 3,224 people in state prisons
- 391 people in college/university student housing
- 114 people in nursing facilities/skilled-nursing facilities
- 51 people in group homes intended for adults
- 25 people in correctional facilities intended for juveniles
- 3 people in other noninstitutional facilities
People in group quarters in Sterling in 2000:
- 338 people in college dormitories (includes college quarters off campus)
- 188 people in nursing homes
- 40 people in local jails and other confinement facilities (including police lockups)
- 19 people in homes for the mentally retarded
- 6 people in homes for the mentally ill
- 5 people in other noninstitutional group quarters
Banks with branches in Sterling (2011 data):
- Bank of Colorado: Sterling Drive Up Branch at 329 W Main Street, branch established on 1995/04/17; Sterling Branch at South 3rd And Ash Street, branch established on 1912/01/01. Info updated 2006/09/15: Bank assets: $2,140.7 mil, Deposits: $1,783.1 mil, headquarters in Fort Collins, CO, positive income, Commercial Lending Specialization, 40 total offices, Holding Company: Pinnacle Bancorp, Inc.
- Bank of the West: Sterling Branch at 130 North Third Street, branch established on 1962/11/16. Info updated 2009/11/16: Bank assets: $62,408.3 mil, Deposits: $43,995.2 mil, headquarters in San Francisco, CA, positive income, 647 total offices, Holding Company: Bnp Paribas
- Colorado Community Bank: Sterling Branch at 122 West Main Street, branch established on 1996/10/01. Info updated 2010/04/07: Bank assets: $527.8 mil, Deposits: $465.2 mil, headquarters in Yuma, CO, positive income, Commercial Lending Specialization, 18 total offices, Holding Company: Washington Investment Company
- Academy Bank, National Association: Sterling Branch at 1510 West Main Street, branch established on 2005/09/28. Info updated 2008/06/10: Bank assets: $282.1 mil, Deposits: $218.0 mil, headquarters in Colorado Springs, CO, positive income, Commercial Lending Specialization, 54 total offices, Holding Company: Dickinson Financial Corporation Ii
- Wells Fargo Bank, National Association: Sterling Branch at 129 South Third Street, branch established on 1925/02/14. Info updated 2011/04/05: Bank assets: $1,161,490.0 mil, Deposits: $905,653.0 mil, headquarters in Sioux Falls, SD, positive income, 6395 total offices, Holding Company: Wells Fargo & Company
- Equitable Savings and Loan Association: Equitable Savings And Loan Associati at 221 N 3rd St, branch established on 1921/01/01. Info updated 2011/07/21: Bank assets: $181.0 mil, Deposits: $141.8 mil, local headquarters, positive income, Mortgage Lending Specialization, 10 total offices
- KeyBank National Association: Sterling Branch at 115 N 3rd St, branch established on 2008/02/08. Info updated 2008/03/03: Bank assets: $86,198.8 mil, Deposits: $64,214.8 mil, headquarters in Cleveland, OH, positive income, Commercial Lending Specialization, 1067 total offices, Holding Company: Keycorp
For population 15 years and over in Sterling:
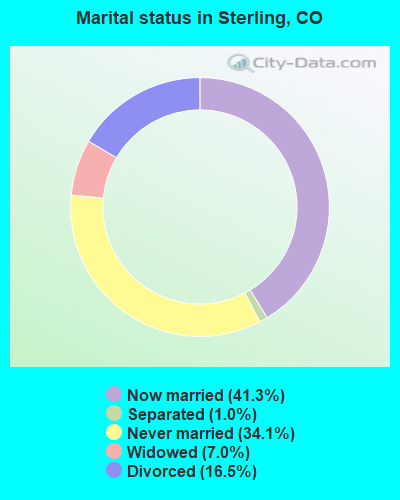
- Never married: 34.1%
- Now married: 41.3%
- Separated: 1.0%
- Widowed: 7.0%
- Divorced: 16.5%
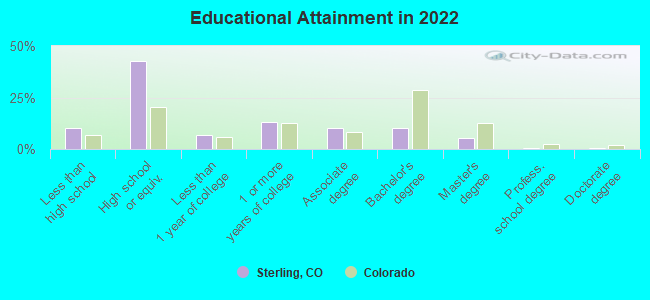
For population 25 years and over in Sterling:
- High school or higher: 88.9%
- Bachelor's degree or higher: 15.6%
- Graduate or professional degree: 6.0%
- Unemployed: 5.3%
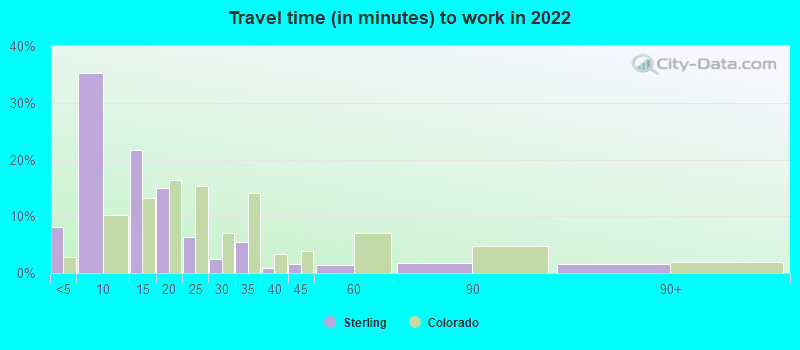
- Mean travel time to work (commute): 13.1 minutes
| Here: | 8.7 |
| Colorado average: | 11.1 |
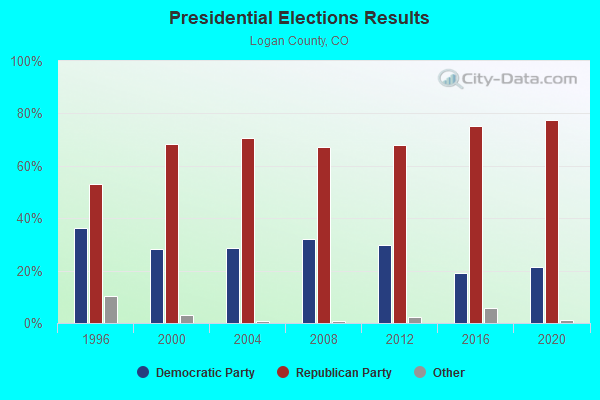
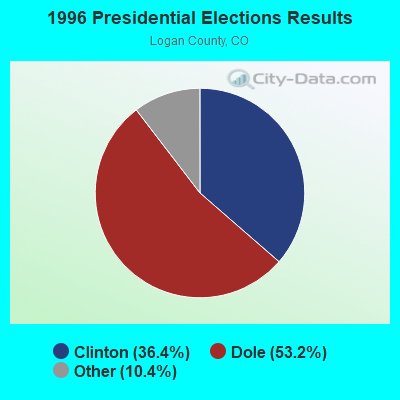


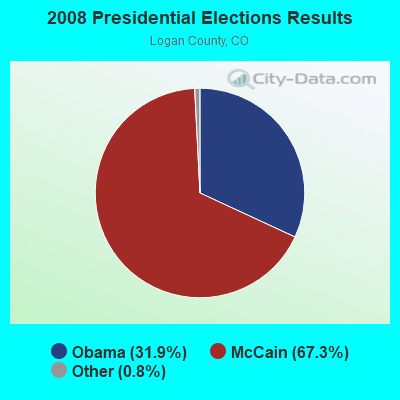

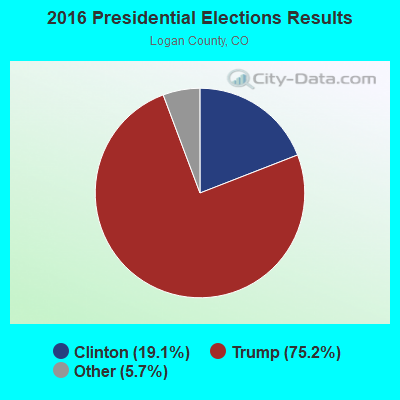

Graphs represent county-level data. Detailed 2008 Election Results
Religion statistics for Sterling, CO (based on Logan County data)
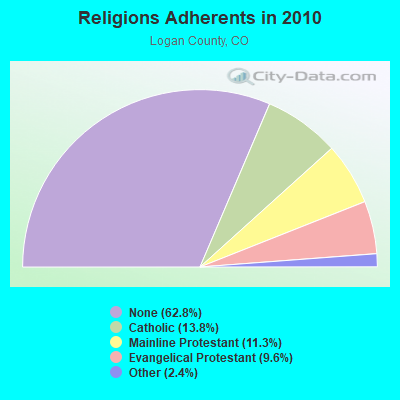
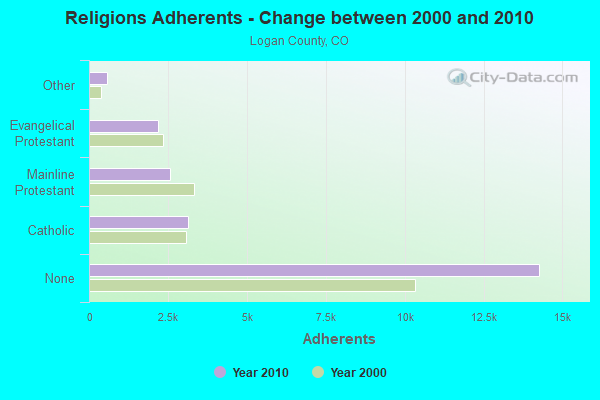
| Religion | Adherents | Congregations |
|---|---|---|
| Catholic | 3,136 | 3 |
| Mainline Protestant | 2,560 | 13 |
| Evangelical Protestant | 2,186 | 18 |
| Other | 555 | 1 |
| None | 14,272 | - |
Food Environment Statistics:
| Logan County: | 1.91 / 10,000 pop. |
| State: | 1.50 / 10,000 pop. |
| This county: | 0.48 / 10,000 pop. |
| State: | 0.15 / 10,000 pop. |
| Logan County: | 4.76 / 10,000 pop. |
| Colorado: | 3.13 / 10,000 pop. |
| Logan County: | 5.72 / 10,000 pop. |
| Colorado: | 8.99 / 10,000 pop. |
| Logan County: | 5.8% |
| Colorado: | 5.3% |
| Logan County: | 21.4% |
| State: | 18.4% |
| Logan County: | 13.8% |
| Colorado: | 9.6% |
Health and Nutrition:
| This city: | 49.3% |
| Colorado: | 49.4% |
| Here: | 46.3% |
| State: | 47.8% |
| This city: | 28.6 |
| State: | 28.5 |
| Sterling: | 20.2% |
| State: | 20.7% |
| Sterling: | 10.3% |
| Colorado: | 9.7% |
| Sterling: | 6.9 |
| Colorado: | 6.8 |
| This city: | 32.9% |
| Colorado: | 33.3% |
| Here: | 55.7% |
| Colorado: | 57.3% |
| Sterling: | 78.1% |
| State: | 80.2% |
More about Health and Nutrition of Sterling, CO Residents
| Local government employment and payroll (March 2022) | |||||
| Function | Full-time employees | Monthly full-time payroll | Average yearly full-time wage | Part-time employees | Monthly part-time payroll |
|---|---|---|---|---|---|
| Police Protection - Officers | 24 | $92,245 | $46,123 | 0 | $0 |
| Firefighters | 23 | $169,871 | $88,628 | 0 | $0 |
| Other and Unallocable | 19 | $107,884 | $68,137 | 6 | $7,622 |
| Water Supply | 16 | $52,034 | $39,026 | 0 | $0 |
| Parks and Recreation | 16 | $55,441 | $41,581 | 22 | $13,552 |
| Local Libraries | 7 | $19,758 | $33,871 | 4 | $4,429 |
| Streets and Highways | 7 | $26,487 | $45,406 | 0 | $0 |
| Financial Administration | 6 | $27,021 | $54,042 | 0 | $0 |
| Sewerage | 5 | $17,719 | $42,526 | 0 | $0 |
| Natural Resources | 5 | $18,139 | $43,534 | 0 | $0 |
| Solid Waste Management | 5 | $14,477 | $34,745 | 0 | $0 |
| Police - Other | 4 | $24,517 | $73,551 | 0 | $0 |
| Judicial and Legal | 3 | $11,583 | $46,332 | 0 | $0 |
| Airports | 2 | $7,976 | $47,856 | 0 | $0 |
| Other Government Administration | 2 | $14,698 | $88,188 | 7 | $2,916 |
| Electric Power | 1 | $9,707 | $116,484 | 0 | $0 |
| Fire - Other | 0 | $0 | 1 | $462 | |
| Totals for Government | 145 | $669,558 | $55,412 | 40 | $28,980 |
| Businesses in Sterling, CO | ||||
| Name | Count | Name | Count | |
|---|---|---|---|---|
| 7-Eleven | 1 | MasterBrand Cabinets | 4 | |
| Ace Hardware | 1 | Maurices | 1 | |
| Arby's | 1 | McDonald's | 1 | |
| Best Western | 1 | Nike | 3 | |
| Big O Tires | 1 | Payless | 1 | |
| Burger King | 1 | Pizza Hut | 1 | |
| Chevrolet | 1 | Quiznos | 1 | |
| Comfort Inn | 1 | RadioShack | 1 | |
| Curves | 1 | Ramada | 1 | |
| Dairy Queen | 1 | SONIC Drive-In | 1 | |
| FedEx | 2 | Sears | 1 | |
| Ford | 1 | Super 8 | 1 | |
| H&R Block | 1 | Travelodge | 1 | |
| Home Depot | 1 | U-Haul | 3 | |
| JCPenney | 1 | UPS | 4 | |
| Jones New York | 1 | Vans | 1 | |
| KFC | 1 | Village Inn | 1 | |
| La-Z-Boy | 1 | Walgreens | 1 | |
| Lane Furniture | 1 | Walmart | 1 | |
| Long John Silver's | 1 | Wendy's | 1 | |
Strongest AM radio stations in Sterling:
- KSTC (1230 AM; 1 kW; STERLING, CO; Owner: ARNOLD BROADCASTING CO., INC.)
- KSIR (1010 AM; 25 kW; BRUSH, CO; Owner: JMS BROADCASTING, LLC)
- KIMB (1260 AM; 50 kW; KIMBALL, NE; Owner: G & L INVESTMENTS, LLC)
- KLTT (670 AM; 50 kW; COMMERCE CITY, CO; Owner: KLZ RADIO, INC.)
- KKZN (760 AM; 50 kW; THORNTON, CO; Owner: JACOR BROADCASTING OF COLORADO, INC.)
- KOA (850 AM; 50 kW; DENVER, CO; Owner: JACOR BROADCASTING OF COLORADO, INC.)
- KMXA (1090 AM; 50 kW; AURORA, CO; Owner: ENTRAVISION HOLDINGS, LLC)
- KLMO (1060 AM; 30 kW; LONGMONT, CO; Owner: PILGRIM COMMUNICATIONS, INC.)
- KGAB (650 AM; 8 kW; ORCHARD VALLEY, WY; Owner: CITICASTERS LICENSES, L.P.)
- KRVN (880 AM; 50 kW; LEXINGTON, NE; Owner: NEBRASKA RURAL RADIO ASSOCIATION)
- KCUV (1510 AM; 25 kW; LITTLETON, CO; Owner: PEOPLE WIRELESS, INC.)
- KTWO (1030 AM; 50 kW; CASPER, WY; Owner: CITICASTERS LICENSES, L.P.)
- KJJL (1370 AM; 10 kW; CHEYENNE, WY; Owner: CHRISTUS BROADCASTING, INC.)
Strongest FM radio stations in Sterling:
- KNNG (104.7 FM; STERLING, CO; Owner: ARNOLD BROADCASTING CO., INC.)
- KPMX (105.7 FM; STERLING, CO; Owner: JMS BROADCASTING, LLC)
- K203DD (88.5 FM; STERLING, CO; Owner: CALVARY CHAPEL OF TWIN FALLS, INC.)
- KBRU-FM (101.7 FM; FORT MORGAN, CO; Owner: ON-AIR FAMILY, LLC)
TV broadcast stations around Sterling:
- KUPN (Channel 3; STERLING, CO; Owner: CHANNEL 20 TV COMPANY)
- K44FL (Channel 44; STERLING,S.LOGAN CTY, CO; Owner: BOARD OF LOGAN COUNTY COMMISSIONERS)
- K46CY (Channel 46; STERLING, CO; Owner: BOARD OF LOGAN COUNTY COMMISSIONERS)
- K48DQ (Channel 48; STERLING,S.LOGAN CTY, CO; Owner: BOARD OF LOGAN COUNTY COMMISSIONERS)
- K50EE (Channel 50; STERLING,S.LOGAN CTY, CO; Owner: BOARD OF LOGAN COUNTY COMMISSIONERS)
- K52EW (Channel 52; STERLING,S.LOGAN CTY, CO; Owner: BOARD OF LOGAN COUNTY COMMISSIONERS)
- K54GJ (Channel 54; STERLING, CO; Owner: BOARD OF LOGAN COUNTY COMMISSIONERS)
- K56GL (Channel 56; STERLING, ETC., CO; Owner: BOARD OF LOGAN COUNTY COMMISSIONERS)
- K58GH (Channel 58; STERLING, CO; Owner: BOARD OF LOGAN COUNTY COMMISSIONERS)
- K28FW (Channel 28; PEETZ & N. LOGAN CTY, CO; Owner: BOARD OF LOGAN COUNTY COMMISSIONERS)
- K33FI (Channel 33; AKRON, CO; Owner: BOARD OF WASHINGTON COUNTY COMMISSIONERS)
- K43FS (Channel 43; AKRON, CO; Owner: BOARD OF WASHINGTON COUNTY COMMISSIONERS)
- K35FI (Channel 35; AKRON, CO; Owner: BOARD OF WASHINGTON COUNTY COMMISSIONERS)
- K41EV (Channel 41; AKRON, CO; Owner: BOARD OF WASHINGTON COUNTY COMMISSIONERS)
- K14JZ (Channel 14; PEETZ & N. LOGAN CTY, CO; Owner: BOARD OF LOGAN COUNTY COMMISSIONERS)
- K16EJ (Channel 16; PEETZ & N.LOGAN CTY, CO; Owner: BOARD OF LOGAN COUNTY COMMISSIONERS)
- K18FN (Channel 18; PEETZ & N. LOGAN CTY, CO; Owner: BOARD OF LOGAN COUNTY COMMISSIONERS)
- K20FS (Channel 20; PEETZ & N. LOGAN CTY, CO; Owner: BOARD OF LOGAN COUNTY COMMISSIONERS)
- K26FM (Channel 26; PEETZ & N. LOGAN CTY, CO; Owner: BOARD OF LOGAN COUNTY COMMISSIONERS)
- K30FO (Channel 30; PEETZ & N. LOGAN CTY, CO; Owner: BOARD OF LOGAN COUNTY COMMISSIONERS)
- K32EX (Channel 32; PEETZ & N.LOGAN CTY, CO; Owner: BOARD OF LOGAN COUNTY COMMISSIONERS)
- National Bridge Inventory (NBI) Statistics
- 40Number of bridges
- 420ft / 128mTotal length
- $640,000Total costs
- 136,136Total average daily traffic
- 24,572Total average daily truck traffic
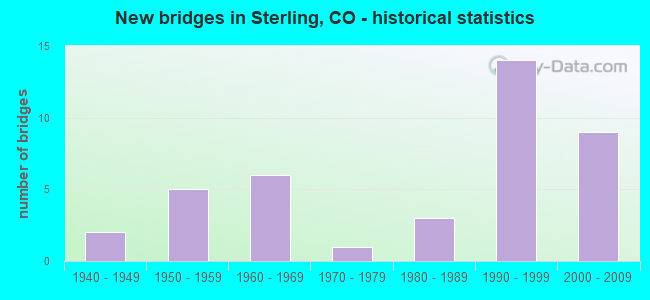
- New bridges - historical statistics
- 21940-1949
- 51950-1959
- 61960-1969
- 11970-1979
- 31980-1989
- 141990-1999
- 92000-2009
FCC Registered Antenna Towers: 163 (See the full list of FCC Registered Antenna Towers)
FCC Registered Commercial Land Mobile Towers: 2 (See the full list of FCC Registered Commercial Land Mobile Towers in Sterling, CO)
FCC Registered Private Land Mobile Towers: 8 (See the full list of FCC Registered Private Land Mobile Towers)
FCC Registered Broadcast Land Mobile Towers: 43 (See the full list of FCC Registered Broadcast Land Mobile Towers)
FCC Registered Microwave Towers: 78 (See the full list of FCC Registered Microwave Towers in this town)
FCC Registered Paging Towers: 6 (See the full list of FCC Registered Paging Towers)
FCC Registered Maritime Coast & Aviation Ground Towers: 5 (See the full list of FCC Registered Maritime Coast & Aviation Ground Towers)
FCC Registered Amateur Radio Licenses: 132 (See the full list of FCC Registered Amateur Radio Licenses in Sterling)
FAA Registered Aircraft Manufacturers and Dealers: 1 (See the full list of FAA Registered Manufacturers and Dealers in Sterling)
FAA Registered Aircraft: 31 (See the full list of FAA Registered Aircraft)
2004 - 2018 National Fire Incident Reporting System (NFIRS) incidents
- Fire incident types reported to NFIRS in Sterling, CO
- 81862.0%Outside Fires
- 29822.6%Structure Fires
- 17413.2%Mobile Property/Vehicle Fires
- 302.3%Other
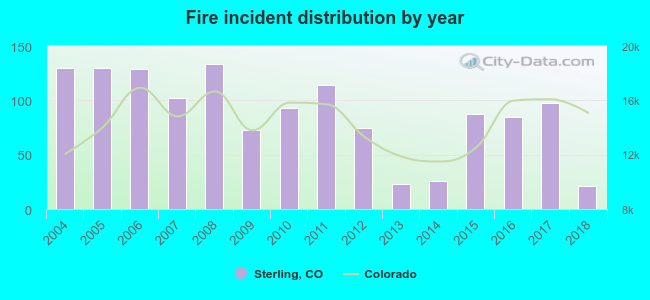 Based on the data from the years 2004 - 2018 the average number of fire incidents per year is 88. The highest number of reported fire incidents - 133 took place in 2008, and the least - 21 in 2018. The data has a dropping trend.
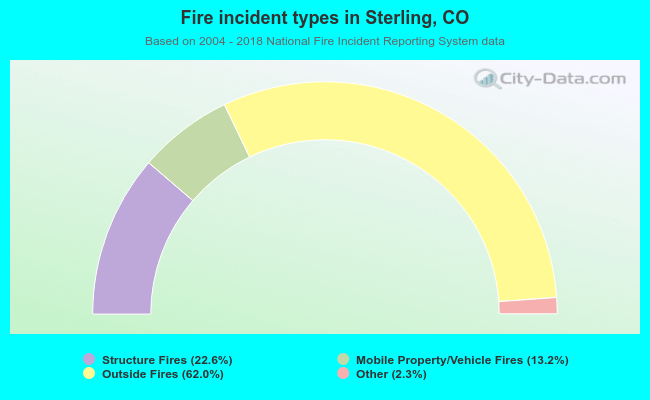 When looking into fire subcategories, the most incidents belonged to: Outside Fires (62.0%), and Structure Fires (22.6%).
Fire-safe hotels and motels in Sterling, Colorado:
- Best Western Sundowner, Overland TRL St, Sterling, Colorado 80751 , Phone: (970) 522-6265, Fax: (970) 522-6265
- Sterling Super 8 Motel, 12883 Hwy 61, Sterling, Colorado 80751 , Phone: (970) 522-0300, Fax: (970) 522-8417
- Ramada, 22140 E Hwy 6, Sterling, Colorado 80751 , Phone: (970) 522-2625, Fax: (970) 522-1321
- Sterling Comfort Inn, 2020 Leisure Ln, Sterling, Colorado 80751 , Phone: (970) 522-3700, Fax: (970) 522-8100
- Travelodge, 12881 Hwy 61, Sterling, Colorado 80751 , Phone: (970) 522-2300, Fax: (970) 522-0736
- Holiday Inn Express and Suites, 1555 E Chestnut St, Sterling, Colorado 80751 , Phone: (970) 425-7414
| Most common first names in Sterling, CO among deceased individuals | ||
| Name | Count | Lived (average) |
|---|---|---|
| John | 151 | 77.3 years |
| William | 108 | 78.8 years |
| Mary | 94 | 80.4 years |
| George | 74 | 78.3 years |
| Robert | 63 | 73.9 years |
| James | 57 | 74.5 years |
| Anna | 50 | 86.7 years |
| Henry | 48 | 81.3 years |
| Harold | 45 | 72.7 years |
| Charles | 45 | 77.0 years |
| Most common last names in Sterling, CO among deceased individuals | ||
| Last name | Count | Lived (average) |
|---|---|---|
| Smith | 50 | 79.0 years |
| Miller | 36 | 79.5 years |
| Brown | 21 | 77.5 years |
| Amen | 20 | 80.8 years |
| Wilson | 19 | 75.0 years |
| Wagner | 17 | 79.6 years |
| Johnson | 17 | 83.9 years |
| Davis | 17 | 75.6 years |
| Jones | 16 | 75.2 years |
| Jackson | 16 | 74.3 years |
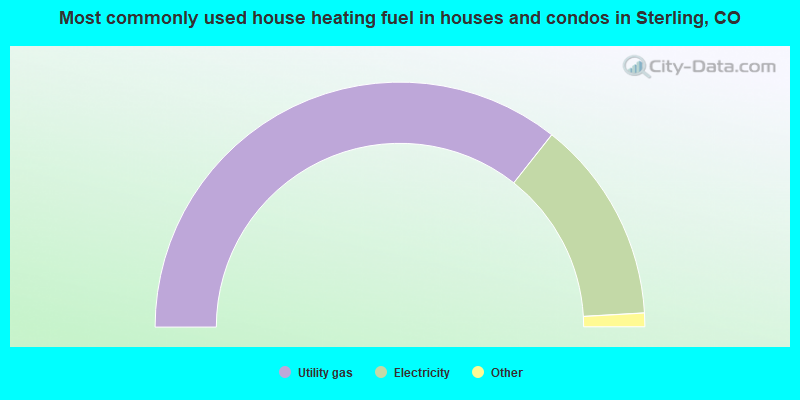
- 71.3%Utility gas
- 26.9%Electricity
- 1.0%Bottled, tank, or LP gas
- 0.5%Wood
- 0.3%Other fuel
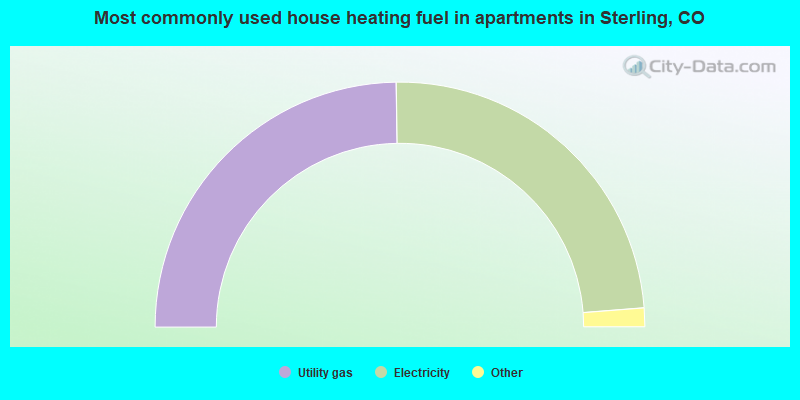
- 49.6%Utility gas
- 48.1%Electricity
- 1.4%Bottled, tank, or LP gas
- 0.6%No fuel used
- 0.4%Other fuel
Sterling compared to Colorado state average:
- Median household income below state average.
- Median house value significantly below state average.
- Unemployed percentage below state average.
- Black race population percentage below state average.
- Foreign-born population percentage below state average.
- Length of stay since moving in significantly above state average.
- House age above state average.
- Institutionalized population percentage significantly above state average.
- Percentage of population with a bachelor's degree or higher below state average.
Sterling on our top lists:
- #72 on the list of "Top 101 cities with largest percentage of males in occupations: law enforcement workers including supervisors (population 5,000+)"
- #89 on the list of "Top 100 cities with the largest percentage of males (pop. 5,000+)"
- #92 on the list of "Top 101 cities with largest percentage of males in industries: retail trade (population 5,000+)"

|
|
Total of 7 patent applications in 2008-2024.