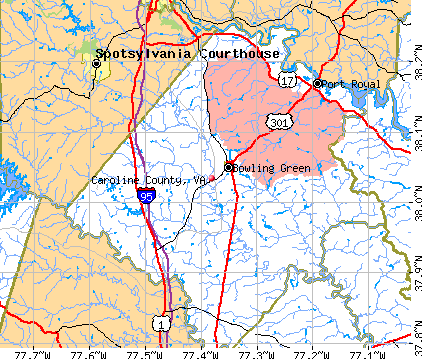
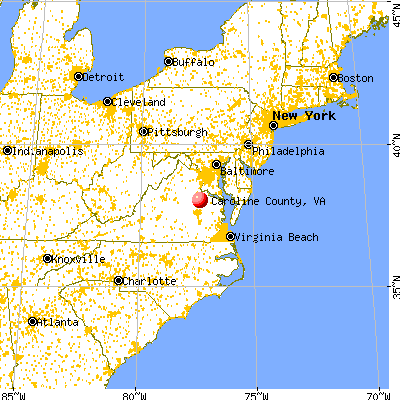
Caroline County, Virginia (VA)
County owner-occupied free and clear houses and condos in 2010: 2,193
County owner-occupied houses and condos in 2000: 6,579
Renter-occupied apartments: 1,953 (it was 1,442 in 2000)
| % of renters here: | 18% |
| State: | 33% |
Land area: 533 sq. mi.
Water area: 6.4 sq. mi.
Population density: 59 people per square mile (average).
Industries providing employment: Educational, health and social services (20.6%), Retail trade (13.8%), Professional, scientific, management, administrative, and waste management services (12.5%).
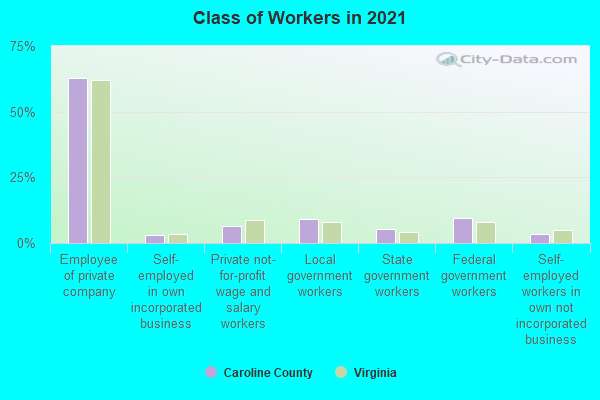
Type of workers:
- Private wage or salary: 67%
- Government: 30%
- Self-employed, not incorporated: 3%
- Unpaid family work: 0%
- OSM Map
- General Map
- Google Map
- MSN Map

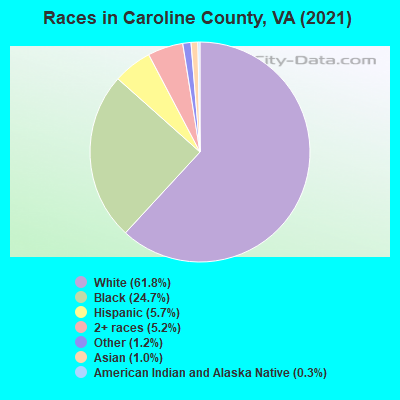
- 19,21161.2%White Non-Hispanic Alone
- 7,50123.9%Black Non-Hispanic Alone
- 1,9426.2%Two or more races
- 1,9276.1%Hispanic or Latino
- 3831.2%Some other race alone
- 2930.9%Asian alone
- 1280.4%American Indian and Alaska Native alone
| Median resident age: | 39.5 years |
| Virginia median age: | 39.0 years |
| Males: 15,567 | |
| Females: 15,827 |

 | is NoVA where the North ends? (45 replies) |
| Spotsylvania County - Got called the "N" word today as someone drove by (61 replies) |
| rental property in or near Dahlgren (2 replies) |
| I-95 EZ pass lanes extension (13 replies) |
| Best Rural Area or Towns near Quantico? (5 replies) |
| Favorite Supermarket (87 replies) |
| Caroline County: | 2.0 people |
| Virginia: | 3 people |
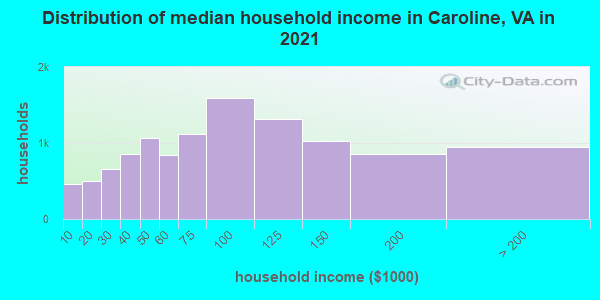
Estimated median household income in 2022: $82,244 ($39,845 in 1999)
| This county: | $82,244 |
| Virginia: | $85,873 |
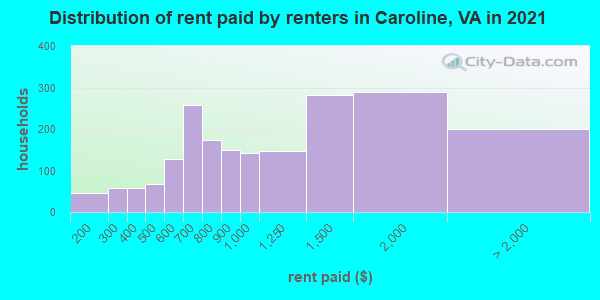
Median contract rent in 2022 for apartments: $998 (lower quartile is $713, upper quartile is $1,309)
| This county: | $998 |
| State: | $1270 |
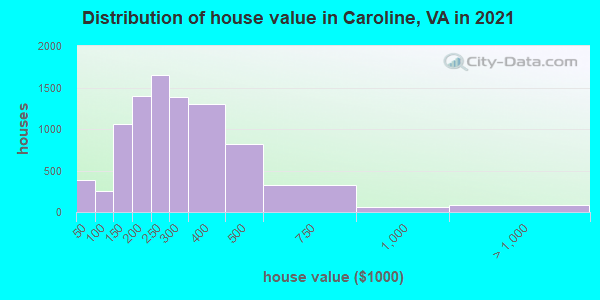
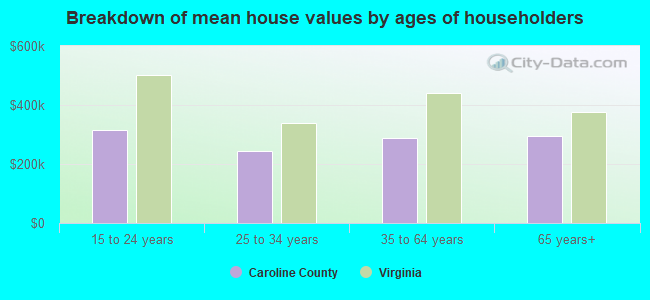
Estimated median house or condo value in 2022: $272,607 (it was $89,200 in 2000)
| Caroline: | $272,607 |
| Virginia: | $365,700 |
Mean price in 2022:
Median monthly housing costs for homes and condos with a mortgage: $1,589Detached houses: $357,507
Here: $357,507 State: $472,865 Townhouses or other attached units: $258,952
Here: $258,952 State: $457,437 Mobile homes: $120,391
Here: $120,391 State: $100,736
Median monthly housing costs for units without a mortgage: $431
Institutionalized population: 494
Crime in 2021 (reported by the sheriff's office or county police, not the county total):
- Murders: 2
- Rapes: 13
- Robberies: 3
- Assaults: 38
- Burglaries: 30
- Thefts: 126
- Auto thefts: 3
Crime in 2020 (reported by the sheriff's office or county police, not the county total):
- Murders: 1
- Rapes: 14
- Robberies: 1
- Assaults: 35
- Burglaries: 23
- Thefts: 186
- Auto thefts: 5
Health of residents in Caroline County based on CDC Behavioral Risk Factor Surveillance System Survey Questionnaires from 2013 to 2021:
General health status score of residents in this county from 1 (poor) to 5 (excellent) is 3.5. This is about average.73.5% of residents exercised in the past month. This is about average.
42.1% of residents smoked 100+ cigarettes in their lives. This is about average.
54.8% of adult residents drank alcohol in the past 30 days. This is less than average.
74.3% of residents visited a dentist within the past year. This is about average.
Average weight of males is 200 pounds. This is more than average.
Average weight of females is 167 pounds. This is more than average.
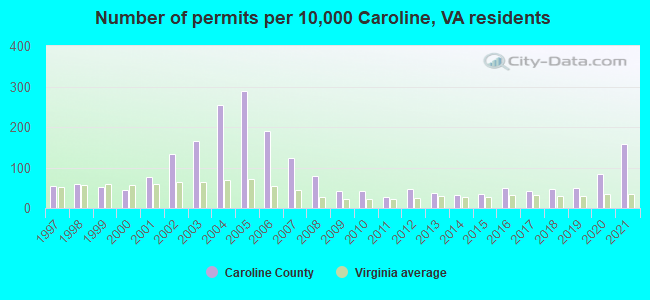
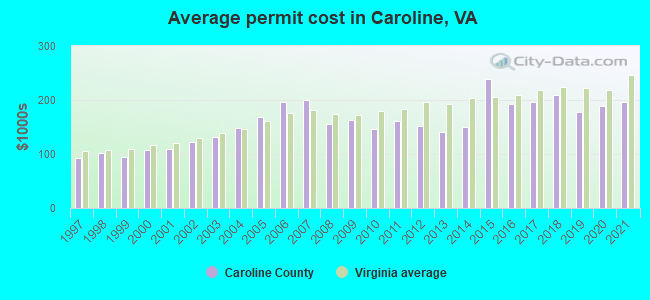
Single-family new house construction building permits:
- 2022: 194 buildings, average cost: $228,400
- 2021: 348 buildings, average cost: $195,900
- 2020: 188 buildings, average cost: $188,400
- 2019: 109 buildings, average cost: $178,100
- 2018: 104 buildings, average cost: $209,400
- 2017: 93 buildings, average cost: $196,300
- 2016: 110 buildings, average cost: $191,700
- 2015: 77 buildings, average cost: $237,500
- 2014: 73 buildings, average cost: $150,000
- 2013: 84 buildings, average cost: $139,800
- 2012: 103 buildings, average cost: $152,000
- 2011: 62 buildings, average cost: $161,400
- 2010: 96 buildings, average cost: $145,500
- 2009: 93 buildings, average cost: $162,700
- 2008: 175 buildings, average cost: $155,700
- 2007: 272 buildings, average cost: $200,200
- 2006: 418 buildings, average cost: $197,000
- 2005: 642 buildings, average cost: $168,400
- 2004: 565 buildings, average cost: $148,200
- 2003: 365 buildings, average cost: $132,200
- 2002: 295 buildings, average cost: $123,200
- 2001: 168 buildings, average cost: $109,200
- 2000: 97 buildings, average cost: $107,400
- 1999: 115 buildings, average cost: $94,100
- 1998: 131 buildings, average cost: $100,600
- 1997: 121 buildings, average cost: $92,500
Median real estate property taxes paid for housing units with mortgages in 2022: $1,508 (0.5%)
Median real estate property taxes paid for housing units with no mortgage in 2022: $1,323 (0.6%)
| Caroline County: | 12.2% |
| Virginia: | 10.6% |
Median age of residents in 2022: 39.5 years old
(Males: 38.9 years old, Females: 40.2 years old)
(Median age for: White residents: 40.0 years old, Black residents: 47.0 years old, American Indian residents: 46.8 years old, Asian residents: 31.4 years old, Hispanic or Latino residents: 21.2 years old, Other race residents: 26.6 years old)
Area name: Richmond, VA HUD Metro FMR Area
Fair market rent in 2006 for a 1-bedroom apartment in Caroline County is $678 a month.
Fair market rent for a 2-bedroom apartment is $757 a month.
Fair market rent for a 3-bedroom apartment is $1010 a month.
Cities in this county include: Long Branch, Lake Land'Or, Lake Caroline, Bowling Green, Port Royal.
2023 air pollution in Caroline County:
Ozone (1-hour): 0.035 ppm (standard limit: 0.12 ppm). Near U.S. average.
Neighboring counties: Benton County, Missouri  , Gibson County, Indiana , Nicholas County, West Virginia , Greenwood County, Kansas , Raleigh County, West Virginia , Powell County, Kentucky , Washington County, Missouri .
| Here: | 2.9% |
| Virginia: | 2.7% |

Current college students: 459
People 25 years of age or older with a high school degree or higher: 89.4%
People 25 years of age or older with a bachelor's degree or higher: 22.3%
Number of foreign born residents: 1,228 (51.5% naturalized citizens)
| Caroline County: | 3.9% |
| Whole state: | 12.7% |
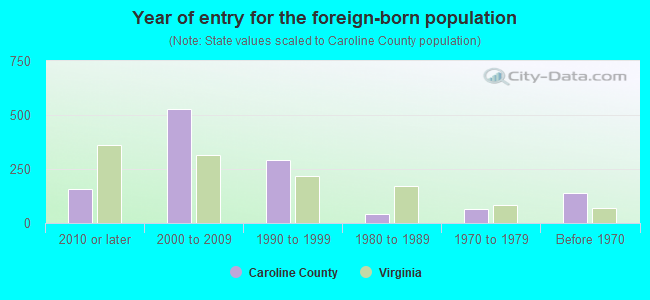
- Year of entry for the foreign-born population
- 1712010 or later
- 4212000 to 2009
- 3501990 to 1999
- 411980 to 1989
- 631970 to 1979
- 138Before 1970
Mean travel time to work (commute): # minutes
Percentage of county residents living and working in this county: 98.9%
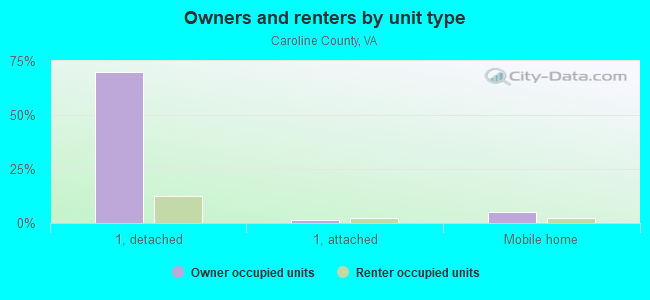
Housing units in structures:
- One, detached: 10,707
- One, attached: 723
- Two: 17
- 3 or 4: 114
- 5 to 9: 24
- 10 to 19: 72
- 20 to 49: 20
- 50 or more: 7
- Mobile homes: 975
- Boats, RVs, vans, etc.: 23
Housing units in Caroline County with a mortgage: 6,698 (571 second mortgage, 0 home equity loan, 417 both second mortgage and home equity loan)
Houses without a mortgage: 224
| Here: | 2.6% with mortgage |
| State: | 97.2% with mortgage |
Religion statistics for Caroline County
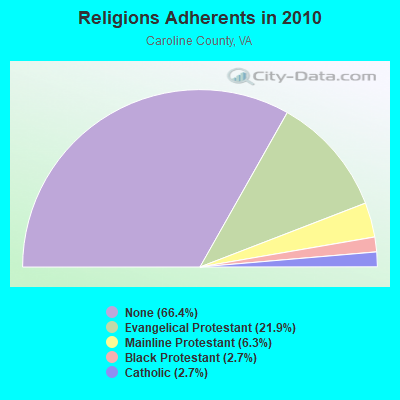
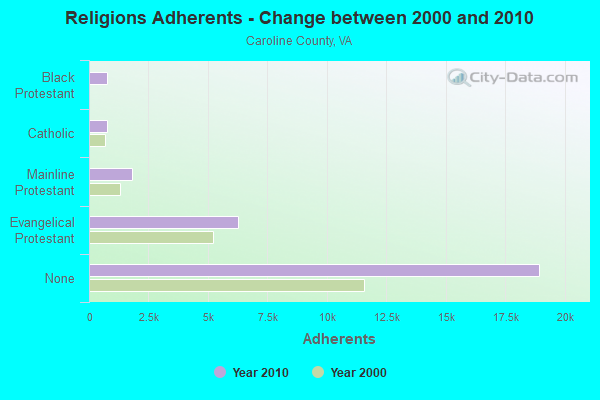
| Religion | Adherents | Congregations |
|---|---|---|
| Evangelical Protestant | 6,250 | 20 |
| Mainline Protestant | 1,808 | 11 |
| Black Protestant | 771 | 4 |
| Catholic | 771 | 1 |
| Other | 1 | 1 |
| None | 18,944 | - |
Source: Clifford Grammich, Kirk Hadaway, Richard Houseal, Dale E.Jones, Alexei Krindatch, Richie Stanley and Richard H.Taylor. 2012. 2010 U.S.Religion Census: Religious Congregations & Membership Study. Association of Statisticians of American Religious Bodies. Jones, Dale E., et al. 2002. Congregations and Membership in the United States 2000. Nashville, TN: Glenmary Research Center.
Food Environment Statistics:
| Caroline County: | 1.47 / 10,000 pop. |
| State: | 2.03 / 10,000 pop. |
| This county: | 1.47 / 10,000 pop. |
| Virginia: | 1.43 / 10,000 pop. |
| Caroline County: | 4.41 / 10,000 pop. |
| Virginia: | 4.03 / 10,000 pop. |
| This county: | 3.67 / 10,000 pop. |
| State: | 7.65 / 10,000 pop. |
| Caroline County: | 10.2% |
| Virginia: | 9.3% |
| Caroline County: | 29.7% |
| State: | 26.7% |
Agriculture in Caroline County:
Average size of farms: 250 acresAverage value of agricultural products sold per farm: $48,600
Average value of crops sold per acre for harvested cropland: $276.50
The value of livestock, poultry, and their products as a percentage of the total market value of agricultural products sold: 16.69%
Average total farm production expenses per farm: $55,600
Harvested cropland as a percentage of land in farms: 58.59%
Irrigated harvested cropland as a percentage of land in farms: 6.45%
Average market value of all machinery and equipment per farm: $69,594
The percentage of farms operated by a family or individual: 84.81%
Average age of principal farm operators: 57 years
Average number of cattle and calves per 100 acres of all land in farms: 6.97
Corn for grain: 10249 harvested acres
All wheat for grain: 6406 harvested acres
Soybeans for beans: 18375 harvested acres
Vegetables: 854 harvested acres
Land in orchards: 36 acres
Earthquake activity:
Caroline County-area historical earthquake activity is significantly above Virginia state average. It is 54% smaller than the overall U.S. average.On 8/23/2011 at 17:51:04, a magnitude 5.8 (5.8 MW, Depth: 3.7 mi, Class: Moderate, Intensity: VI - VII) earthquake occurred 31.4 miles away from Caroline County center
On 8/25/2011 at 05:07:52, a magnitude 4.5 (4.5 ML, Depth: 4.2 mi, Class: Light, Intensity: IV - V) earthquake occurred 32.4 miles away from the county center
On 12/9/2003 at 20:59:14, a magnitude 4.5 (4.5 MB, 4.5 LG) earthquake occurred 41.9 miles away from the county center
On 12/9/2003 at 20:59:18, a magnitude 4.5 (4.5 ML, Depth: 6.2 mi) earthquake occurred 43.1 miles away from the county center
On 8/24/2011 at 00:04:36, a magnitude 4.2 (4.2 ML) earthquake occurred 32.2 miles away from Caroline County center
On 8/9/2020 at 12:07:37, a magnitude 5.1 (5.1 MW, Depth: 4.7 mi) earthquake occurred 230.9 miles away from the county center
Magnitude types: regional Lg-wave magnitude (LG), body-wave magnitude (MB), local magnitude (ML), moment magnitude (MW)
Most recent natural disasters:
- Virginia Covid-19 Pandemic, Incident Period: January 20, 2020, Major Disaster (Presidential) Declared DR-4512-VA: April 2, 2020, FEMA Id: 4512, Natural disaster type: Other
- Virginia Severe Winter Storm And Snowstorm, Incident Period: January 22, 2016 to January 23, 2016, Major Disaster (Presidential) Declared DR-4262: March 07, 2016, FEMA Id: 4262, Natural disaster type: Snowstorm, Winter Storm
- Virginia Hurricane Sandy, Incident Period: October 26, 2012 to November 01, 2012, Emergency Declared EM-3359: October 29, 2012, FEMA Id: 3359, Natural disaster type: Hurricane
- Virginia Remnants of Tropical Storm Lee, Incident Period: September 08, 2011 to September 09, 2011, Major Disaster (Presidential) Declared DR-4045: November 17, 2011, FEMA Id: 4045, Natural disaster type: Tropical Storm
- Virginia Hurricane Irene, Incident Period: August 26, 2011 to August 28, 2011, Major Disaster (Presidential) Declared DR-4024: September 03, 2011, FEMA Id: 4024, Natural disaster type: Hurricane
- Virginia Severe Winter Storms and Snowstorms, Incident Period: February 05, 2010 to February 11, 2010, Major Disaster (Presidential) Declared DR-1905: April 27, 2010, FEMA Id: 1905, Natural disaster type: Snowstorm, Winter Storm
- Virginia Severe Winter Storm and Snowstorm, Incident Period: December 18, 2009 to December 20, 2009, Major Disaster (Presidential) Declared DR-1874: February 16, 2010, FEMA Id: 1874, Natural disaster type: Snowstorm, Winter Storm
- Virginia Severe Storms and Flooding, Including Severe Storms and Flooding Associated with Tropical Depression Ernesto, Incident Period: August 29, 2006 to September 07, 2006, Major Disaster (Presidential) Declared DR-1661: September 22, 2006, FEMA Id: 1661, Natural disaster type: Storm, Flood, Tropical Depression
- Virginia Hurricane Katrina Evacuation, Incident Period: August 29, 2005 to October 01, 2005, Emergency Declared EM-3240: September 12, 2005, FEMA Id: 3240, Natural disaster type: Hurricane
- Virginia Hurricane Isabel, Incident Period: September 18, 2003 to October 01, 2003, Major Disaster (Presidential) Declared DR-1491: September 18, 2003, FEMA Id: 1491, Natural disaster type: Hurricane
- 9 other natural disasters have been reported since 1953.
The number of natural disasters in Caroline County (19) is greater than the US average (15).
Major Disasters (Presidential) Declared: 15
Emergencies Declared: 4
Causes of natural disasters: Winter Storms: 6, Hurricanes: 5, Storms: 4, Floods: 3, Snowstorms: 3, Ice Storms: 2, Tropical Storms: 2, Blizzard: 1, Drought: 1, Tropical Depression: 1, Other: 1 (Note: some incidents may be assigned to more than one category).
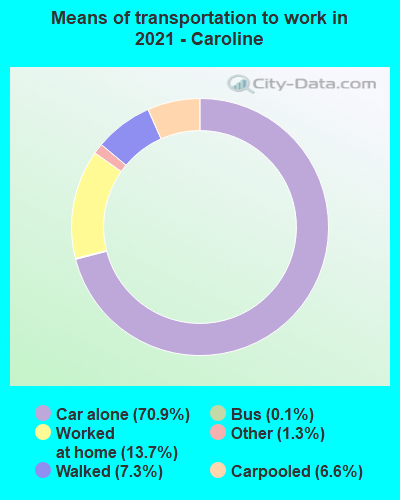
Means of transportation to work:
- Drove a car alone: 5,227 (66.7%)
- Carpooled: 521 (6.6%)
- Bus: 60 (0.8%)
- Taxicab, motorcycle, or other means: 57 (0.7%)
- Walked: 446 (5.7%)
- Worked at home: 1,603 (20.4%)
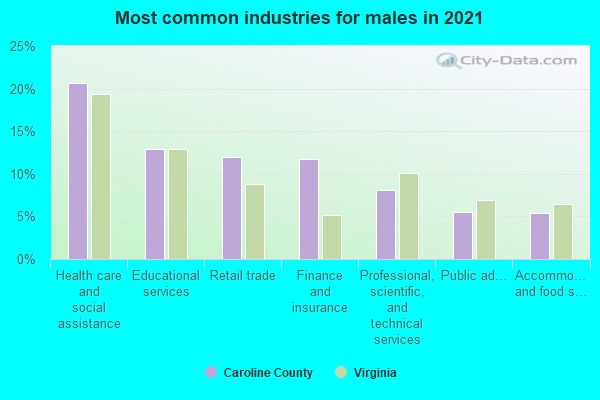
- Health care and social assistance (17%)
- Retail trade (16%)
- Educational services (15%)
- Finance and insurance (11%)
- Accommodation and food services (7%)
- Public administration (7%)
- Professional, scientific, and technical services (7%)
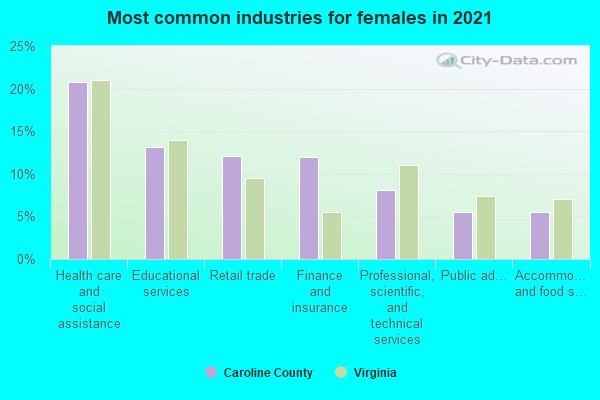
- Health care and social assistance (16%)
- Retail trade (15%)
- Educational services (15%)
- Finance and insurance (11%)
- Accommodation and food services (7%)
- Public administration (7%)
- Professional, scientific, and technical services (7%)

- Construction and extraction occupations (11%)
- Installation, maintenance, and repair occupations (11%)
- Management occupations (10%)
- Production occupations (9%)
- Computer and mathematical occupations (9%)
- Transportation occupations (9%)
- Sales and related occupations (5%)
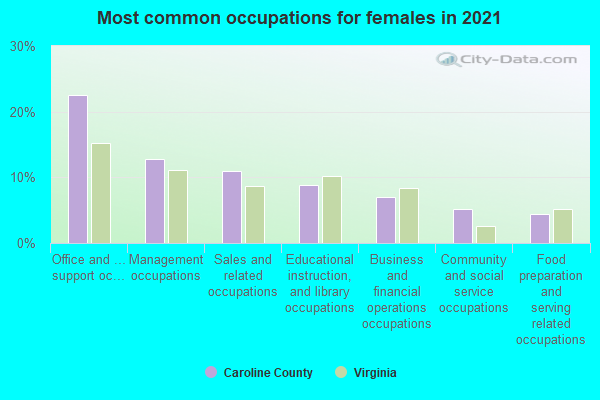
- Office and administrative support occupations (22%)
- Sales and related occupations (12%)
- Educational instruction, and library occupations (10%)
- Management occupations (10%)
- Business and financial operations occupations (9%)
- Food preparation and serving related occupations (6%)
- Personal care and service occupations (4%)
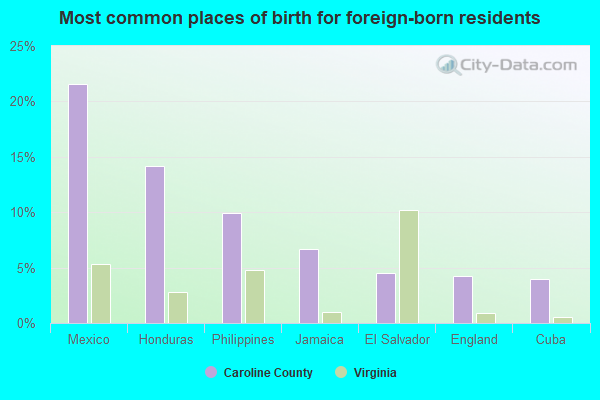
- Mexico (20%)
- Honduras (9%)
- Philippines (8%)
- El Salvador (6%)
- Guatemala (6%)
- England (6%)
- Liberia (5%)
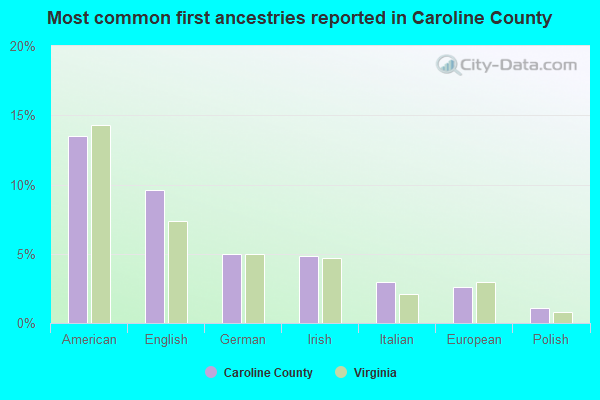
- English (12%)
- American (11%)
- German (6%)
- Irish (4%)
- Italian (3%)
- French (except Basque) (2%)
- European (2%)
People in group quarters in Caroline County, Virginia in 2010:
- 250 people in local jails and other municipal confinement facilities
- 129 people in state prisons
- 115 people in nursing facilities/skilled-nursing facilities
- 12 people in workers' group living quarters and job corps centers
- 7 people in group homes intended for adults
People in group quarters in Caroline County, Virginia in 2000:
- 294 people in local jails and other confinement facilities (including police lockups)
- 137 people in state prisons
- 123 people in nursing homes
- 13 people in other group homes
- 4 people in military barracks, etc.
- 4 people in homes for the mentally ill
- 2 people in religious group quarters
11.36% of this county's 2021 resident taxpayers lived in other counties in 2020 ($57,123 average adjusted gross income)
| Here: | 11.36% |
| Virginia average: | 10.16% |
10 or fewer of this county's residents moved from foreign countries.
9.61% relocated from other counties in Virginia ($48,637 average AGI)
1.76% relocated from other states ($8,486 average AGI)
Caroline County: 1.76% Virginia average: 3.91%
Top counties from which taxpayers relocated into this county between 2020 and 2021:
| from Spotsylvania County, VA | |
| from Stafford County, VA | |
| from Hanover County, VA | |
| from Fredericksburg city, VA | |
| from Henrico County, VA | |
| from Prince William County, VA | |
| from King George County, VA |
9.05% of this county's 2020 resident taxpayers moved to other counties in 2021 ($54,591 average adjusted gross income)
| Here: | 9.05% |
| Virginia average: | 10.20% |
10 or fewer of this county's residents moved to foreign countries.
6.78% relocated to other counties in Virginia ($39,096 average AGI)
2.28% relocated to other states ($15,494 average AGI)
Caroline County: 2.28% Virginia average: 3.98%
Top counties to which taxpayers relocated from this county between 2020 and 2021:
| to Spotsylvania County, VA | |
| to Hanover County, VA | |
| to Henrico County, VA | |
| to Stafford County, VA | |
| to Fredericksburg city, VA | |
| to King George County, VA | |
| to Chesterfield County, VA |
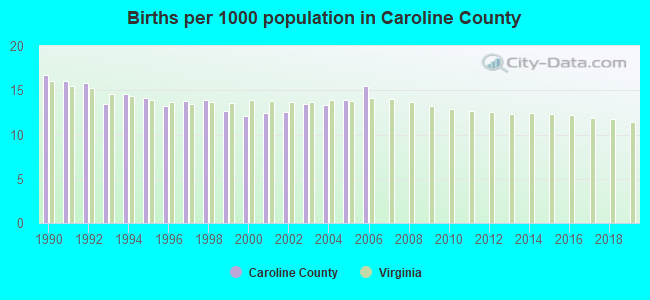
Births per 1000 population from 1990 to 1999: 14.4
Births per 1000 population from 2000 to 2006: 13.3
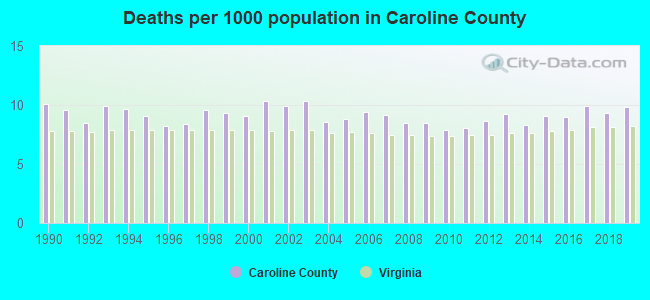
Deaths per 1000 population from 1990 to 1999: 9.2
Deaths per 1000 population from 2000 to 2009: 9.2
Deaths per 1000 population from 2010 to 2020: 9.1
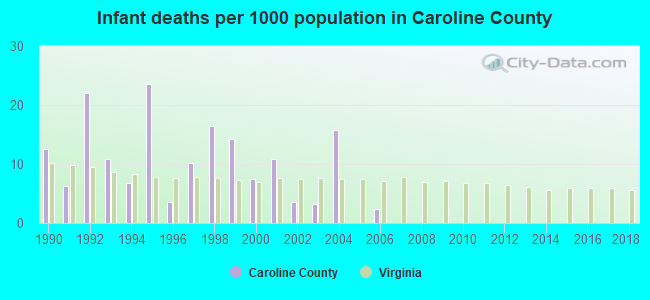
Infant deaths per 1000 live births from 1990 to 1999: 12.6
Infant deaths per 1000 live births from 2000 to 2006: 6.2
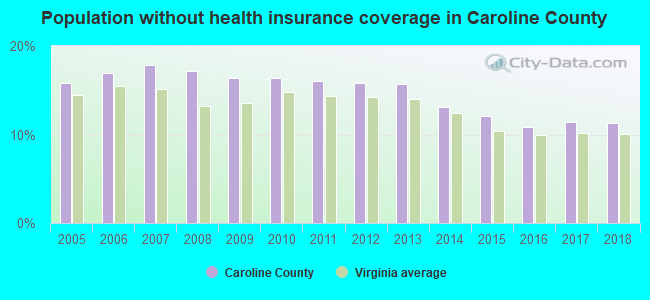
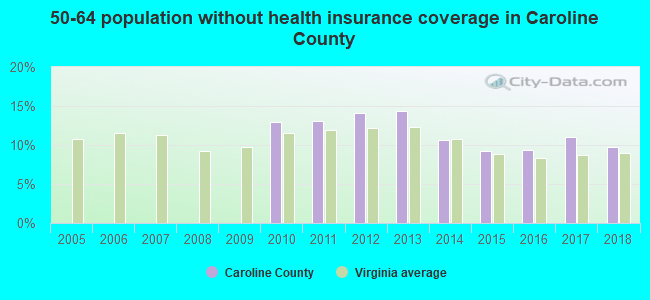
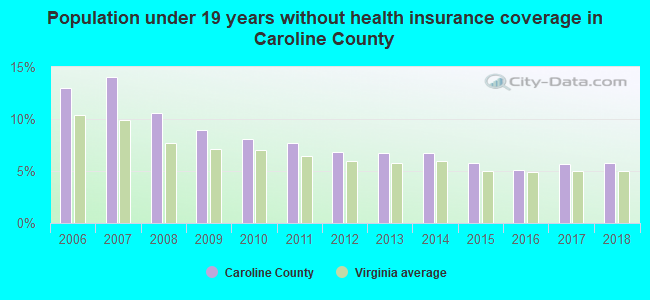
Persons under 19 years old without health insurance coverage in 2018: 5.8%
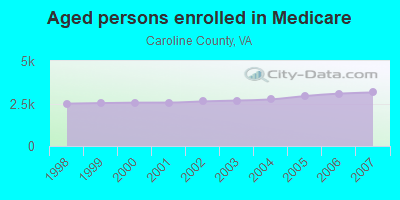
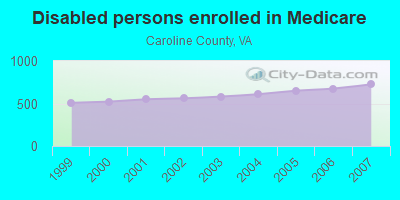
Persons enrolled in hospital insurance and/or supplemental medical insurance (Medicare) in July 1, 2007: 3,876 (3,150 aged, 726 disabled)
Children under 18 without health insurance coverage in 2007: 910 (13%)

Most common underlying causes of death in Caroline County, Virginia in 1999 - 2019:
- Bronchus or lung, unspecified - Malignant neoplasms (374)
- Acute myocardial infarction, unspecified (321)
- Atherosclerotic heart disease (178)
- Chronic obstructive pulmonary disease, unspecified (144)
- Alzheimer disease, unspecified (52)
- Stroke, not specified as haemorrhage or infarction (34)
- Unspecified dementia (33)
- Congestive heart failure (14)
Population without health insurance coverage in 2000: 12%
Children under 18 without health insurance coverage in 2000: 9%
Medical specialist MDs per 100,000 population in 2005: 810
Dentists per 100,000 population in 1998: 4
Total births per 100,000 population, July 2005 - July 2006 : 18
Total deaths per 100,000 population, July 2005 - July 2006: 12
Household type by relationship:
Households: 31,394- Male householders: 5,352 (1,378 living alone), Female householders: 6,355 (1,376 living alone)
5,924 spouses (5,844 opposite-sex spouses), 691 unmarried partners, (682 opposite-sex unmarried partners), 8,148 children (7,833 natural, 46 adopted, 284 stepchildren), 802 grandchildren, 181 brothers or sisters, 315 parents, 0 foster children, 962 other relatives, 1,168 non-relatives
- In group quarters: 1,407
Size of family households: 3,642 2-persons, 2,064 3-persons, 1,444 4-persons, 576 5-persons, 302 6-persons, 179 7-or-more-persons.
Size of nonfamily households: 2,753 1-person, 571 2-persons, 86 3-persons, 41 4-persons, 26 5-persons, 8 6-persons.
4,037 married couples with children.
1,587 single-parent households (317 men, 1,270 women).
93.5% of residents of Caroline speak English at home.
4.6% of residents speak Spanish at home (66% speak English very well, 13% speak English well, 14% speak English not well, 7% don't speak English at all).
0.8% of residents speak other Indo-European language at home (98% speak English very well, 2% speak English well).
0.7% of residents speak Asian or Pacific Island language at home (63% speak English very well, 37% speak English well).
0.1% of residents speak other language at home (81% speak English very well, 19% speak English not well).
In fiscal year 2004:
Federal Government expenditure: $135,028,000 ($5,622 per capita)
Department of Defense expenditure: $31,643,000
Federal direct payments to individuals for retirement and disability: $64,399,000
Federal other direct payments to individuals: $22,022,000
Federal direct payments not to individuals: $1,475,000
Federal grants: $15,059,000
Federal procurement contracts: $16,828,000 ($15,016,000 Department of Defense)
Federal salaries and wages: $15,245,000 ($10,325,000 Department of Defense)
Federal Government direct loans: $486,000
Federal guaranteed/insured loans: $34,246,000
Federal Government insurance: $12,049,000
Population change from April 1, 2000 to July 1, 2005:
Births: 1,576| Here: | 62 per 1000 residents |
| State: | 70 per 1000 residents |
Deaths: 1,179
| Here: | 46 per 1000 residents |
| State: | 40 per 1000 residents |
Net international migration: +51
| Here: | +2 per 1000 residents |
| State: | +18 per 1000 residents |
Net internal migration: +3,050
| Here: | +119 per 1000 residents |
| State: | +14 per 1000 residents |
Total withdrawal of fresh water for public supply: 0.33 millions of gallons per day (all from ground)
| Here: | 6.4 |
| State: | 7.0 |
| Here: | 4.4 |
| State: | 4.3 |
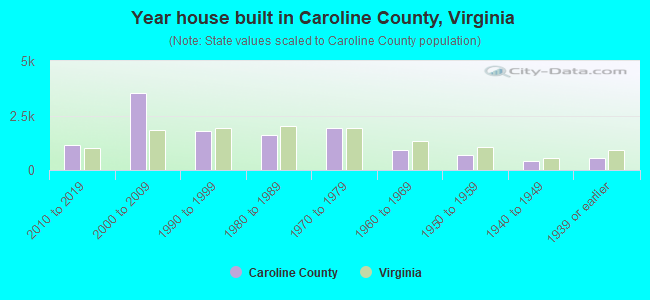
- Year house built in Caroline County, Virginia
- 472020 or later
- 9262010 to 2019
- 3,7962000 to 2009
- 1,6961990 to 1999
- 1,5901980 to 1989
- 2,2121970 to 1979
- 7401960 to 1969
- 7641950 to 1959
- 4031940 to 1949
- 4591939 or earlier
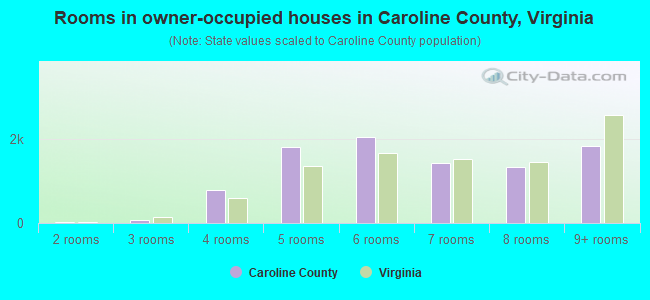
- Rooms in owner-occupied houses in Caroline County, Virginia
- 51 room
- 322 rooms
- 833 rooms
- 7674 rooms
- 2,1175 rooms
- 2,0376 rooms
- 1,4227 rooms
- 1,3718 rooms
- 1,7719+ rooms
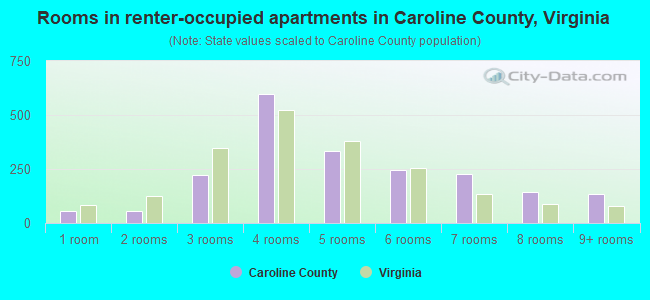
- Rooms in renter-occupied apartments in Caroline County, Virginia
- 501 room
- 612 rooms
- 3063 rooms
- 6704 rooms
- 3025 rooms
- 2566 rooms
- 2117 rooms
- 1448 rooms
- 989+ rooms
- Bedrooms in owner-occupied houses in Caroline County, Virginia
- 20no bedroom
- 751 bedroom
- 1,0712 bedrooms
- 5,8443 bedrooms
- 2,2094 bedrooms
- 4015+ bedrooms
- Bedrooms in renter-occupied apartments in Caroline County, Virginia
- 50no bedroom
- 1861 bedroom
- 9302 bedrooms
- 7413 bedrooms
- 1594 bedrooms
- 195+ bedrooms

- Cars and other vehicles available in Caroline County in owner-occupied houses/condos
- 391no vehicle
- 1,3121 vehicle
- 3,0962 vehicles
- 2,8083 vehicles
- 1,3404 vehicles
- 6145+ vehicles
- Cars and other vehicles available in Caroline County in renter-occupied apartments
- 211no vehicle
- 8051 vehicle
- 8172 vehicles
- 1283 vehicles
- 824 vehicles
- 505+ vehicles
87.2% of Caroline County residents lived in the same house 1 years ago.
Out of people who lived in different houses, 21% lived in this county.
Out of people who lived in different counties, 71% lived in Virginia.
| Caroline County: | 87.2% |
| State average: | 86.6% |
Place of birth for U.S.-born residents:
- This state: 20,418
- Other state: 9,484
- Northeast: 2,636
- Midwest: 1,029
- South: 4,618
- West: 1,208
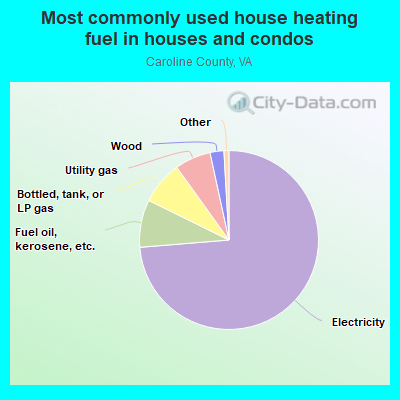
- 76.2%Electricity
- 8.5%Bottled, tank, or LP gas
- 6.1%Utility gas
- 5.9%Fuel oil, kerosene, etc.
- 2.5%Wood
- 0.8%No fuel used
- 0.1%Other fuel

- 74.6%Electricity
- 9.8%Utility gas
- 7.2%Fuel oil, kerosene, etc.
- 3.2%Bottled, tank, or LP gas
- 3.0%No fuel used
- 1.5%Wood
- 0.7%Other fuel
Private vs. public school enrollment:
| Here: | 11.5% |
| Virginia: | 13.2% |
| Here: | 8.5% |
| Virginia: | 10.2% |
| Here: | 32.1% |
| Virginia: | 18.7% |


Caroline County government finances - Expenditure in 2018:
- Assistance and Subsidies - Public Welfare, Federal Categorical Assistance Programs: $373,000
Public Welfare, Cash Assistance Programs - Other: $4,000
- Bond Funds - Cash and Securities: $39,356,000
- Charges - Sewerage: $1,853,000
Other: $1,014,000
Elementary and Secondary Education School Lunch: $796,000
Parks and Recreation: $99,000
Elementary and Secondary Education School Tuition and Transportation: $93,000
Elementary and Secondary Education - Other: $48,000
Solid Waste Management: $42,000
- Construction - Parks and Recreation: $2,974,000
Elementary and Secondary Education: $2,848,000
Regular Highways: $917,000
General Public Buildings: $48,000
Solid Waste Management: $12,000
Water Utilities: $10,000
General - Other: $2,000
- Current Operations - Elementary and Secondary Education: $44,657,000
Police Protection: $5,979,000
Public Welfare - Other: $5,387,000
Local Fire Protection: $3,827,000
Central Staff Services: $2,339,000
Financial Administration: $1,905,000
General Public Buildings: $1,524,000
Solid Waste Management: $1,399,000
Sewerage: $1,209,000
General - Other: $1,142,000
Judicial and Legal Services: $1,025,000
Water Utilities: $993,000
Health - Other: $684,000
Parks and Recreation: $412,000
Libraries: $356,000
Protective Inspection and Regulation - Other: $311,000
Public Welfare, Vendor Payments for Other Purposes: $150,000
Natural Resources - Other: $148,000
Regular Highways: $69,000
Corrections - Other: $41,000
- Federal Intergovernmental - Education: $3,465,000
Public Welfare: $1,928,000
General Local Government Support: $370,000
Water Utilities: $129,000
Natural Resources: $2,000
- General - Interest on Debt: $2,795,000
- Intergovernmental to Local - Other - Correctional Institutions: $2,444,000
Other - Elementary and Secondary Education: $360,000
- Local Intergovernmental - Education: $303,000
Water Utilities: $5,000
Public Welfare: $3,000
- Long Term Debt - Beginning Outstanding - Unspecified Public Purpose: $53,458,000
Outstanding Unspecified Public Purpose: $40,833,000
Retired Unspecified Public Purpose: $12,625,000
- Miscellaneous - Interest Earnings: $3,946,000
General Revenue - Other: $2,238,000
Fines and Forfeits: $878,000
Rents: $252,000
Sale of Property: $186,000
Donations From Private Sources: $65,000
Special Assessments: $19,000
- Other Capital Outlay - Police Protection: $2,690,000
Elementary and Secondary Education: $1,003,000
Local Fire Protection: $193,000
Water Utilities: $191,000
Central Staff Services: $42,000
Sewerage: $21,000
General - Other: $15,000
General Public Building: $7,000
Health - Other: $6,000
Public Welfare - Other: $5,000
Solid Waste Management: $3,000
Judicial and Legal Services: $3,000
Financial Administration: $3,000
Protective Inspection and Regulation - Other: $1,000
Regular Highways: $1,000
- Other Funds - Cash and Securities: $29,068,000
- Revenue - Water Utilities: $2,237,000
- Sinking Funds - Cash and Securities: $4,172,000
- State Intergovernmental - Education: $30,176,000
Public Welfare: $6,179,000
General Local Government Support: $2,142,000
Water Utilities: $391,000
Sewerage: $147,000
- Tax - Property: $37,968,000
General Sales and Gross Receipts: $3,226,000
Public Utilities Sales: $1,652,000
Occupation and Business License - Other: $1,284,000
Motor Vehicle License: $1,130,000
Other License: $629,000
Documentary and Stock Transfer: $357,000
Other: $137,000
- Total Salaries and Wages: $25,600,000
- Water Utilities - Interest on Debt: $2,164,000
Caroline County government finances - Revenue in 2018:
- Assistance and Subsidies - Public Welfare, Federal Categorical Assistance Programs: $373,000
Public Welfare, Cash Assistance Programs - Other: $4,000
- Bond Funds - Cash and Securities: $39,356,000
- Charges - Sewerage: $1,853,000
Other: $1,014,000
Elementary and Secondary Education School Lunch: $796,000
Parks and Recreation: $99,000
Elementary and Secondary Education School Tuition and Transportation: $93,000
Elementary and Secondary Education - Other: $48,000
Solid Waste Management: $42,000
- Construction - Parks and Recreation: $2,974,000
Elementary and Secondary Education: $2,848,000
Regular Highways: $917,000
General Public Buildings: $48,000
Solid Waste Management: $12,000
Water Utilities: $10,000
General - Other: $2,000
- Current Operations - Elementary and Secondary Education: $44,657,000
Police Protection: $5,979,000
Public Welfare - Other: $5,387,000
Local Fire Protection: $3,827,000
Central Staff Services: $2,339,000
Financial Administration: $1,905,000
General Public Buildings: $1,524,000
Solid Waste Management: $1,399,000
Sewerage: $1,209,000
General - Other: $1,142,000
Judicial and Legal Services: $1,025,000
Water Utilities: $993,000
Health - Other: $684,000
Parks and Recreation: $412,000
Libraries: $356,000
Protective Inspection and Regulation - Other: $311,000
Public Welfare, Vendor Payments for Other Purposes: $150,000
Natural Resources - Other: $148,000
Regular Highways: $69,000
Corrections - Other: $41,000
- Federal Intergovernmental - Education: $3,465,000
Public Welfare: $1,928,000
General Local Government Support: $370,000
Water Utilities: $129,000
Natural Resources: $2,000
- General - Interest on Debt: $2,795,000
- Intergovernmental to Local - Other - Correctional Institutions: $2,444,000
Other - Elementary and Secondary Education: $360,000
- Local Intergovernmental - Education: $303,000
Water Utilities: $5,000
Public Welfare: $3,000
- Long Term Debt - Beginning Outstanding - Unspecified Public Purpose: $53,458,000
Outstanding Unspecified Public Purpose: $40,833,000
Retired Unspecified Public Purpose: $12,625,000
- Miscellaneous - Interest Earnings: $3,946,000
General Revenue - Other: $2,238,000
Fines and Forfeits: $878,000
Rents: $252,000
Sale of Property: $186,000
Donations From Private Sources: $65,000
Special Assessments: $19,000
- Other Capital Outlay - Police Protection: $2,690,000
Elementary and Secondary Education: $1,003,000
Local Fire Protection: $193,000
Water Utilities: $191,000
Central Staff Services: $42,000
Sewerage: $21,000
General - Other: $15,000
General Public Building: $7,000
Health - Other: $6,000
Public Welfare - Other: $5,000
Solid Waste Management: $3,000
Judicial and Legal Services: $3,000
Financial Administration: $3,000
Protective Inspection and Regulation - Other: $1,000
Regular Highways: $1,000
- Other Funds - Cash and Securities: $29,068,000
- Revenue - Water Utilities: $2,237,000
- Sinking Funds - Cash and Securities: $4,172,000
- State Intergovernmental - Education: $30,176,000
Public Welfare: $6,179,000
General Local Government Support: $2,142,000
Water Utilities: $391,000
Sewerage: $147,000
- Tax - Property: $37,968,000
General Sales and Gross Receipts: $3,226,000
Public Utilities Sales: $1,652,000
Occupation and Business License - Other: $1,284,000
Motor Vehicle License: $1,130,000
Other License: $629,000
Documentary and Stock Transfer: $357,000
Other: $137,000
- Total Salaries and Wages: $25,600,000
- Water Utilities - Interest on Debt: $2,164,000
Caroline County government finances - Debt in 2018:
- Assistance and Subsidies - Public Welfare, Federal Categorical Assistance Programs: $373,000
Public Welfare, Cash Assistance Programs - Other: $4,000
- Bond Funds - Cash and Securities: $39,356,000
- Charges - Sewerage: $1,853,000
Other: $1,014,000
Elementary and Secondary Education School Lunch: $796,000
Parks and Recreation: $99,000
Elementary and Secondary Education School Tuition and Transportation: $93,000
Elementary and Secondary Education - Other: $48,000
Solid Waste Management: $42,000
- Construction - Parks and Recreation: $2,974,000
Elementary and Secondary Education: $2,848,000
Regular Highways: $917,000
General Public Buildings: $48,000
Solid Waste Management: $12,000
Water Utilities: $10,000
General - Other: $2,000
- Current Operations - Elementary and Secondary Education: $44,657,000
Police Protection: $5,979,000
Public Welfare - Other: $5,387,000
Local Fire Protection: $3,827,000
Central Staff Services: $2,339,000
Financial Administration: $1,905,000
General Public Buildings: $1,524,000
Solid Waste Management: $1,399,000
Sewerage: $1,209,000
General - Other: $1,142,000
Judicial and Legal Services: $1,025,000
Water Utilities: $993,000
Health - Other: $684,000
Parks and Recreation: $412,000
Libraries: $356,000
Protective Inspection and Regulation - Other: $311,000
Public Welfare, Vendor Payments for Other Purposes: $150,000
Natural Resources - Other: $148,000
Regular Highways: $69,000
Corrections - Other: $41,000
- Federal Intergovernmental - Education: $3,465,000
Public Welfare: $1,928,000
General Local Government Support: $370,000
Water Utilities: $129,000
Natural Resources: $2,000
- General - Interest on Debt: $2,795,000
- Intergovernmental to Local - Other - Correctional Institutions: $2,444,000
Other - Elementary and Secondary Education: $360,000
- Local Intergovernmental - Education: $303,000
Water Utilities: $5,000
Public Welfare: $3,000
- Long Term Debt - Beginning Outstanding - Unspecified Public Purpose: $53,458,000
Outstanding Unspecified Public Purpose: $40,833,000
Retired Unspecified Public Purpose: $12,625,000
- Miscellaneous - Interest Earnings: $3,946,000
General Revenue - Other: $2,238,000
Fines and Forfeits: $878,000
Rents: $252,000
Sale of Property: $186,000
Donations From Private Sources: $65,000
Special Assessments: $19,000
- Other Capital Outlay - Police Protection: $2,690,000
Elementary and Secondary Education: $1,003,000
Local Fire Protection: $193,000
Water Utilities: $191,000
Central Staff Services: $42,000
Sewerage: $21,000
General - Other: $15,000
General Public Building: $7,000
Health - Other: $6,000
Public Welfare - Other: $5,000
Solid Waste Management: $3,000
Judicial and Legal Services: $3,000
Financial Administration: $3,000
Protective Inspection and Regulation - Other: $1,000
Regular Highways: $1,000
- Other Funds - Cash and Securities: $29,068,000
- Revenue - Water Utilities: $2,237,000
- Sinking Funds - Cash and Securities: $4,172,000
- State Intergovernmental - Education: $30,176,000
Public Welfare: $6,179,000
General Local Government Support: $2,142,000
Water Utilities: $391,000
Sewerage: $147,000
- Tax - Property: $37,968,000
General Sales and Gross Receipts: $3,226,000
Public Utilities Sales: $1,652,000
Occupation and Business License - Other: $1,284,000
Motor Vehicle License: $1,130,000
Other License: $629,000
Documentary and Stock Transfer: $357,000
Other: $137,000
- Total Salaries and Wages: $25,600,000
- Water Utilities - Interest on Debt: $2,164,000
Caroline County government finances - Cash and Securities in 2018:
- Assistance and Subsidies - Public Welfare, Federal Categorical Assistance Programs: $373,000
Public Welfare, Cash Assistance Programs - Other: $4,000
- Bond Funds - Cash and Securities: $39,356,000
- Charges - Sewerage: $1,853,000
Other: $1,014,000
Elementary and Secondary Education School Lunch: $796,000
Parks and Recreation: $99,000
Elementary and Secondary Education School Tuition and Transportation: $93,000
Elementary and Secondary Education - Other: $48,000
Solid Waste Management: $42,000
- Construction - Parks and Recreation: $2,974,000
Elementary and Secondary Education: $2,848,000
Regular Highways: $917,000
General Public Buildings: $48,000
Solid Waste Management: $12,000
Water Utilities: $10,000
General - Other: $2,000
- Current Operations - Elementary and Secondary Education: $44,657,000
Police Protection: $5,979,000
Public Welfare - Other: $5,387,000
Local Fire Protection: $3,827,000
Central Staff Services: $2,339,000
Financial Administration: $1,905,000
General Public Buildings: $1,524,000
Solid Waste Management: $1,399,000
Sewerage: $1,209,000
General - Other: $1,142,000
Judicial and Legal Services: $1,025,000
Water Utilities: $993,000
Health - Other: $684,000
Parks and Recreation: $412,000
Libraries: $356,000
Protective Inspection and Regulation - Other: $311,000
Public Welfare, Vendor Payments for Other Purposes: $150,000
Natural Resources - Other: $148,000
Regular Highways: $69,000
Corrections - Other: $41,000
- Federal Intergovernmental - Education: $3,465,000
Public Welfare: $1,928,000
General Local Government Support: $370,000
Water Utilities: $129,000
Natural Resources: $2,000
- General - Interest on Debt: $2,795,000
- Intergovernmental to Local - Other - Correctional Institutions: $2,444,000
Other - Elementary and Secondary Education: $360,000
- Local Intergovernmental - Education: $303,000
Water Utilities: $5,000
Public Welfare: $3,000
- Long Term Debt - Beginning Outstanding - Unspecified Public Purpose: $53,458,000
Outstanding Unspecified Public Purpose: $40,833,000
Retired Unspecified Public Purpose: $12,625,000
- Miscellaneous - Interest Earnings: $3,946,000
General Revenue - Other: $2,238,000
Fines and Forfeits: $878,000
Rents: $252,000
Sale of Property: $186,000
Donations From Private Sources: $65,000
Special Assessments: $19,000
- Other Capital Outlay - Police Protection: $2,690,000
Elementary and Secondary Education: $1,003,000
Local Fire Protection: $193,000
Water Utilities: $191,000
Central Staff Services: $42,000
Sewerage: $21,000
General - Other: $15,000
General Public Building: $7,000
Health - Other: $6,000
Public Welfare - Other: $5,000
Solid Waste Management: $3,000
Judicial and Legal Services: $3,000
Financial Administration: $3,000
Protective Inspection and Regulation - Other: $1,000
Regular Highways: $1,000
- Other Funds - Cash and Securities: $29,068,000
- Revenue - Water Utilities: $2,237,000
- Sinking Funds - Cash and Securities: $4,172,000
- State Intergovernmental - Education: $30,176,000
Public Welfare: $6,179,000
General Local Government Support: $2,142,000
Water Utilities: $391,000
Sewerage: $147,000
- Tax - Property: $37,968,000
General Sales and Gross Receipts: $3,226,000
Public Utilities Sales: $1,652,000
Occupation and Business License - Other: $1,284,000
Motor Vehicle License: $1,130,000
Other License: $629,000
Documentary and Stock Transfer: $357,000
Other: $137,000
- Total Salaries and Wages: $25,600,000
- Water Utilities - Interest on Debt: $2,164,000
Supplemental Security Income (SSI) in 2006:
- Total number of recipients: 395
- Number of aged recipients: 53
- Number of blind and disabled recipients: 342
- Number of recipients under 18: 70
- Number of recipients between 18 and 64: 222
- Number of recipients older than 64: 103
- Number of recipients also receiving OASDI: 172
- Amount of payments (thousands of dollars): 150
| Most common first names in Caroline County, VA among deceased individuals | ||
| Name | Count | Lived (average) |
|---|---|---|
| William | 80 | 72.5 years |
| James | 78 | 66.3 years |
| Mary | 56 | 81.6 years |
| John | 50 | 74.4 years |
| Robert | 46 | 71.8 years |
| George | 40 | 70.7 years |
| Charles | 34 | 68.3 years |
| Ruth | 34 | 82.7 years |
| Annie | 28 | 86.6 years |
| Elizabeth | 26 | 82.5 years |
| Most common last names in Caroline County, VA among deceased individuals | ||
| Last name | Count | Lived (average) |
|---|---|---|
| Taylor | 34 | 69.6 years |
| Carter | 34 | 72.3 years |
| Coleman | 34 | 72.2 years |
| Baylor | 32 | 75.3 years |
| Myers | 30 | 65.0 years |
| Washington | 30 | 78.7 years |
| Wright | 28 | 70.9 years |
| Martin | 28 | 78.2 years |
| Brooks | 28 | 73.4 years |
| Johnson | 28 | 71.3 years |
| Businesses in Caroline County, VA | ||||
| Name | Count | Name | Count | |
|---|---|---|---|---|
| Arby's | 1 | McDonald's | 2 | |
| Comfort Inn | 1 | Pizza Hut | 1 | |
| Curves | 1 | Quality | 1 | |
| Dairy Queen | 2 | RadioShack | 1 | |
| Days Inn | 2 | Rite Aid | 1 | |
| Dennys | 1 | Super 8 | 2 | |
| Econo Lodge | 1 | U-Haul | 3 | |
| FedEx | 7 | UPS | 4 | |
| GNC | 1 | Waffle House | 1 | |
| H&R Block | 1 | Wendy's | 1 | |
Caroline County on our top lists:
- #11 on the list of "Top 101 counties with the lowest Nitrogen Dioxide air pollution readings in 2012 (ppm)"