King George County, Virginia (VA)
County owner-occupied free and clear houses and condos in 2010: 1,476
County owner-occupied houses and condos in 2000: 4,375
Renter-occupied apartments: 1,808 (it was 1,716 in 2000)
| % of renters here: | 28% |
| State: | 33% |
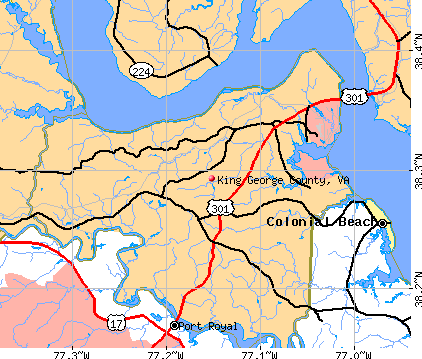
Land area: 180 sq. mi.
Water area: 7.8 sq. mi.
Population density: 151 people per square mile (average).
Industries providing employment: Public administration (20.7%), Educational, health and social services (17.3%), Professional, scientific, management, administrative, and waste management services (16.3%), Retail trade (11.3%).
Type of workers:
- Private wage or salary: 59%
- Government: 37%
- Self-employed, not incorporated: 4%
- Unpaid family work: 0%
- OSM Map
- General Map
- Google Map
- MSN Map

- 18,61868.3%White Non-Hispanic Alone
- 4,23215.5%Black Non-Hispanic Alone
- 1,7946.6%Hispanic or Latino
- 1,4545.3%Two or more races
- 7522.8%Some other race alone
- 3761.4%Asian alone
- 250.09%American Indian and Alaska Native alone

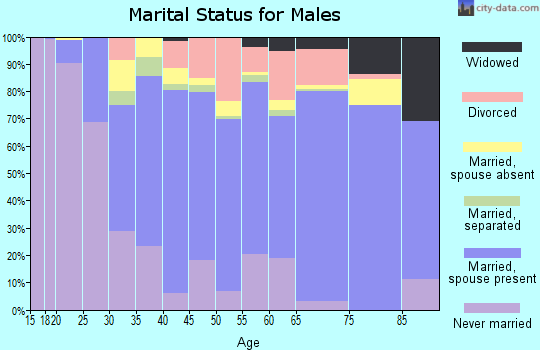
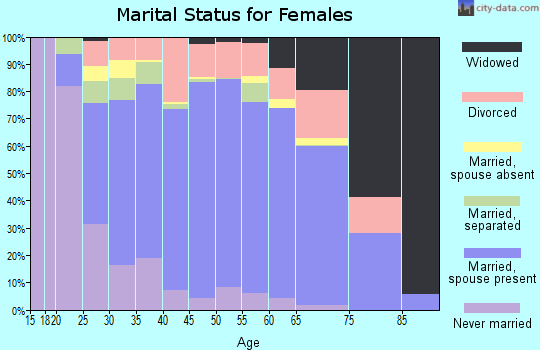
| Median resident age: | 38.6 years |
| Virginia median age: | 39.0 years |
| Males: 13,816 | |
| Females: 13,353 |

 | Remove all the Confederate stuff in Virginia, FFS (155 replies) |
| Northern Neck Questions (7 replies) |
| Looking for dentist in Fredericksburg/Spotsy area (10 replies) |
| Help! Trying to buy a home in suburb of DC (8 replies) |
| Where is Northern Virginia? (25 replies) |
| Northern Neck 4th of July Weekend (3 replies) |
| King George County: | 2.0 people |
| Virginia: | 3 people |
Estimated median household income in 2022: $101,635 ($49,882 in 1999)
| This county: | $101,635 |
| Virginia: | $85,873 |
Median contract rent in 2022 for apartments: $1,196 (lower quartile is $936, upper quartile is $1,703)
| This county: | $1196 |
| State: | $1270 |
Estimated median house or condo value in 2022: $400,677 (it was $122,800 in 2000)
| King George: | $400,677 |
| Virginia: | $365,700 |
Mean price in 2022:
Median monthly housing costs for homes and condos with a mortgage: $1,976Detached houses: $444,583
Here: $444,583 State: $472,865 Townhouses or other attached units: $278,307
Here: $278,307 State: $457,437 Mobile homes: $62,471
Here: $62,471 State: $100,736
Median monthly housing costs for units without a mortgage: $487
Institutionalized population: 108
Crime in 2021 (reported by the sheriff's office or county police, not the county total):
- Murders: 1
- Rapes: 5
- Robberies: 3
- Assaults: 37
- Burglaries: 32
- Thefts: 179
- Auto thefts: 17
Crime in 2020 (reported by the sheriff's office or county police, not the county total):
- Murders: 1
- Rapes: 9
- Robberies: 7
- Assaults: 43
- Burglaries: 26
- Thefts: 166
- Auto thefts: 22
Single-family new house construction building permits:
- 2022: 161 buildings, average cost: $241,000
- 2021: 232 buildings, average cost: $215,600
- 2020: 165 buildings, average cost: $207,900
- 2019: 155 buildings, average cost: $201,600
- 2018: 132 buildings, average cost: $195,000
- 2017: 91 buildings, average cost: $222,300
- 2016: 103 buildings, average cost: $237,600
- 2015: 108 buildings, average cost: $249,500
- 2014: 104 buildings, average cost: $221,900
- 2013: 102 buildings, average cost: $197,900
- 2012: 109 buildings, average cost: $190,200
- 2011: 68 buildings, average cost: $180,200
- 2010: 86 buildings, average cost: $176,100
- 2009: 122 buildings, average cost: $177,200
- 2008: 144 buildings, average cost: $175,700
- 2007: 236 buildings, average cost: $167,700
- 2006: 279 buildings, average cost: $157,100
- 2005: 517 buildings, average cost: $144,400
- 2004: 420 buildings, average cost: $131,300
- 2003: 426 buildings, average cost: $129,300
- 2002: 272 buildings, average cost: $125,900
- 2001: 208 buildings, average cost: $122,800
- 2000: 125 buildings, average cost: $115,100
- 1999: 170 buildings, average cost: $111,500
- 1998: 165 buildings, average cost: $105,000
- 1997: 131 buildings, average cost: $99,800


Median real estate property taxes paid for housing units with mortgages in 2022: $2,267 (0.6%)
Median real estate property taxes paid for housing units with no mortgage in 2022: $1,754 (0.5%)


| King George County: | 7.3% |
| Virginia: | 10.6% |
Median age of residents in 2022: 38.6 years old
(Males: 38.4 years old, Females: 39.0 years old)
(Median age for: White residents: 40.4 years old, Black residents: 42.4 years old, American Indian residents: 47.4 years old, Asian residents: 39.5 years old, Hispanic or Latino residents: 29.9 years old, Other race residents: 29.7 years old)
Fair market rent in 2006 for a 1-bedroom apartment in King George County is $606 a month.
Fair market rent for a 2-bedroom apartment is $728 a month.
Fair market rent for a 3-bedroom apartment is $1059 a month.
Cities in this county include: King George, Passapatanzy, Dahlgren, Dahlgren Center, Fairview Beach.
Neighboring counties: Boyd County, Kentucky  , Greenbrier County, West Virginia , Bullitt County, Kentucky , Dubois County, Indiana , Marin County, California , Sacramento County, California , Vernon County, Missouri .
| Here: | 2.6% |
| Virginia: | 2.7% |


Current college students: 735
People 25 years of age or older with a high school degree or higher: 90.3%
People 25 years of age or older with a bachelor's degree or higher: 34.9%
Number of foreign born residents: 924 (62.3% naturalized citizens)
| King George County: | 3.4% |
| Whole state: | 12.7% |

- Year of entry for the foreign-born population
- 2042010 or later
- 1562000 to 2009
- 2521990 to 1999
- 501980 to 1989
- 521970 to 1979
- 41Before 1970
Mean travel time to work (commute): " minutes
Percentage of county residents living and working in this county: 89.1%
Housing units in structures:
- One, detached: 8,830
- One, attached: 443
- Two: 152
- 3 or 4: 322
- 5 to 9: 146
- 10 to 19: 61
- 20 to 49: 18
- 50 or more: 9
- Mobile homes: 550
Housing units in King George County with a mortgage: 5,320 (380 second mortgage, 0 home equity loan, 267 both second mortgage and home equity loan)
Houses without a mortgage: 57
| Here: | 8.1% with mortgage |
| State: | 97.2% with mortgage |
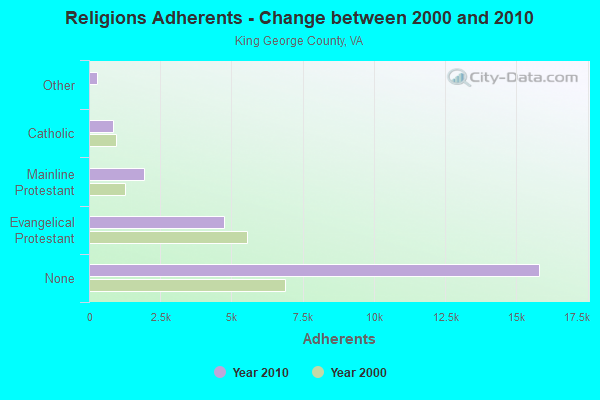
Religion statistics for King George County
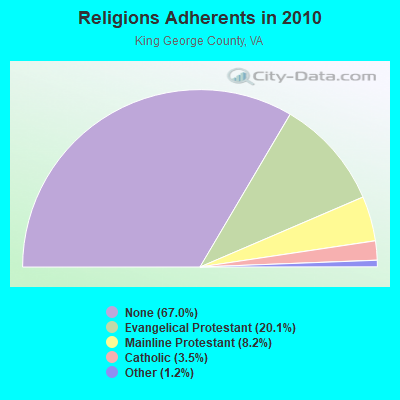
| Religion | Adherents | Congregations |
|---|---|---|
| Evangelical Protestant | 4,743 | 19 |
| Mainline Protestant | 1,932 | 7 |
| Catholic | 825 | 1 |
| Other | 274 | 2 |
| None | 15,810 | - |
Source: Clifford Grammich, Kirk Hadaway, Richard Houseal, Dale E.Jones, Alexei Krindatch, Richie Stanley and Richard H.Taylor. 2012. 2010 U.S.Religion Census: Religious Congregations & Membership Study. Association of Statisticians of American Religious Bodies. Jones, Dale E., et al. 2002. Congregations and Membership in the United States 2000. Nashville, TN: Glenmary Research Center.
Food Environment Statistics:
| King George County: | 1.78 / 10,000 pop. |
| State: | 2.03 / 10,000 pop. |
| King George County: | 4.44 / 10,000 pop. |
| Virginia: | 4.03 / 10,000 pop. |
| This county: | 6.66 / 10,000 pop. |
| State: | 7.65 / 10,000 pop. |
| King George County: | 8.4% |
| Virginia: | 9.3% |
| King George County: | 28.7% |
| State: | 26.7% |
| Here: | 16.2% |
| State: | 18.6% |
Agriculture in King George County:
Average size of farms: 189 acresAverage value of agricultural products sold per farm: $17,573
Average value of crops sold per acre for harvested cropland: $199.08
The value of livestock, poultry, and their products as a percentage of the total market value of agricultural products sold: 21.26%
Average total farm production expenses per farm: $19,125
Harvested cropland as a percentage of land in farms: 36.84%
Average market value of all machinery and equipment per farm: $37,840
The percentage of farms operated by a family or individual: 91.72%
Average age of principal farm operators: 59 years
Average number of cattle and calves per 100 acres of all land in farms: 7.45
Corn for grain: 2841 harvested acres
All wheat for grain: 1185 harvested acres
Soybeans for beans: 4007 harvested acres
Vegetables: 275 harvested acres
Land in orchards: 52 acres
Earthquake activity:
King George County-area historical earthquake activity is significantly above Virginia state average. It is 56% smaller than the overall U.S. average.On 8/23/2011 at 17:51:04, a magnitude 5.8 (5.8 MW, Depth: 3.7 mi, Class: Moderate, Intensity: VI - VII) earthquake occurred 50.2 miles away from King George County center
On 8/25/2011 at 05:07:52, a magnitude 4.5 (4.5 ML, Depth: 4.2 mi, Class: Light, Intensity: IV - V) earthquake occurred 50.3 miles away from the county center
On 12/9/2003 at 20:59:18, a magnitude 4.5 (4.5 ML, Depth: 6.2 mi) earthquake occurred 62.8 miles away from the county center
On 12/9/2003 at 20:59:14, a magnitude 4.5 (4.5 MB, 4.5 LG) earthquake occurred 63.7 miles away from the county center
On 8/24/2011 at 00:04:36, a magnitude 4.2 (4.2 ML) earthquake occurred 50.9 miles away from King George County center
On 1/16/1994 at 01:49:16, a magnitude 4.6 (4.6 MB, 4.6 LG, Depth: 3.1 mi) earthquake occurred 153.1 miles away from the county center
Magnitude types: regional Lg-wave magnitude (LG), body-wave magnitude (MB), local magnitude (ML), moment magnitude (MW)
Most recent natural disasters:
- Virginia Covid-19 Pandemic, Incident Period: January 20, 2020, Major Disaster (Presidential) Declared DR-4512-VA: April 2, 2020, FEMA Id: 4512, Natural disaster type: Other
- Virginia Severe Winter Storm And Snowstorm, Incident Period: January 22, 2016 to January 23, 2016, Major Disaster (Presidential) Declared DR-4262: March 07, 2016, FEMA Id: 4262, Natural disaster type: Snowstorm, Winter Storm
- Virginia Hurricane Sandy, Incident Period: October 26, 2012 to November 01, 2012, Emergency Declared EM-3359: October 29, 2012, FEMA Id: 3359, Natural disaster type: Hurricane
- Virginia Remnants of Tropical Storm Lee, Incident Period: September 08, 2011 to September 09, 2011, Major Disaster (Presidential) Declared DR-4045: November 17, 2011, FEMA Id: 4045, Natural disaster type: Tropical Storm
- Virginia Hurricane Irene, Incident Period: August 26, 2011 to September 04, 2011, Emergency Declared EM-3329: August 26, 2011, FEMA Id: 3329, Natural disaster type: Hurricane
- Virginia Hurricane Irene, Incident Period: August 26, 2011 to August 28, 2011, Major Disaster (Presidential) Declared DR-4024: September 03, 2011, FEMA Id: 4024, Natural disaster type: Hurricane
- Virginia Earthquake, Incident Period: August 23, 2011 to October 25, 2011, Major Disaster (Presidential) Declared DR-4042: November 04, 2011, FEMA Id: 4042, Natural disaster type: Earthquake
- Virginia Severe Winter Storms and Snowstorms, Incident Period: February 05, 2010 to February 11, 2010, Major Disaster (Presidential) Declared DR-1905: April 27, 2010, FEMA Id: 1905, Natural disaster type: Snowstorm, Winter Storm
- Virginia Severe Winter Storm and Snowstorm, Incident Period: December 18, 2009 to December 20, 2009, Major Disaster (Presidential) Declared DR-1874: February 16, 2010, FEMA Id: 1874, Natural disaster type: Snowstorm, Winter Storm
- Virginia Severe Storms and Flooding, Including Severe Storms and Flooding Associated with Tropical Depression Ernesto, Incident Period: August 29, 2006 to September 07, 2006, Major Disaster (Presidential) Declared DR-1661: September 22, 2006, FEMA Id: 1661, Natural disaster type: Storm, Flood, Tropical Depression
- 12 other natural disasters have been reported since 1953.
The number of natural disasters in King George County (22) is greater than the US average (15).
Major Disasters (Presidential) Declared: 17
Emergencies Declared: 5
Causes of natural disasters: Hurricanes: 7, Winter Storms: 5, Floods: 4, Storms: 4, Snowstorms: 3, Tropical Storms: 2, Blizzard: 1, Drought: 1, Earthquake: 1, Ice Storm: 1, Tornado: 1, Tropical Depression: 1, Other: 1 (Note: some incidents may be assigned to more than one category).

Means of transportation to work:
- Drove a car alone: 10,909 (75.2%)
- Carpooled: 1,214 (8.4%)
- Bus: 16 (0.1%)
- Long-distance train or commuter rail: 16 (0.1%)
- Taxicab, motorcycle, or other means: 124 (0.9%)
- Bicycle: 55 (0.4%)
- Walked: 109 (0.8%)
- Worked at home: 1,902 (13.1%)


- Health care and social assistance (15%)
- Public administration (13%)
- Educational services (12%)
- Retail trade (11%)
- Professional, scientific, and technical services (8%)
- Other services, except public administration (5%)
- Accommodation and food services (4%)

- Health care and social assistance (19%)
- Public administration (16%)
- Educational services (15%)
- Retail trade (14%)
- Professional, scientific, and technical services (10%)
- Other services, except public administration (6%)
- Accommodation and food services (6%)

- Management occupations (16%)
- Architecture and engineering occupations (11%)
- Computer and mathematical occupations (11%)
- Transportation occupations (7%)
- Construction and extraction occupations (7%)
- Installation, maintenance, and repair occupations (6%)
- Sales and related occupations (6%)

- Office and administrative support occupations (15%)
- Management occupations (14%)
- Educational instruction, and library occupations (13%)
- Sales and related occupations (12%)
- Business and financial operations occupations (8%)
- Computer and mathematical occupations (6%)
- Health diagnosing and treating practitioners and other technical occupations (5%)

- Mexico (18%)
- Trinidad and Tobago (11%)
- El Salvador (9%)
- Somalia (8%)
- China, excluding Hong Kong and Taiwan (7%)
- Philippines (5%)
- Pakistan (5%)

- American (15%)
- English (10%)
- Irish (9%)
- German (9%)
- European (4%)
- Italian (3%)
- Dutch (1%)


People in group quarters in King George County, Virginia in 2010:
- 188 people in military barracks and dormitories (nondisciplinary)
- 108 people in nursing facilities/skilled-nursing facilities
- 5 people in group homes intended for adults
125 people in nursing homes
11.02% of this county's 2021 resident taxpayers lived in other counties in 2020 ($63,025 average adjusted gross income)
| Here: | 11.02% |
| Virginia average: | 10.16% |
10 or fewer of this county's residents moved from foreign countries.
6.32% relocated from other counties in Virginia ($36,431 average AGI)
4.70% relocated from other states ($26,594 average AGI)
King George County: 4.70% Virginia average: 3.91%

Top counties from which taxpayers relocated into this county between 2020 and 2021:
| from Stafford County, VA | |
| from Spotsylvania County, VA | |
| from Westmoreland County, VA | |
| from Charles County, MD | |
| from Prince William County, VA | |
| from Fredericksburg city, VA | |
| from Caroline County, VA |
9.90% of this county's 2020 resident taxpayers moved to other counties in 2021 ($69,165 average adjusted gross income)
| Here: | 9.90% |
| Virginia average: | 10.20% |
0.30% of residents moved to foreign countries ($1,713 average AGI)
King George County: 0.30% Virginia average: 0.09%
5.55% relocated to other counties in Virginia ($38,662 average AGI)
4.05% relocated to other states ($28,791 average AGI)
King George County: 4.05% Virginia average: 3.98%

Top counties to which taxpayers relocated from this county between 2020 and 2021:
| to Spotsylvania County, VA | |
| to Westmoreland County, VA | |
| to Stafford County, VA | |
| to Caroline County, VA | |
| to Fredericksburg city, VA | |
| to San Diego County, CA | |
| to Charles County, MD |
Births per 1000 population from 1990 to 1999: 15.2
Births per 1000 population from 2000 to 2006: 14.7

Deaths per 1000 population from 1990 to 1999: 7.1
Deaths per 1000 population from 2000 to 2009: 6.7
Deaths per 1000 population from 2010 to 2020: 6.8

Infant deaths per 1000 live births from 1990 to 1999: 7.4
Infant deaths per 1000 live births from 2000 to 2006: 6.5

Persons under 19 years old without health insurance coverage in 2018: 4.2%


Persons enrolled in hospital insurance and/or supplemental medical insurance (Medicare) in July 1, 2007: 2,300 (1,941 aged, 359 disabled)
Children under 18 without health insurance coverage in 2007: 778 (12%)


Most common underlying causes of death in King George County, Virginia in 1999 - 2019:
- Bronchus or lung, unspecified - Malignant neoplasms (169)
- Unspecified dementia (43)
- Acute myocardial infarction, unspecified (37)
- Septicaemia, unspecified (11)
- Alzheimer disease, unspecified (10)
- Atherosclerotic heart disease (10)
- Chronic obstructive pulmonary disease, unspecified (10)
Population without health insurance coverage in 2000: 11%
Children under 18 without health insurance coverage in 2000: 9%
Medical specialist MDs per 100,000 population in 2005: 664
Dentists per 100,000 population in 1998: 10
Total births per 100,000 population, July 2005 - July 2006 : 6
Total deaths per 100,000 population, July 2005 - July 2006: 92
Limited-service eating places per 100,000 population in 2005 : 15
Household type by relationship:
Households: 27,169- Male householders: 5,553 (1,144 living alone), Female householders: 4,444 (1,076 living alone)
5,807 spouses (5,763 opposite-sex spouses), 675 unmarried partners, (618 opposite-sex unmarried partners), 8,308 children (7,531 natural, 187 adopted, 582 stepchildren), 581 grandchildren, 288 brothers or sisters, 326 parents, 6 foster children, 345 other relatives, 577 non-relatives
- In group quarters: 251
Size of family households: 3,258 2-persons, 1,415 3-persons, 1,280 4-persons, 699 5-persons, 280 6-persons, 269 7-or-more-persons.
Size of nonfamily households: 2,219 1-person, 520 2-persons, 34 3-persons, 12 4-persons, 19 5-persons.
4,964 married couples with children.
837 single-parent households (300 men, 537 women).
94.5% of residents of King George speak English at home.
3.0% of residents speak Spanish at home (64% speak English very well, 8% speak English well, 19% speak English not well, 9% don't speak English at all).
1.1% of residents speak other Indo-European language at home (90% speak English very well, 10% speak English well).
0.7% of residents speak Asian or Pacific Island language at home (41% speak English very well, 51% speak English well, 8% speak English not well).
0.3% of residents speak other language at home (39% speak English very well, 18% speak English well, 43% speak English not well).
In fiscal year 2004:
Federal Government expenditure: $678,249,000 ($35,043 per capita)
Department of Defense expenditure: $596,956,000
Federal direct payments to individuals for retirement and disability: $60,380,000
Federal other direct payments to individuals: $12,113,000
Federal direct payments not to individuals: $498,000
Federal grants: $6,082,000
Federal procurement contracts: $323,138,000 ($311,994,000 Department of Defense)
Federal salaries and wages: $276,038,000 ($272,407,000 Department of Defense)
Federal Government direct loans: $654,000
Federal guaranteed/insured loans: $34,142,000
Federal Government insurance: $5,109,000
Population change from April 1, 2000 to July 1, 2005:
Births: 1,357| Here: | 66 per 1000 residents |
| State: | 70 per 1000 residents |
Deaths: 650
| Here: | 31 per 1000 residents |
| State: | 40 per 1000 residents |
Net international migration: +55
| Here: | +3 per 1000 residents |
| State: | +18 per 1000 residents |
Net internal migration: +3,115
| Here: | +151 per 1000 residents |
| State: | +14 per 1000 residents |

Total withdrawal of fresh water for public supply: 0.79 millions of gallons per day (all from ground)
| Here: | 7.3 |
| State: | 7.0 |
| Here: | 5.3 |
| State: | 4.3 |

- Year house built in King George County, Virginia
- 872020 or later
- 1,6922010 to 2019
- 3,4712000 to 2009
- 1,2851990 to 1999
- 1,2961980 to 1989
- 1,2231970 to 1979
- 6291960 to 1969
- 5061950 to 1959
- 1441940 to 1949
- 3681939 or earlier

- Rooms in owner-occupied houses in King George County, Virginia
- 01 room
- 02 rooms
- 253 rooms
- 5284 rooms
- 1,0265 rooms
- 1,3026 rooms
- 1,0897 rooms
- 1,2058 rooms
- 2,4169+ rooms

- Rooms in renter-occupied apartments in King George County, Virginia
- 281 room
- 92 rooms
- 1733 rooms
- 6164 rooms
- 4405 rooms
- 4606 rooms
- 4007 rooms
- 1538 rooms
- 1259+ rooms

- Bedrooms in owner-occupied houses in King George County, Virginia
- 0no bedroom
- 311 bedroom
- 5332 bedrooms
- 3,6873 bedrooms
- 2,5134 bedrooms
- 8295+ bedrooms

- Bedrooms in renter-occupied apartments in King George County, Virginia
- 55no bedroom
- 1451 bedroom
- 9272 bedrooms
- 9313 bedrooms
- 2804 bedrooms
- 775+ bedrooms

- Cars and other vehicles available in King George County in owner-occupied houses/condos
- 86no vehicle
- 1,2531 vehicle
- 2,9412 vehicles
- 2,0103 vehicles
- 5474 vehicles
- 7265+ vehicles

- Cars and other vehicles available in King George County in renter-occupied apartments
- 95no vehicle
- 1,0361 vehicle
- 9632 vehicles
- 1583 vehicles
- 1374 vehicles
- 275+ vehicles
88.3% of King George County residents lived in the same house 1 years ago.
Out of people who lived in different houses, 19% lived in this county.
Out of people who lived in different counties, 80% lived in Virginia.
| King George County: | 88.3% |
| State average: | 86.6% |
Place of birth for U.S.-born residents:
- This state: 12,940
- Other state: 12,751
- Northeast: 2,889
- Midwest: 1,725
- South: 6,398
- West: 1,748


- 81.0%Electricity
- 9.8%Bottled, tank, or LP gas
- 2.9%Fuel oil, kerosene, etc.
- 2.9%Wood
- 2.3%Utility gas
- 1.0%Other fuel
- 0.2%Solar energy

- 84.1%Electricity
- 7.7%Fuel oil, kerosene, etc.
- 4.0%Bottled, tank, or LP gas
- 2.2%Utility gas
- 1.2%No fuel used
- 0.7%Wood
- 0.2%Other fuel
Private vs. public school enrollment:
| Here: | 19.8% |
| Virginia: | 13.2% |
| Here: | 15.1% |
| Virginia: | 10.2% |
| Here: | 9.4% |
| Virginia: | 18.7% |


King George County government finances - Expenditure in 2018:
- Bond Funds - Cash and Securities: $22,430,000
Cash and Securities: $21,356,000
- Charges - Sewerage: $4,175,000
Sewerage: $3,039,000
Other: $845,000
Elementary and Secondary Education School Lunch: $749,000
Other: $503,000
Parks and Recreation: $465,000
Parks and Recreation: $427,000
Solid Waste Management: $233,000
Housing and Community Development: $146,000
Elementary and Secondary Education School Tuition and Transportation: $47,000
Elementary and Secondary Education School Tuition and Transportation: $43,000
Elementary and Secondary Education - Other: $35,000
Elementary and Secondary Education - Other: $11,000
- Construction - Elementary and Secondary Education: $3,967,000
Parks and Recreation: $1,570,000
Sewerage: $1,446,000
Water Utilities: $1,234,000
Regular Highways: $1,057,000
Libraries: $504,000
Central Staff Services: $220,000
Local Fire Protection: $167,000
Elementary and Secondary Education: $77,000
Housing and Community Development: $75,000
Judicial and Legal Services: $75,000
Parks and Recreation: $43,000
Natural Resources - Other: $35,000
General - Other: $30,000
Local Fire Protection: $15,000
Judicial and Legal Services: $2,000
- Current Operations - Elementary and Secondary Education: $47,034,000
Elementary and Secondary Education: $44,700,000
General - Other: $6,696,000
Public Welfare - Other: $4,942,000
Police Protection: $4,736,000
Police Protection: $4,366,000
Local Fire Protection: $3,634,000
Sewerage: $2,432,000
General Public Buildings: $1,949,000
Water Utilities: $1,741,000
Sewerage: $1,724,000
Correctional Institutions: $1,698,000
General Public Buildings: $1,661,000
Financial Administration: $1,639,000
Water Utilities: $1,574,000
Judicial and Legal Services: $1,514,000
Judicial and Legal Services: $1,510,000
Housing and Community Development: $1,304,000
Financial Administration: $1,252,000
Central Staff Services: $1,201,000
Correctional Institutions: $990,000
Local Fire Protection: $982,000
Parks and Recreation: $916,000
General - Other: $835,000
Health - Other: $832,000
Parks and Recreation: $824,000
Housing and Community Development: $801,000
Health - Other: $752,000
Solid Waste Management: $617,000
Libraries: $605,000
Libraries: $555,000
Central Staff Services: $547,000
Solid Waste Management: $227,000
Regular Highways: $176,000
Natural Resources - Other: $161,000
Regular Highways: $113,000
Natural Resources - Other: $58,000
- Federal Intergovernmental - Education: $2,370,000
Other: $1,651,000
Other: $1,175,000
Public Welfare: $959,000
Education: $248,000
Water Utilities: $53,000
Sewerage: $53,000
- General - Interest on Debt: $3,756,000
Interest on Debt: $3,565,000
- Intergovernmental to Local - Other - Elementary and Secondary Education: $281,000
Other - Elementary and Secondary Education: $173,000
- Local Intergovernmental - Education: $1,065,000
Education: $537,000
- Long Term Debt - Beginning Outstanding - Unspecified Public Purpose: $81,770,000
Outstanding Unspecified Public Purpose: $78,740,000
Beginning Outstanding - Unspecified Public Purpose: $73,577,000
Outstanding Unspecified Public Purpose: $69,367,000
Beginning Outstanding - Public Debt for Private Purpose: $41,837,000
Outstanding Nonguaranteed - Industrial Revenue: $37,721,000
Retired Unspecified Public Purpose: $23,270,000
Issue, Unspecified Public Purpose: $19,060,000
Retired Nonguaranteed - Public Debt for Private Purpose: $4,116,000
Retired Unspecified Public Purpose: $3,030,000
- Miscellaneous - Interest Earnings: $3,795,000
Interest Earnings: $1,357,000
General Revenue - Other: $1,212,000
General Revenue - Other: $426,000
Fines and Forfeits: $335,000
Rents: $108,000
Sale of Property: $7,000
- Other Capital Outlay - General - Other: $1,115,000
Elementary and Secondary Education: $586,000
Police Protection: $447,000
Elementary and Secondary Education: $347,000
Central Staff Services: $58,000
- Other Funds - Cash and Securities: $39,926,000
Cash and Securities: $30,019,000
- Revenue - Water Utilities: $2,989,000
Water Utilities: $2,102,000
- Sinking Funds - Cash and Securities: $74,175,000
- State Intergovernmental - Education: $29,360,000
Education: $27,248,000
Other: $7,099,000
General Local Government Support: $3,000,000
Other: $2,302,000
Public Welfare: $1,696,000
Sewerage: $258,000
Water Utilities: $258,000
- Tax - Property: $29,238,000
Property: $24,163,000
Other License: $10,309,000
Other: $8,547,000
Other License: $8,093,000
General Sales and Gross Receipts: $3,191,000
General Sales and Gross Receipts: $2,552,000
Occupation and Business License - Other: $1,729,000
Occupation and Business License - Other: $1,419,000
Other Selective Sales: $1,350,000
Motor Vehicle License: $677,000
Motor Vehicle License: $669,000
Documentary and Stock Transfer: $433,000
Documentary and Stock Transfer: $433,000
Public Utilities Sales: $288,000
Public Utilities Sales: $250,000
- Total Salaries and Wages: $30,743,000
: $28,262,000
- Water Utilities - Interest on Debt: $544,000
King George County government finances - Revenue in 2018:
- Bond Funds - Cash and Securities: $22,430,000
Cash and Securities: $21,356,000
- Charges - Sewerage: $4,175,000
Sewerage: $3,039,000
Other: $845,000
Elementary and Secondary Education School Lunch: $749,000
Other: $503,000
Parks and Recreation: $465,000
Parks and Recreation: $427,000
Solid Waste Management: $233,000
Housing and Community Development: $146,000
Elementary and Secondary Education School Tuition and Transportation: $47,000
Elementary and Secondary Education School Tuition and Transportation: $43,000
Elementary and Secondary Education - Other: $35,000
Elementary and Secondary Education - Other: $11,000
- Construction - Elementary and Secondary Education: $3,967,000
Parks and Recreation: $1,570,000
Sewerage: $1,446,000
Water Utilities: $1,234,000
Regular Highways: $1,057,000
Libraries: $504,000
Central Staff Services: $220,000
Local Fire Protection: $167,000
Elementary and Secondary Education: $77,000
Housing and Community Development: $75,000
Judicial and Legal Services: $75,000
Parks and Recreation: $43,000
Natural Resources - Other: $35,000
General - Other: $30,000
Local Fire Protection: $15,000
Judicial and Legal Services: $2,000
- Current Operations - Elementary and Secondary Education: $47,034,000
Elementary and Secondary Education: $44,700,000
General - Other: $6,696,000
Public Welfare - Other: $4,942,000
Police Protection: $4,736,000
Police Protection: $4,366,000
Local Fire Protection: $3,634,000
Sewerage: $2,432,000
General Public Buildings: $1,949,000
Water Utilities: $1,741,000
Sewerage: $1,724,000
Correctional Institutions: $1,698,000
General Public Buildings: $1,661,000
Financial Administration: $1,639,000
Water Utilities: $1,574,000
Judicial and Legal Services: $1,514,000
Judicial and Legal Services: $1,510,000
Housing and Community Development: $1,304,000
Financial Administration: $1,252,000
Central Staff Services: $1,201,000
Correctional Institutions: $990,000
Local Fire Protection: $982,000
Parks and Recreation: $916,000
General - Other: $835,000
Health - Other: $832,000
Parks and Recreation: $824,000
Housing and Community Development: $801,000
Health - Other: $752,000
Solid Waste Management: $617,000
Libraries: $605,000
Libraries: $555,000
Central Staff Services: $547,000
Solid Waste Management: $227,000
Regular Highways: $176,000
Natural Resources - Other: $161,000
Regular Highways: $113,000
Natural Resources - Other: $58,000
- Federal Intergovernmental - Education: $2,370,000
Other: $1,651,000
Other: $1,175,000
Public Welfare: $959,000
Education: $248,000
Water Utilities: $53,000
Sewerage: $53,000
- General - Interest on Debt: $3,756,000
Interest on Debt: $3,565,000
- Intergovernmental to Local - Other - Elementary and Secondary Education: $281,000
Other - Elementary and Secondary Education: $173,000
- Local Intergovernmental - Education: $1,065,000
Education: $537,000
- Long Term Debt - Beginning Outstanding - Unspecified Public Purpose: $81,770,000
Outstanding Unspecified Public Purpose: $78,740,000
Beginning Outstanding - Unspecified Public Purpose: $73,577,000
Outstanding Unspecified Public Purpose: $69,367,000
Beginning Outstanding - Public Debt for Private Purpose: $41,837,000
Outstanding Nonguaranteed - Industrial Revenue: $37,721,000
Retired Unspecified Public Purpose: $23,270,000
Issue, Unspecified Public Purpose: $19,060,000
Retired Nonguaranteed - Public Debt for Private Purpose: $4,116,000
Retired Unspecified Public Purpose: $3,030,000
- Miscellaneous - Interest Earnings: $3,795,000
Interest Earnings: $1,357,000
General Revenue - Other: $1,212,000
General Revenue - Other: $426,000
Fines and Forfeits: $335,000
Rents: $108,000
Sale of Property: $7,000
- Other Capital Outlay - General - Other: $1,115,000
Elementary and Secondary Education: $586,000
Police Protection: $447,000
Elementary and Secondary Education: $347,000
Central Staff Services: $58,000
- Other Funds - Cash and Securities: $39,926,000
Cash and Securities: $30,019,000
- Revenue - Water Utilities: $2,989,000
Water Utilities: $2,102,000
- Sinking Funds - Cash and Securities: $74,175,000
- State Intergovernmental - Education: $29,360,000
Education: $27,248,000
Other: $7,099,000
General Local Government Support: $3,000,000
Other: $2,302,000
Public Welfare: $1,696,000
Sewerage: $258,000
Water Utilities: $258,000
- Tax - Property: $29,238,000
Property: $24,163,000
Other License: $10,309,000
Other: $8,547,000
Other License: $8,093,000
General Sales and Gross Receipts: $3,191,000
General Sales and Gross Receipts: $2,552,000
Occupation and Business License - Other: $1,729,000
Occupation and Business License - Other: $1,419,000
Other Selective Sales: $1,350,000
Motor Vehicle License: $677,000
Motor Vehicle License: $669,000
Documentary and Stock Transfer: $433,000
Documentary and Stock Transfer: $433,000
Public Utilities Sales: $288,000
Public Utilities Sales: $250,000
- Total Salaries and Wages: $30,743,000
: $28,262,000
- Water Utilities - Interest on Debt: $544,000
King George County government finances - Debt in 2018:
- Bond Funds - Cash and Securities: $22,430,000
Cash and Securities: $21,356,000
- Charges - Sewerage: $4,175,000
Sewerage: $3,039,000
Other: $845,000
Elementary and Secondary Education School Lunch: $749,000
Other: $503,000
Parks and Recreation: $465,000
Parks and Recreation: $427,000
Solid Waste Management: $233,000
Housing and Community Development: $146,000
Elementary and Secondary Education School Tuition and Transportation: $47,000
Elementary and Secondary Education School Tuition and Transportation: $43,000
Elementary and Secondary Education - Other: $35,000
Elementary and Secondary Education - Other: $11,000
- Construction - Elementary and Secondary Education: $3,967,000
Parks and Recreation: $1,570,000
Sewerage: $1,446,000
Water Utilities: $1,234,000
Regular Highways: $1,057,000
Libraries: $504,000
Central Staff Services: $220,000
Local Fire Protection: $167,000
Elementary and Secondary Education: $77,000
Housing and Community Development: $75,000
Judicial and Legal Services: $75,000
Parks and Recreation: $43,000
Natural Resources - Other: $35,000
General - Other: $30,000
Local Fire Protection: $15,000
Judicial and Legal Services: $2,000
- Current Operations - Elementary and Secondary Education: $47,034,000
Elementary and Secondary Education: $44,700,000
General - Other: $6,696,000
Public Welfare - Other: $4,942,000
Police Protection: $4,736,000
Police Protection: $4,366,000
Local Fire Protection: $3,634,000
Sewerage: $2,432,000
General Public Buildings: $1,949,000
Water Utilities: $1,741,000
Sewerage: $1,724,000
Correctional Institutions: $1,698,000
General Public Buildings: $1,661,000
Financial Administration: $1,639,000
Water Utilities: $1,574,000
Judicial and Legal Services: $1,514,000
Judicial and Legal Services: $1,510,000
Housing and Community Development: $1,304,000
Financial Administration: $1,252,000
Central Staff Services: $1,201,000
Correctional Institutions: $990,000
Local Fire Protection: $982,000
Parks and Recreation: $916,000
General - Other: $835,000
Health - Other: $832,000
Parks and Recreation: $824,000
Housing and Community Development: $801,000
Health - Other: $752,000
Solid Waste Management: $617,000
Libraries: $605,000
Libraries: $555,000
Central Staff Services: $547,000
Solid Waste Management: $227,000
Regular Highways: $176,000
Natural Resources - Other: $161,000
Regular Highways: $113,000
Natural Resources - Other: $58,000
- Federal Intergovernmental - Education: $2,370,000
Other: $1,651,000
Other: $1,175,000
Public Welfare: $959,000
Education: $248,000
Water Utilities: $53,000
Sewerage: $53,000
- General - Interest on Debt: $3,756,000
Interest on Debt: $3,565,000
- Intergovernmental to Local - Other - Elementary and Secondary Education: $281,000
Other - Elementary and Secondary Education: $173,000
- Local Intergovernmental - Education: $1,065,000
Education: $537,000
- Long Term Debt - Beginning Outstanding - Unspecified Public Purpose: $81,770,000
Outstanding Unspecified Public Purpose: $78,740,000
Beginning Outstanding - Unspecified Public Purpose: $73,577,000
Outstanding Unspecified Public Purpose: $69,367,000
Beginning Outstanding - Public Debt for Private Purpose: $41,837,000
Outstanding Nonguaranteed - Industrial Revenue: $37,721,000
Retired Unspecified Public Purpose: $23,270,000
Issue, Unspecified Public Purpose: $19,060,000
Retired Nonguaranteed - Public Debt for Private Purpose: $4,116,000
Retired Unspecified Public Purpose: $3,030,000
- Miscellaneous - Interest Earnings: $3,795,000
Interest Earnings: $1,357,000
General Revenue - Other: $1,212,000
General Revenue - Other: $426,000
Fines and Forfeits: $335,000
Rents: $108,000
Sale of Property: $7,000
- Other Capital Outlay - General - Other: $1,115,000
Elementary and Secondary Education: $586,000
Police Protection: $447,000
Elementary and Secondary Education: $347,000
Central Staff Services: $58,000
- Other Funds - Cash and Securities: $39,926,000
Cash and Securities: $30,019,000
- Revenue - Water Utilities: $2,989,000
Water Utilities: $2,102,000
- Sinking Funds - Cash and Securities: $74,175,000
- State Intergovernmental - Education: $29,360,000
Education: $27,248,000
Other: $7,099,000
General Local Government Support: $3,000,000
Other: $2,302,000
Public Welfare: $1,696,000
Sewerage: $258,000
Water Utilities: $258,000
- Tax - Property: $29,238,000
Property: $24,163,000
Other License: $10,309,000
Other: $8,547,000
Other License: $8,093,000
General Sales and Gross Receipts: $3,191,000
General Sales and Gross Receipts: $2,552,000
Occupation and Business License - Other: $1,729,000
Occupation and Business License - Other: $1,419,000
Other Selective Sales: $1,350,000
Motor Vehicle License: $677,000
Motor Vehicle License: $669,000
Documentary and Stock Transfer: $433,000
Documentary and Stock Transfer: $433,000
Public Utilities Sales: $288,000
Public Utilities Sales: $250,000
- Total Salaries and Wages: $30,743,000
: $28,262,000
- Water Utilities - Interest on Debt: $544,000
King George County government finances - Cash and Securities in 2018:
- Bond Funds - Cash and Securities: $22,430,000
Cash and Securities: $21,356,000
- Charges - Sewerage: $4,175,000
Sewerage: $3,039,000
Other: $845,000
Elementary and Secondary Education School Lunch: $749,000
Other: $503,000
Parks and Recreation: $465,000
Parks and Recreation: $427,000
Solid Waste Management: $233,000
Housing and Community Development: $146,000
Elementary and Secondary Education School Tuition and Transportation: $47,000
Elementary and Secondary Education School Tuition and Transportation: $43,000
Elementary and Secondary Education - Other: $35,000
Elementary and Secondary Education - Other: $11,000
- Construction - Elementary and Secondary Education: $3,967,000
Parks and Recreation: $1,570,000
Sewerage: $1,446,000
Water Utilities: $1,234,000
Regular Highways: $1,057,000
Libraries: $504,000
Central Staff Services: $220,000
Local Fire Protection: $167,000
Elementary and Secondary Education: $77,000
Housing and Community Development: $75,000
Judicial and Legal Services: $75,000
Parks and Recreation: $43,000
Natural Resources - Other: $35,000
General - Other: $30,000
Local Fire Protection: $15,000
Judicial and Legal Services: $2,000
- Current Operations - Elementary and Secondary Education: $47,034,000
Elementary and Secondary Education: $44,700,000
General - Other: $6,696,000
Public Welfare - Other: $4,942,000
Police Protection: $4,736,000
Police Protection: $4,366,000
Local Fire Protection: $3,634,000
Sewerage: $2,432,000
General Public Buildings: $1,949,000
Water Utilities: $1,741,000
Sewerage: $1,724,000
Correctional Institutions: $1,698,000
General Public Buildings: $1,661,000
Financial Administration: $1,639,000
Water Utilities: $1,574,000
Judicial and Legal Services: $1,514,000
Judicial and Legal Services: $1,510,000
Housing and Community Development: $1,304,000
Financial Administration: $1,252,000
Central Staff Services: $1,201,000
Correctional Institutions: $990,000
Local Fire Protection: $982,000
Parks and Recreation: $916,000
General - Other: $835,000
Health - Other: $832,000
Parks and Recreation: $824,000
Housing and Community Development: $801,000
Health - Other: $752,000
Solid Waste Management: $617,000
Libraries: $605,000
Libraries: $555,000
Central Staff Services: $547,000
Solid Waste Management: $227,000
Regular Highways: $176,000
Natural Resources - Other: $161,000
Regular Highways: $113,000
Natural Resources - Other: $58,000
- Federal Intergovernmental - Education: $2,370,000
Other: $1,651,000
Other: $1,175,000
Public Welfare: $959,000
Education: $248,000
Water Utilities: $53,000
Sewerage: $53,000
- General - Interest on Debt: $3,756,000
Interest on Debt: $3,565,000
- Intergovernmental to Local - Other - Elementary and Secondary Education: $281,000
Other - Elementary and Secondary Education: $173,000
- Local Intergovernmental - Education: $1,065,000
Education: $537,000
- Long Term Debt - Beginning Outstanding - Unspecified Public Purpose: $81,770,000
Outstanding Unspecified Public Purpose: $78,740,000
Beginning Outstanding - Unspecified Public Purpose: $73,577,000
Outstanding Unspecified Public Purpose: $69,367,000
Beginning Outstanding - Public Debt for Private Purpose: $41,837,000
Outstanding Nonguaranteed - Industrial Revenue: $37,721,000
Retired Unspecified Public Purpose: $23,270,000
Issue, Unspecified Public Purpose: $19,060,000
Retired Nonguaranteed - Public Debt for Private Purpose: $4,116,000
Retired Unspecified Public Purpose: $3,030,000
- Miscellaneous - Interest Earnings: $3,795,000
Interest Earnings: $1,357,000
General Revenue - Other: $1,212,000
General Revenue - Other: $426,000
Fines and Forfeits: $335,000
Rents: $108,000
Sale of Property: $7,000
- Other Capital Outlay - General - Other: $1,115,000
Elementary and Secondary Education: $586,000
Police Protection: $447,000
Elementary and Secondary Education: $347,000
Central Staff Services: $58,000
- Other Funds - Cash and Securities: $39,926,000
Cash and Securities: $30,019,000
- Revenue - Water Utilities: $2,989,000
Water Utilities: $2,102,000
- Sinking Funds - Cash and Securities: $74,175,000
- State Intergovernmental - Education: $29,360,000
Education: $27,248,000
Other: $7,099,000
General Local Government Support: $3,000,000
Other: $2,302,000
Public Welfare: $1,696,000
Sewerage: $258,000
Water Utilities: $258,000
- Tax - Property: $29,238,000
Property: $24,163,000
Other License: $10,309,000
Other: $8,547,000
Other License: $8,093,000
General Sales and Gross Receipts: $3,191,000
General Sales and Gross Receipts: $2,552,000
Occupation and Business License - Other: $1,729,000
Occupation and Business License - Other: $1,419,000
Other Selective Sales: $1,350,000
Motor Vehicle License: $677,000
Motor Vehicle License: $669,000
Documentary and Stock Transfer: $433,000
Documentary and Stock Transfer: $433,000
Public Utilities Sales: $288,000
Public Utilities Sales: $250,000
- Total Salaries and Wages: $30,743,000
: $28,262,000
- Water Utilities - Interest on Debt: $544,000
Supplemental Security Income (SSI) in 2006:
- Total number of recipients: 194
- Number of aged recipients: 27
- Number of blind and disabled recipients: 167
- Number of recipients under 18: 31
- Number of recipients between 18 and 64: 115
- Number of recipients older than 64: 48
- Number of recipients also receiving OASDI: 68
- Amount of payments (thousands of dollars): 78
| Most common first names in King George County, VA among deceased individuals | ||
| Name | Count | Lived (average) |
|---|---|---|
| James | 96 | 72.6 years |
| Mary | 78 | 81.2 years |
| William | 74 | 75.2 years |
| John | 67 | 73.6 years |
| Robert | 58 | 70.6 years |
| Thomas | 48 | 70.0 years |
| George | 43 | 71.3 years |
| Charles | 41 | 72.0 years |
| Virginia | 30 | 75.6 years |
| Richard | 26 | 72.7 years |
| Most common last names in King George County, VA among deceased individuals | ||
| Last name | Count | Lived (average) |
|---|---|---|
| Johnson | 62 | 77.3 years |
| Smith | 32 | 71.5 years |
| Jones | 25 | 76.6 years |
| Lewis | 25 | 73.4 years |
| Green | 22 | 76.3 years |
| Rollins | 22 | 75.5 years |
| Jackson | 21 | 68.6 years |
| Morgan | 19 | 77.9 years |
| Brown | 18 | 75.0 years |
| Davis | 17 | 73.3 years |
| Businesses in King George County, VA | ||||
| Name | Count | Name | Count | |
|---|---|---|---|---|
| 7-Eleven | 3 | H&R Block | 1 | |
| Advance Auto Parts | 1 | Holiday Inn | 1 | |
| Arby's | 1 | KFC | 1 | |
| Burger King | 1 | McDonald's | 1 | |
| CVS | 1 | Pizza Hut | 1 | |
| Comfort Inn | 1 | Subway | 2 | |
| Curves | 1 | Taco Bell | 1 | |
| Domino's Pizza | 2 | True Value | 1 | |
| FedEx | 5 | U-Haul | 3 | |
| Ford | 1 | UPS | 3 | |
King George County on our top lists:
- #17 on the list of "Top 101 counties with the highest percentage of residents relocating to foreign countries in 2011"