Crime rate in McAllen, Texas (TX): murders, rapes, robberies, assaults, burglaries, thefts, auto thefts, arson, law enforcement employees, police officers, crime map
Crime rate in McAllen, TX
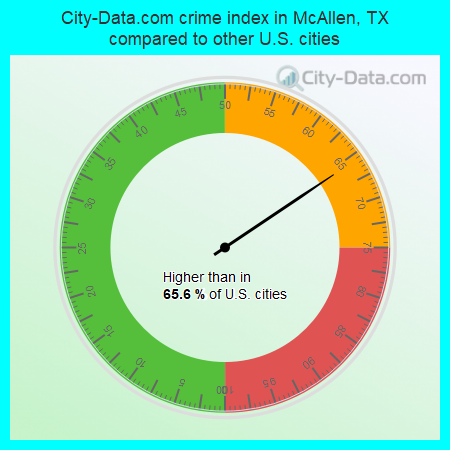
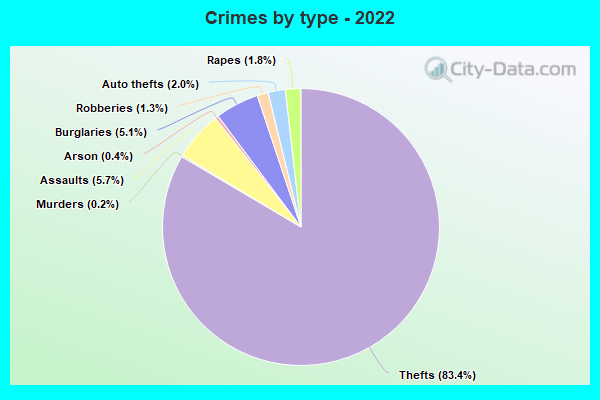
The 2022 crime rate in McAllen, TX is 155 (City-Data.com crime index), which is 1.6 times smaller than the U.S. average. It was higher than in 65.6% U.S. cities. The 2022 McAllen crime rate rose by 19% compared to 2021. In the last 5 years McAllen has seen rise of violent crime and decreasing property crime.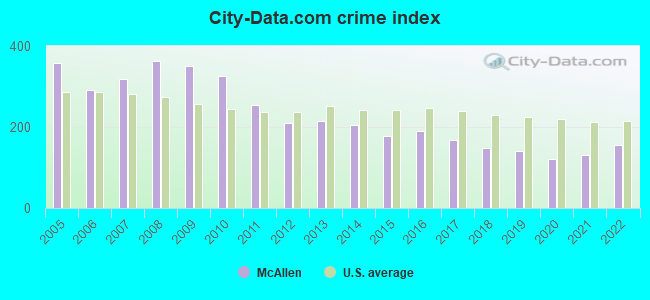
The City-Data.com crime index weighs serious crimes and violent crimes more heavily. Higher means more crime, U.S. average is 246.1. It adjusts for the number of visitors and daily workers commuting into cities.
- means the value is smaller than the state average.- means the value is about the same as the state average.
- means the value is bigger than the state average.
- means the value is much bigger than the state average.
According to our research of Texas and other state lists, there were 267 registered sex offenders living in McAllen, Texas as of June 16, 2024.
The ratio of all residents to sex offenders in McAllen is 532 to 1.
The ratio of registered sex offenders to all residents in this city is near the state average.
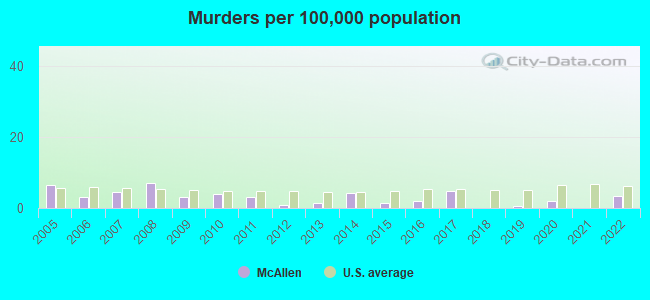
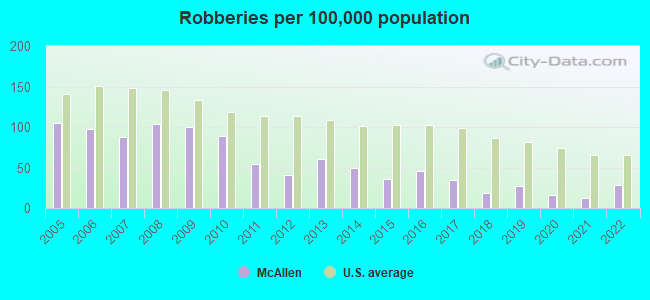
Violent crime rate in 2022
| McAllen: | 123.0 |
| U.S. Average: | 219.8 |
Violent crime rate in 2021
| McAllen: | 104.5 |
| U.S. Average: | 224.8 |
Violent crime rate in 2020
| McAllen: | 60.5 |
| U.S. Average: | 228.2 |
Violent crime rate in 2019
| McAllen: | 60.7 |
| U.S. Average: | 219.9 |
Violent crime rate in 2018
| McAllen: | 55.8 |
| U.S. Average: | 221.2 |
Violent crime rate in 2017
| McAllen: | 88.8 |
| U.S. Average: | 226.2 |
Violent crime rate in 2016
| McAllen: | 92.8 |
| U.S. Average: | 227.3 |
Violent crime rate in 2015
| McAllen: | 61.9 |
| U.S. Average: | 219.3 |
Violent crime rate in 2014
| McAllen: | 78.6 |
| U.S. Average: | 211.1 |
Violent crime rate in 2013
| McAllen: | 67.2 |
| U.S. Average: | 214.2 |
Violent crime rate in 2012
| McAllen: | 63.4 |
| U.S. Average: | 187.4 |
Violent crime rate in 2011
| McAllen: | 107.5 |
| U.S. Average: | 187.1 |
Violent crime rate in 2010
| McAllen: | 126.3 |
| U.S. Average: | 195.7 |
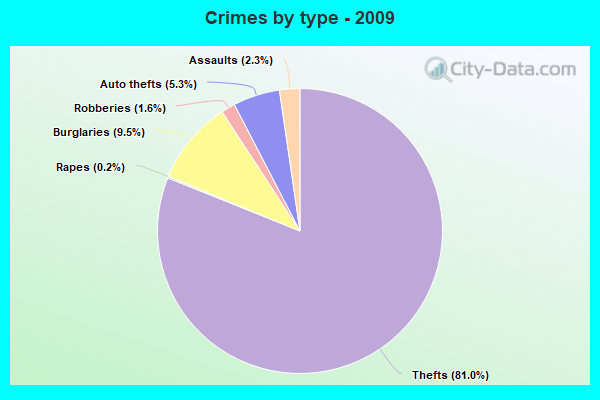
Violent crime rate in 2009
| McAllen: | 143.3 |
| U.S. Average: | 208.9 |
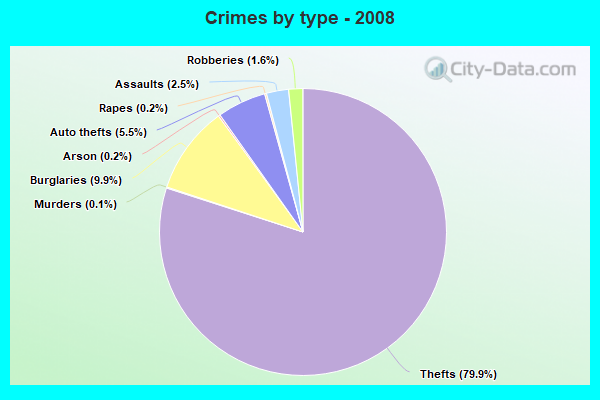
Violent crime rate in 2008
| McAllen: | 160.0 |
| U.S. Average: | 222.5 |
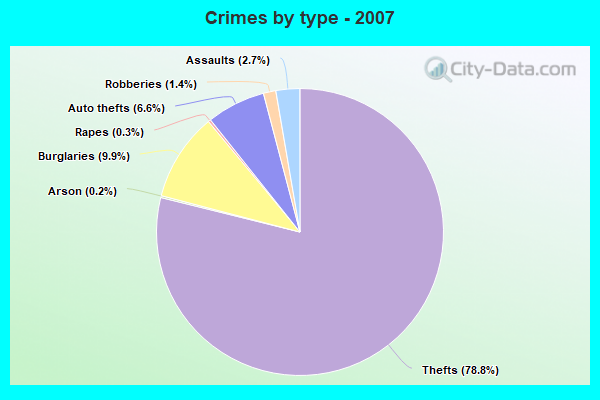
Violent crime rate in 2007
| McAllen: | 139.9 |
| U.S. Average: | 229.1 |
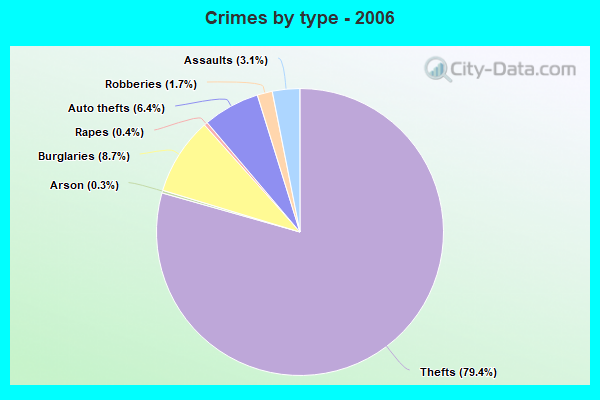
Violent crime rate in 2006
| McAllen: | 144.6 |
| U.S. Average: | 232.6 |
Violent crime rate in 2005
| McAllen: | 169.6 |
| U.S. Average: | 227.0 |
Property crime rate in 2022
| McAllen: | 118.3 |
| U.S. Average: | 166.5 |
Property crime rate in 2021
| McAllen: | 103.9 |
| U.S. Average: | 157.8 |
Property crime rate in 2020
| McAllen: | 114.3 |
| U.S. Average: | 169.6 |
Property crime rate in 2019
| McAllen: | 141.7 |
| U.S. Average: | 179.7 |
Property crime rate in 2018
| McAllen: | 158.5 |
| U.S. Average: | 190.2 |
Property crime rate in 2017
| McAllen: | 161.4 |
| U.S. Average: | 206.4 |
Property crime rate in 2016
| McAllen: | 200.3 |
| U.S. Average: | 216.6 |
Property crime rate in 2015
| McAllen: | 219.2 |
| U.S. Average: | 221.5 |
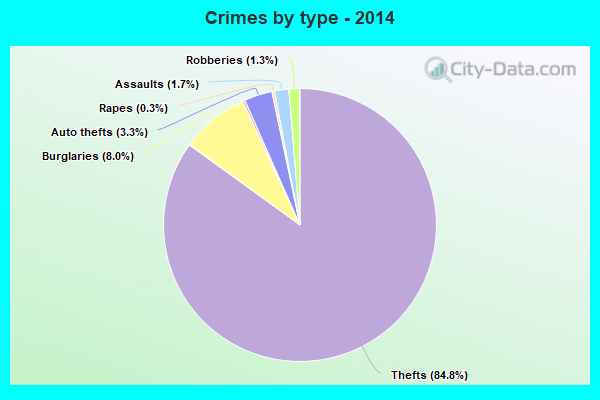
Property crime rate in 2014
| McAllen: | 236.2 |
| U.S. Average: | 230.8 |
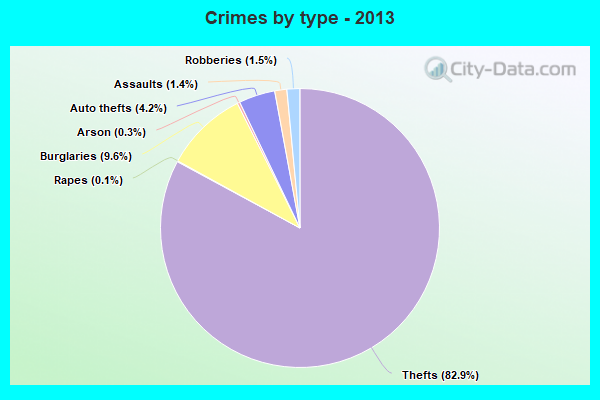
Property crime rate in 2013
| McAllen: | 275.5 |
| U.S. Average: | 250.4 |
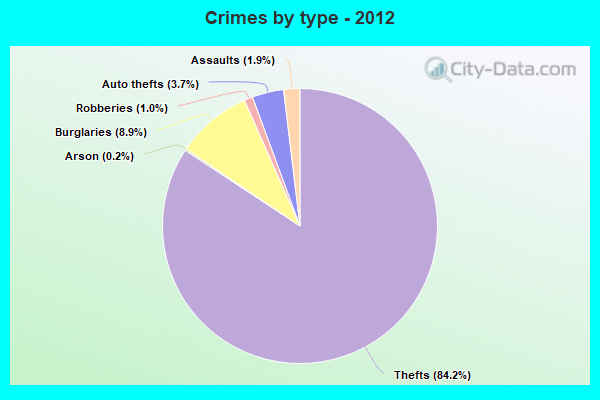
Property crime rate in 2012
| McAllen: | 272.4 |
| U.S. Average: | 267.3 |
Property crime rate in 2011
| McAllen: | 292.9 |
| U.S. Average: | 273.5 |
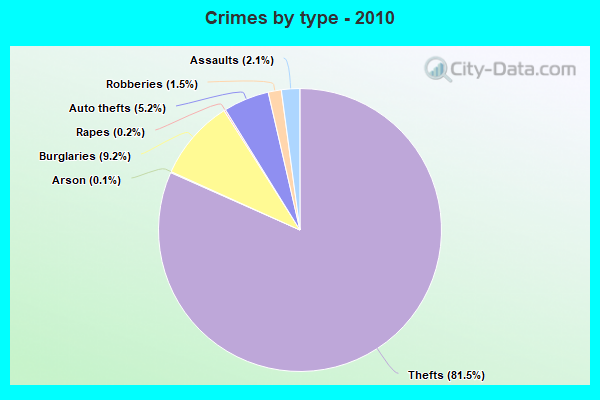
Property crime rate in 2010
| McAllen: | 398.0 |
| U.S. Average: | 276.4 |
Property crime rate in 2009
| McAllen: | 425.7 |
| U.S. Average: | 285.6 |
Property crime rate in 2008
| McAllen: | 432.4 |
| U.S. Average: | 302.2 |
Property crime rate in 2007
| McAllen: | 385.0 |
| U.S. Average: | 309.2 |
Property crime rate in 2006
| McAllen: | 334.0 |
| U.S. Average: | 317.3 |
Property crime rate in 2005
| McAllen: | 408.5 |
| U.S. Average: | 322.3 |


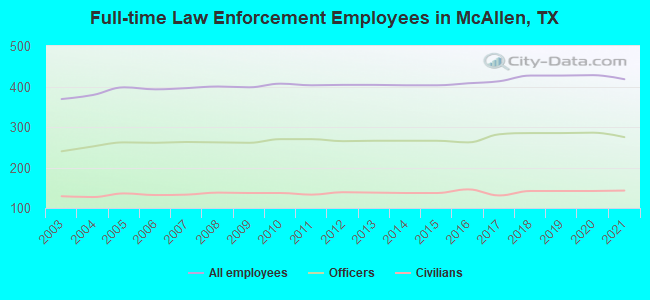
Full-time law enforcement employees in 2021, including police officers: 418 (275 officers - 235 male; 40 female).
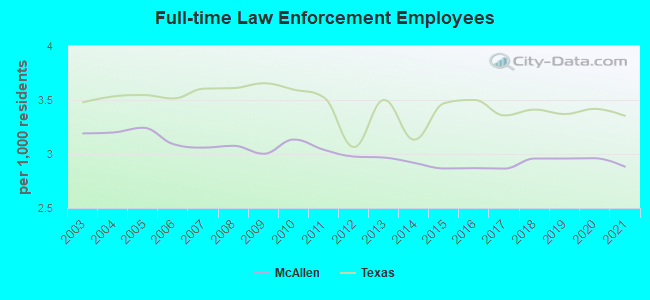
| Officers per 1,000 residents here: | 1.90 |
| Texas average: | 2.07 |
Full-time law enforcement employees in 2020, including police officers: 428 (286 officers - 245 male; 41 female).
| Officers per 1,000 residents here: | 1.98 |
| Texas average: | 2.05 |
Full-time law enforcement employees in 2018, including police officers: 427 (285 officers - 245 male; 40 female).
| Officers per 1,000 residents here: | 1.97 |
| Texas average: | 2.18 |
Full-time law enforcement employees in 2017, including police officers: 413 (282 officers - 241 male; 41 female).
| Officers per 1,000 residents here: | 1.96 |
| Texas average: | 2.06 |
Full-time law enforcement employees in 2016, including police officers: 408 (262 officers - 227 male; 35 female).
| Officers per 1,000 residents here: | 1.84 |
| Texas average: | 2.11 |
Full-time law enforcement employees in 2015, including police officers: 403 (266 officers - 228 male; 38 female).
| Officers per 1,000 residents here: | 1.89 |
| Texas average: | 2.13 |
Full-time law enforcement employees in 2014, including police officers: 403 (266 officers - 232 male; 34 female).
| Officers per 1,000 residents here: | 1.93 |
| Texas average: | 2.01 |
Full-time law enforcement employees in 2013, including police officers: 404 (266 officers - 235 male; 31 female).
| Officers per 1,000 residents here: | 1.95 |
| Texas average: | 2.05 |
Full-time law enforcement employees in 2012, including police officers: 404 (265 officers - 234 male; 31 female).
| Officers per 1,000 residents here: | 1.95 |
| Texas average: | 1.95 |
Full-time law enforcement employees in 2011, including police officers: 403 (270 officers - 245 male; 25 female).
| Officers per 1,000 residents here: | 2.04 |
| Texas average: | 2.17 |
Full-time law enforcement employees in 2010, including police officers: 407 (270 officers - 245 male; 25 female).
| Officers per 1,000 residents here: | 2.08 |
| Texas average: | 2.20 |
Full-time law enforcement employees in 2009, including police officers: 398 (261 officers - 240 male; 21 female).
| Officers per 1,000 residents here: | 1.97 |
| Texas average: | 2.23 |
Full-time law enforcement employees in 2008, including police officers: 400 (262 officers - 241 male; 21 female).
| Officers per 1,000 residents here: | 2.01 |
| Texas average: | 2.17 |
Full-time law enforcement employees in 2007, including police officers: 396 (263 officers - 244 male; 19 female).
| Officers per 1,000 residents here: | 2.03 |
| Texas average: | 2.18 |
Full-time law enforcement employees in 2006, including police officers: 393 (261 officers - 244 male; 17 female).
| Officers per 1,000 residents here: | 2.05 |
| Texas average: | 2.13 |
Full-time law enforcement employees in 2005, including police officers: 398 (262 officers - 247 male; 15 female).
| Officers per 1,000 residents here: | 2.13 |
| Texas average: | 2.18 |
Full-time law enforcement employees in 2004, including police officers: 379 (252 officers - 237 male; 15 female).
| Officers per 1,000 residents here: | 2.13 |
| Texas average: | 2.19 |
Full-time law enforcement employees in 2003, including police officers: 369 (240 officers - 225 male; 15 female).
| Officers per 1,000 residents here: | 2.08 |
| Texas average: | 2.17 |


Zip codes: 78501.