Crime rate in Mission, Texas (TX): murders, rapes, robberies, assaults, burglaries, thefts, auto thefts, arson, law enforcement employees, police officers, crime map
Crime rate in Mission, TX
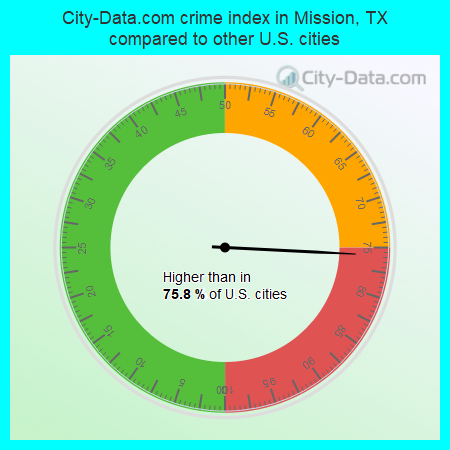
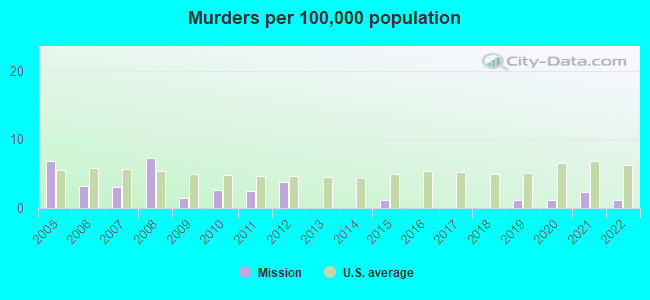
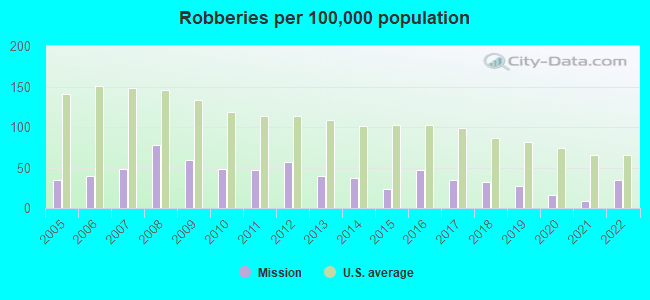
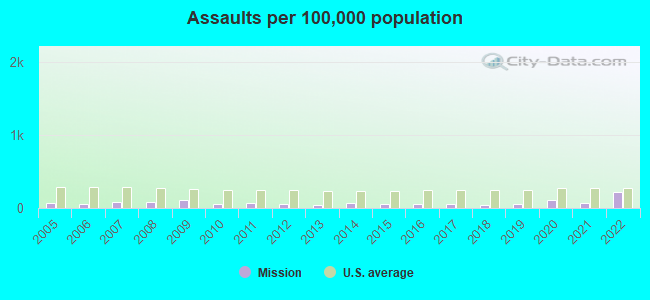
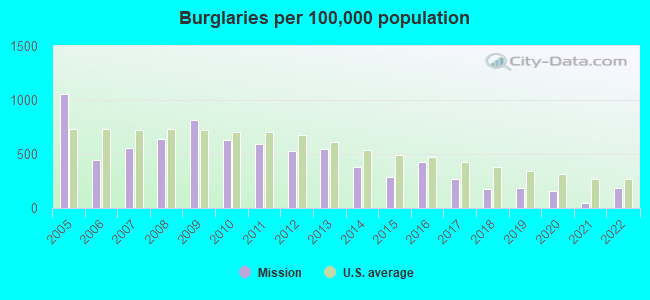
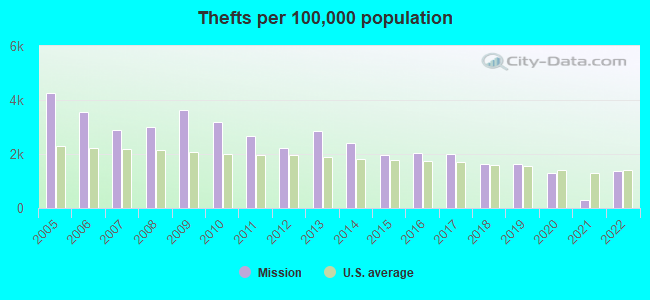
The 2022 crime rate in Mission, TX is 203 (City-Data.com crime index), which is 1.2 times smaller than the U.S. average. It was higher than in 75.8% U.S. cities. The 2022 Mission crime rate rose by 261% compared to 2021. The number of homicides stood at 1 - a decrease of 1 compared to 2021. In the last 5 years Mission has seen increasing violent crime and decline of property crime.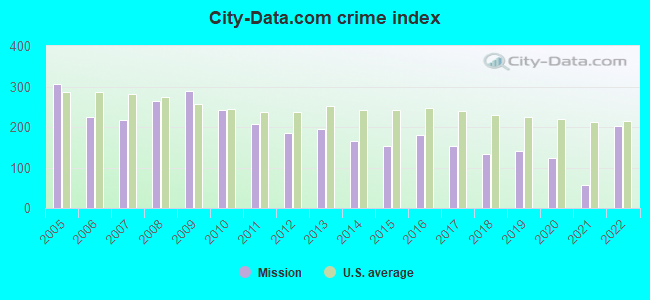
The City-Data.com crime index weighs serious crimes and violent crimes more heavily. Higher means more crime, U.S. average is 246.1. It adjusts for the number of visitors and daily workers commuting into cities.
- means the value is smaller than the state average.- means the value is about the same as the state average.
- means the value is bigger than the state average.
- means the value is much bigger than the state average.
According to our research of Texas and other state lists, there were 210 registered sex offenders living in Mission, Texas as of June 16, 2024.
The ratio of all residents to sex offenders in Mission is 402 to 1.
The ratio of registered sex offenders to all residents in this city is near the state average.
Violent crime rate in 2022
| Mission: | 214.3 |
| U.S. Average: | 219.8 |
Violent crime rate in 2021
| Mission: | 64.0 |
| U.S. Average: | 224.8 |
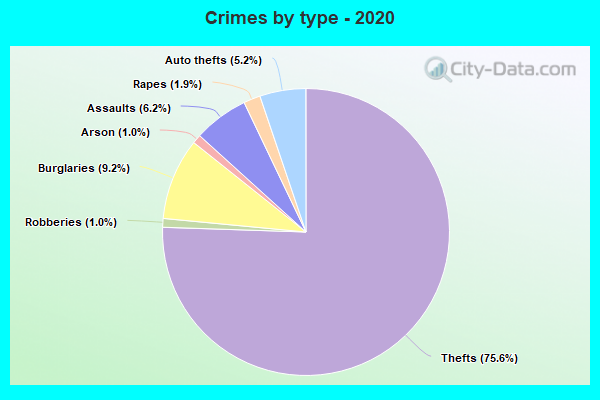
Violent crime rate in 2020
| Mission: | 95.2 |
| U.S. Average: | 228.2 |
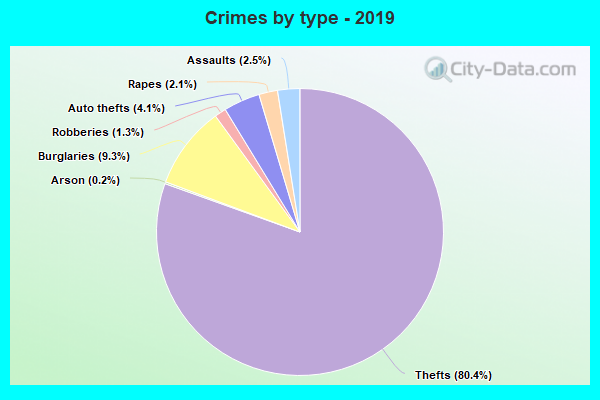
Violent crime rate in 2019
| Mission: | 84.6 |
| U.S. Average: | 219.9 |
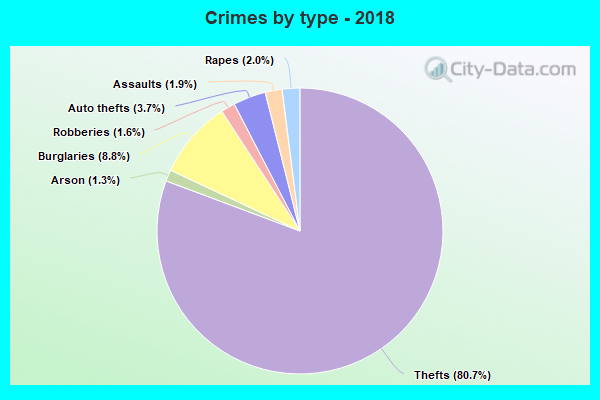
Violent crime rate in 2018
| Mission: | 75.6 |
| U.S. Average: | 221.2 |
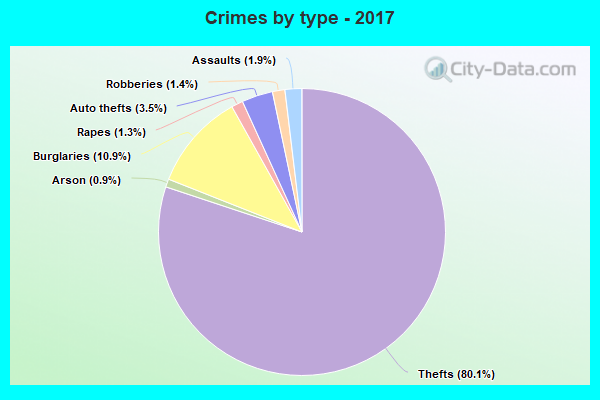
Violent crime rate in 2017
| Mission: | 74.0 |
| U.S. Average: | 226.2 |
Violent crime rate in 2016
| Mission: | 92.4 |
| U.S. Average: | 227.3 |
Violent crime rate in 2015
| Mission: | 65.2 |
| U.S. Average: | 219.3 |
Violent crime rate in 2014
| Mission: | 61.1 |
| U.S. Average: | 211.1 |
Violent crime rate in 2013
| Mission: | 46.7 |
| U.S. Average: | 214.2 |
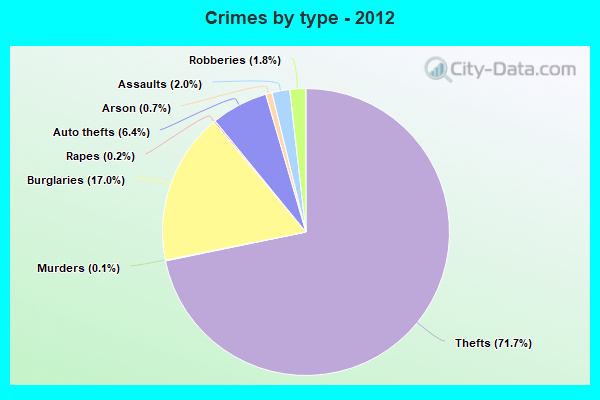
Violent crime rate in 2012
| Mission: | 73.9 |
| U.S. Average: | 187.4 |
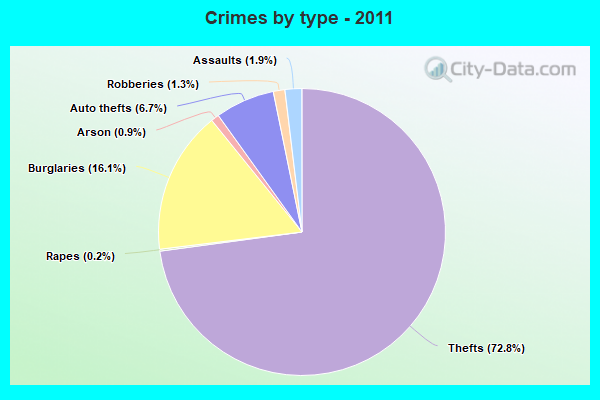
Violent crime rate in 2011
| Mission: | 71.2 |
| U.S. Average: | 187.1 |
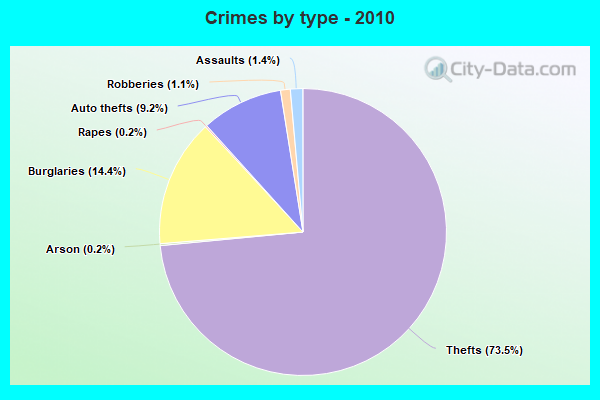
Violent crime rate in 2010
| Mission: | 68.1 |
| U.S. Average: | 195.7 |
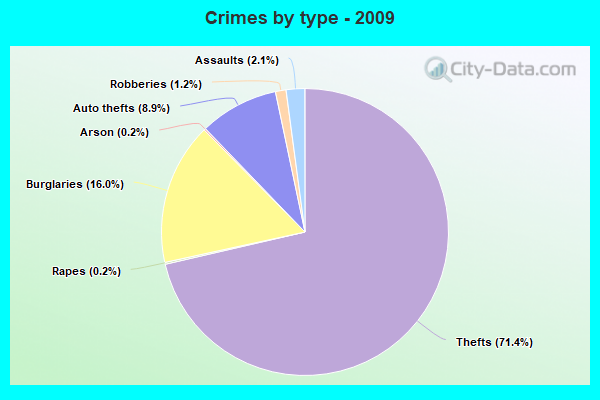
Violent crime rate in 2009
| Mission: | 95.7 |
| U.S. Average: | 208.9 |
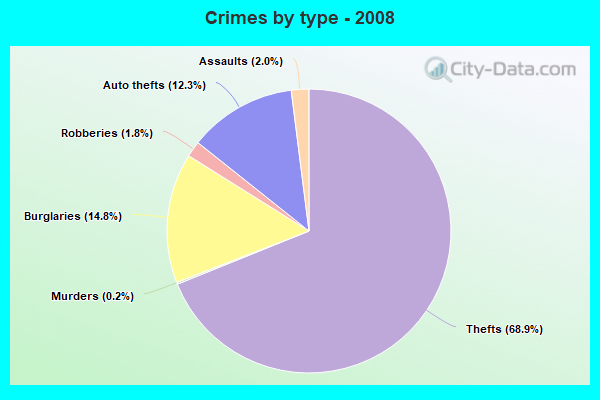
Violent crime rate in 2008
| Mission: | 98.9 |
| U.S. Average: | 222.5 |
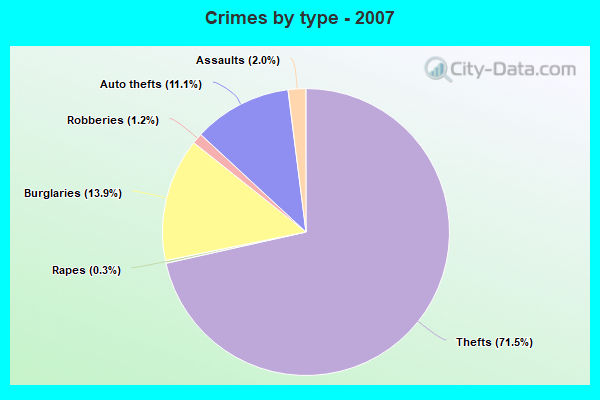
Violent crime rate in 2007
| Mission: | 75.4 |
| U.S. Average: | 229.1 |
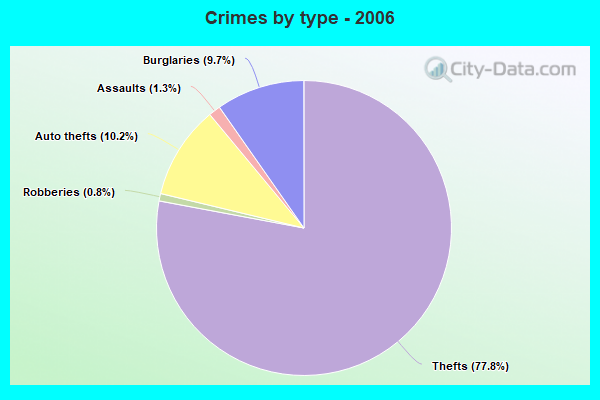
Violent crime rate in 2006
| Mission: | 53.8 |
| U.S. Average: | 232.6 |
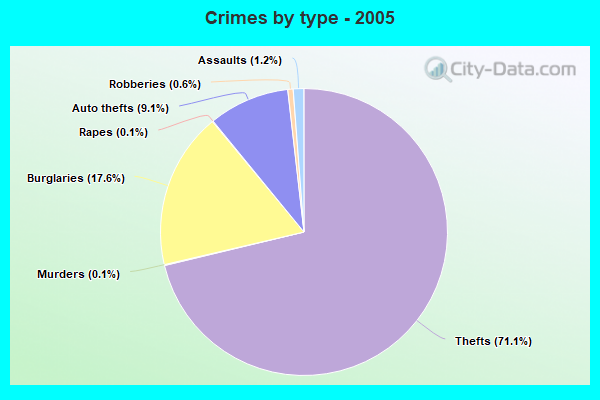
Violent crime rate in 2005
| Mission: | 70.0 |
| U.S. Average: | 227.0 |
Property crime rate in 2022
| Mission: | 125.0 |
| U.S. Average: | 166.5 |
Property crime rate in 2021
| Mission: | 29.4 |
| U.S. Average: | 157.8 |
Property crime rate in 2020
| Mission: | 108.9 |
| U.S. Average: | 169.6 |
Property crime rate in 2019
| Mission: | 130.7 |
| U.S. Average: | 179.7 |
Property crime rate in 2018
| Mission: | 127.2 |
| U.S. Average: | 190.2 |
Property crime rate in 2017
| Mission: | 168.4 |
| U.S. Average: | 206.4 |
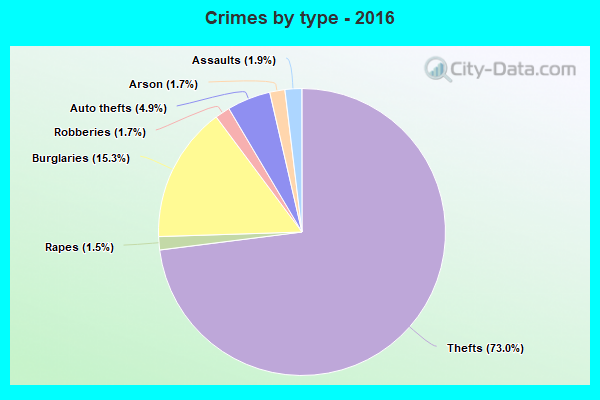
Property crime rate in 2016
| Mission: | 206.3 |
| U.S. Average: | 216.6 |
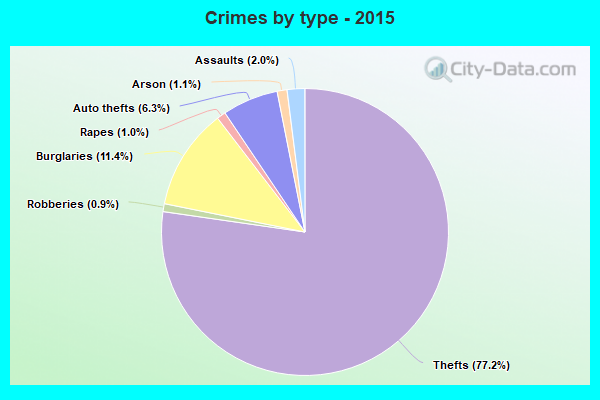
Property crime rate in 2015
| Mission: | 181.0 |
| U.S. Average: | 221.5 |
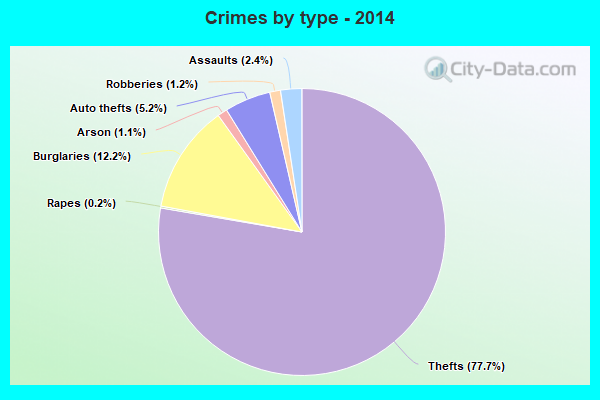
Property crime rate in 2014
| Mission: | 219.6 |
| U.S. Average: | 230.8 |
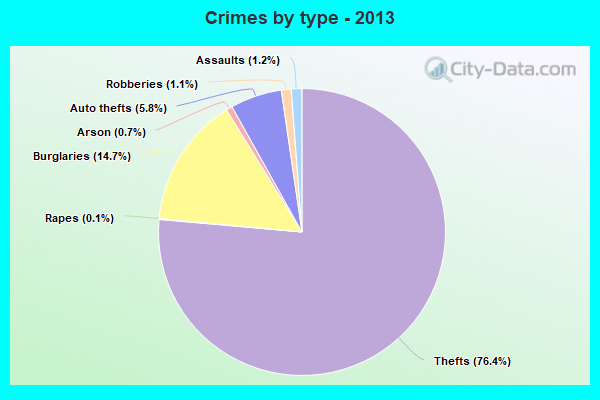
Property crime rate in 2013
| Mission: | 285.2 |
| U.S. Average: | 250.4 |
Property crime rate in 2012
| Mission: | 245.6 |
| U.S. Average: | 267.3 |
Property crime rate in 2011
| Mission: | 287.8 |
| U.S. Average: | 273.5 |
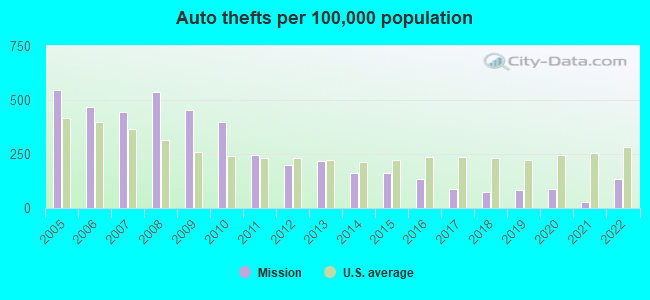
Property crime rate in 2010
| Mission: | 344.1 |
| U.S. Average: | 276.4 |
Property crime rate in 2009
| Mission: | 412.1 |
| U.S. Average: | 285.6 |
Property crime rate in 2008
| Mission: | 358.5 |
| U.S. Average: | 302.2 |
Property crime rate in 2007
| Mission: | 298.0 |
| U.S. Average: | 309.2 |
Property crime rate in 2006
| Mission: | 311.5 |
| U.S. Average: | 317.3 |
Property crime rate in 2005
| Mission: | 466.7 |
| U.S. Average: | 322.3 |
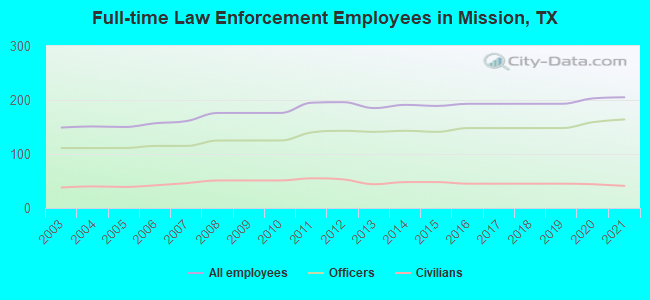
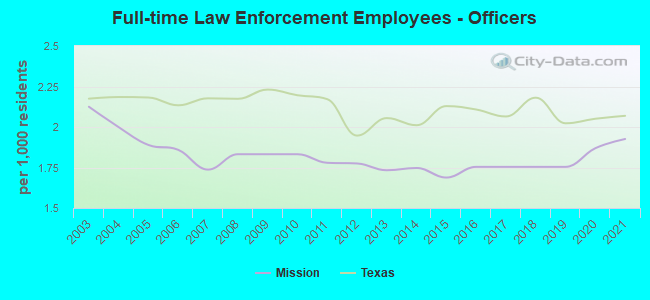
Full-time law enforcement employees in 2021, including police officers: 205 (164 officers - 145 male; 19 female).
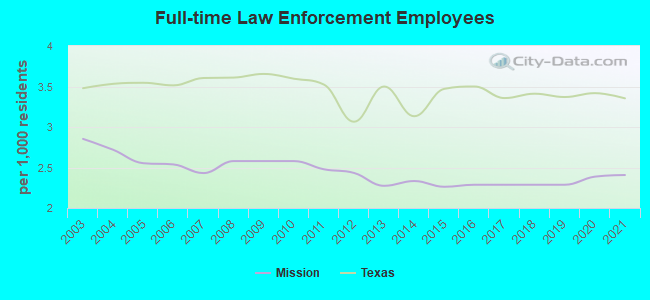
| Officers per 1,000 residents here: | 1.93 |
| Texas average: | 2.07 |
Full-time law enforcement employees in 2020, including police officers: 203 (159 officers - 142 male; 17 female).
| Officers per 1,000 residents here: | 1.87 |
| Texas average: | 2.05 |
Full-time law enforcement employees in 2016, including police officers: 193 (148 officers - 134 male; 14 female).
| Officers per 1,000 residents here: | 1.75 |
| Texas average: | 2.11 |
Full-time law enforcement employees in 2015, including police officers: 189 (141 officers - 129 male; 12 female).
| Officers per 1,000 residents here: | 1.69 |
| Texas average: | 2.13 |
Full-time law enforcement employees in 2014, including police officers: 191 (143 officers - 128 male; 15 female).
| Officers per 1,000 residents here: | 1.75 |
| Texas average: | 2.01 |
Full-time law enforcement employees in 2013, including police officers: 185 (141 officers - 126 male; 15 female).
| Officers per 1,000 residents here: | 1.73 |
| Texas average: | 2.05 |
Full-time law enforcement employees in 2012, including police officers: 196 (143 officers - 130 male; 13 female).
| Officers per 1,000 residents here: | 1.78 |
| Texas average: | 1.95 |
Full-time law enforcement employees in 2011, including police officers: 195 (140 officers - 128 male; 12 female).
| Officers per 1,000 residents here: | 1.78 |
| Texas average: | 2.17 |
Full-time law enforcement employees in 2008, including police officers: 176 (125 officers - 114 male; 11 female).
| Officers per 1,000 residents here: | 1.83 |
| Texas average: | 2.17 |
Full-time law enforcement employees in 2007, including police officers: 161 (115 officers - 106 male; 9 female).
| Officers per 1,000 residents here: | 1.74 |
| Texas average: | 2.18 |
Full-time law enforcement employees in 2006, including police officers: 157 (115 officers - 106 male; 9 female).
| Officers per 1,000 residents here: | 1.86 |
| Texas average: | 2.13 |
Full-time law enforcement employees in 2005, including police officers: 150 (111 officers - 106 male; 5 female).
| Officers per 1,000 residents here: | 1.89 |
| Texas average: | 2.18 |
Full-time law enforcement employees in 2004, including police officers: 151 (111 officers - 106 male; 5 female).
| Officers per 1,000 residents here: | 2.00 |
| Texas average: | 2.19 |
Full-time law enforcement employees in 2003, including police officers: 149 (111 officers - 106 male; 5 female).
| Officers per 1,000 residents here: | 2.13 |
| Texas average: | 2.17 |
Zip codes: 78572.