Aberdeen: Fire Incidents, Washington (WA)
Where are fire incidents reported in Aberdeen, WA
Something went wrong! Please refresh the page.
| Fire incidents reported | |
|---|---|
| Sreet name | Count |
| WISHKAH ST | 198 |
| 2ND ST | 168 |
| 1ST ST | 158 |
| OLYMPIC HWY | 158 |
| HERON ST | 146 |
| MARKET ST | 112 |
| BOONE ST | 104 |
| F ST | 102 |
| SUMNER AVE | 90 |
| CENTRAL PARK DR | 86 |
| SIMPSON AVE | 86 |
| WISHKAH RD | 86 |
| MARION ST | 82 |
| HAGARA ST | 62 |
| KING ST | 62 |
| RIVER ST | 60 |
| CUSHING ST | 58 |
| FRONT ST | 54 |
| CURTIS ST | 50 |
| 3RD ST | 48 |
| BAY AVE | 48 |
| B ST | 46 |
| PACIFIC AVE | 46 |
| CHERRY ST | 42 |
| WEST BLVD | 42 |
| ARTHUR ST | 40 |
| PERRY ST | 40 |
| COOLIDGE RD | 38 |
| HARDING RD | 38 |
| ABERDEEN AVE | 34 |
2002 - 2018 National Fire Incident Reporting System (NFIRS) incidents
- Incident types reported to NFIRS in Aberdeen, WA
- 5,77147.0%Rescue & EMS
- 2,33319.0%Fire
- 1,78514.5%Good Intent Call
- 1,0058.2%Service Call
- 8366.8%Hazardous Condition
- 4964.0%False Alarm
- 310.3%Special Incident
- Fire incident types reported to NFIRS in Aberdeen, WA
- 1,07546.1%Structure Fires
- 79534.1%Outside Fires
- 28112.0%Mobile Property/Vehicle Fires
- 1827.8%Other
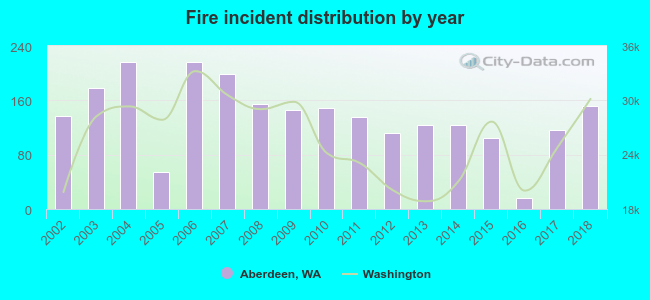 Based on the data from the years 2002 - 2018 the average number of fires per year is 137. The highest number of reported fires - 217 took place in 2004, and the least - 16 in 2016. The data has an increasing trend.
The average number of yearly fire incidents per 10k residents in Aberdeen, WA compared to nearest cities:
(Note: Based on data for the last 3 years, including only cities with population 5,000 and above)
| Aberdeen: | 58.2 |
| Hoquiam: | 97.7 |
| Ocean Shores: | 14.2 |
| Olympic: | 1.6 |
| Shelton: | 368.9 |
| Tumwater: | 58.6 |
| Olympia: | 118.4 |
| Centralia: | 104.3 |
| Chehalis: | 282.8 |
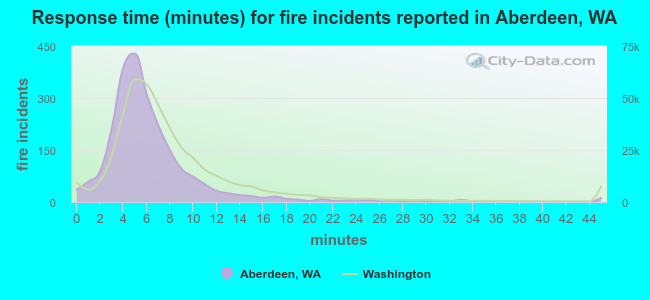 The median response time based on all reported fire incidents is 5 minutes. This is lower than the Washington median value.
The median response time in Aberdeen, WA compared to nearest cities:
(Note: Based on data for all years, including only cities with at least 500 fire incidents)
| Aberdeen: | 5 minutes |
| Hoquiam: | 5 minutes |
| Montesano: | 9 minutes |
| Westport: | 9 minutes |
| Ocean Shores: | 6 minutes |
| Elma: | 10 minutes |
| Raymond: | 4 minutes |
| Ocean Park: | 6 minutes |
| Rochester: | 9 minutes |
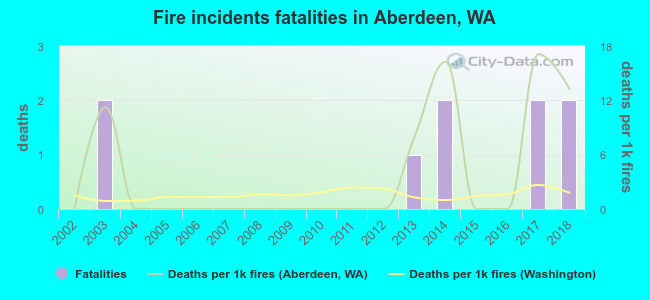 Based on the data from the years 2002 - 2018 the average number of fire-related fatalities per year is 1. The highest number of reported deaths - 2 took place in 2003, and the lowest - 0 in 2002. The data has an increasing trend.
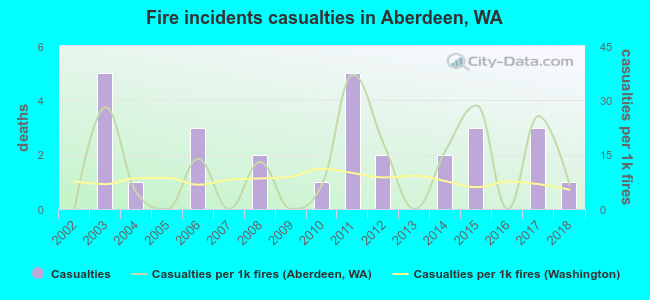 According to the reports from the years 2002 - 2018 the average number of fire-related casualties per year is 2. The highest number of casualties - 5 took place in 2003, and the lowest - 0 in 2002. The data has a growing trend.
The average number of injuries per 1,000 fire incidents is 12. This indicator was the highest - 37 in 2011, and the lowest 0 in 2002. The trend for injuries per 1,000 fire incidents is increasing. Compared to the state value the number of injuries per 1,000 incidents is higher.
According to the reports from the years 2002 - 2018 the average number of fire-related casualties per year is 2. The highest number of casualties - 5 took place in 2003, and the lowest - 0 in 2002. The data has a growing trend.
The average number of injuries per 1,000 fire incidents is 12. This indicator was the highest - 37 in 2011, and the lowest 0 in 2002. The trend for injuries per 1,000 fire incidents is increasing. Compared to the state value the number of injuries per 1,000 incidents is higher.Casualties per 1,000 incidents in Aberdeen, WA compared to nearest cities:
(Note: Based on data for all years, including only cities with at least 500 fire incidents)
| Aberdeen: | 12.0 |
| Hoquiam: | 4.9 |
| Montesano: | 10.5 |
| Westport: | 0.0 |
| Ocean Shores: | 1.5 |
| Elma: | 0.0 |
| Raymond: | 14.7 |
| Ocean Park: | 15.9 |
| Rochester: | 1.7 |
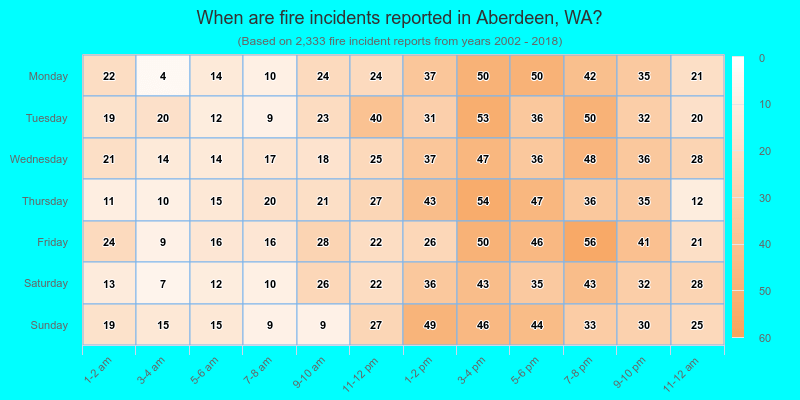
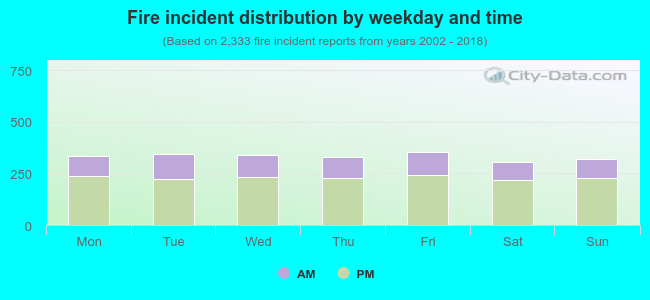 31.4% incidents where reported in the morning and 68.6% in the evening. The most fires (15.2%) took place on Friday, and the least (13.2%) on Saturday.
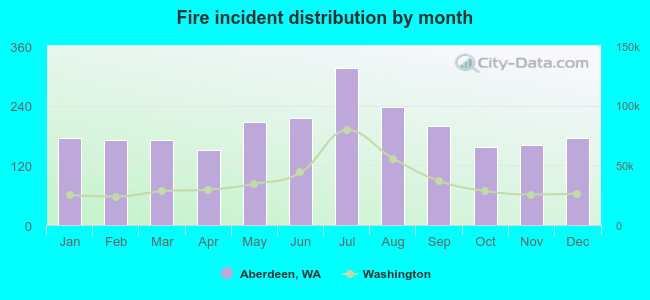 According to the 2,333 fires from years 2002 - 2018 most fires (13.5%) took place during July, and the least (6.4%) in April.
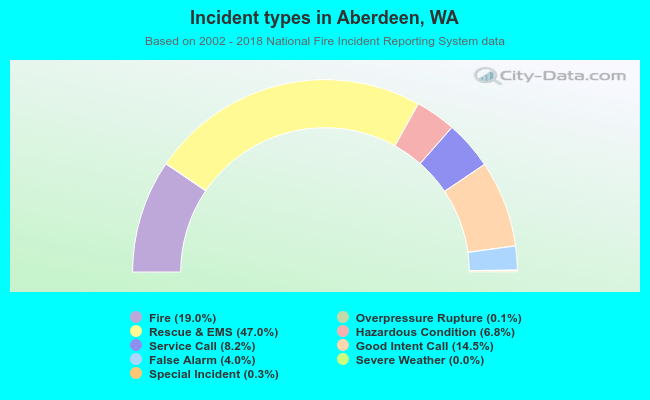 Out of all 12,269 cases reported during the years 2002 - 2018, the most belonged to the categories: Rescue & EMS (47.0%), Fire (19.0%), and Good Intent Call (14.5%).
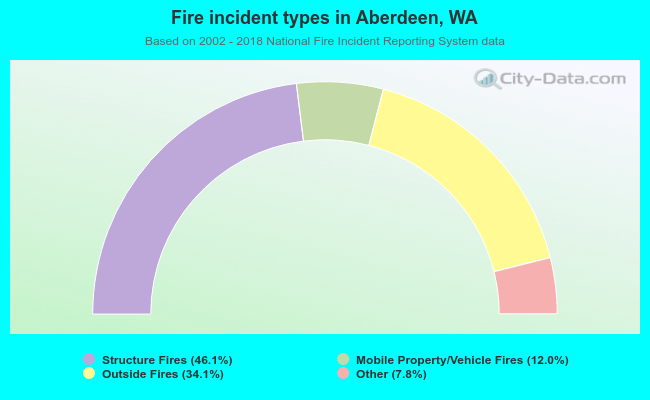 When looking into fire subcategories, the most incidents belonged to: Structure Fires (46.1%), and Outside Fires (34.1%).