Westport: Fire Incidents, Washington (WA)
Where are fire incidents reported in Westport, WA
Something went wrong! Please refresh the page.
|
| |||||||||||||||||||||||||||||||||||||||||||||||||||||||||||||||||||||||||||||||||||||||||||||||||||||||||||||
2002 - 2018 National Fire Incident Reporting System (NFIRS) incidents
- Incident types reported to NFIRS in Westport, WA
- 2,71768.8%Rescue & EMS
- 63216.0%Fire
- 2135.4%Service Call
- 2005.1%Good Intent Call
- 1022.6%Hazardous Condition
- 761.9%False Alarm
- 80.2%Special Incident
- Fire incident types reported to NFIRS in Westport, WA
- 21333.7%Structure Fires
- 18629.4%Other
- 17728.0%Outside Fires
- 568.9%Mobile Property/Vehicle Fires
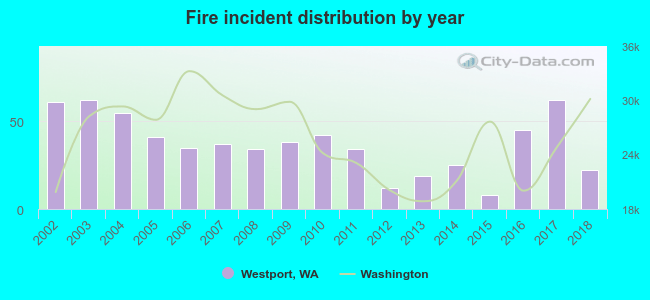 According to the data from the years 2002 - 2018 the average number of fires per year is 37. The highest number of fires - 62 took place in 2003, and the least - 8 in 2015. The data has a declining trend.
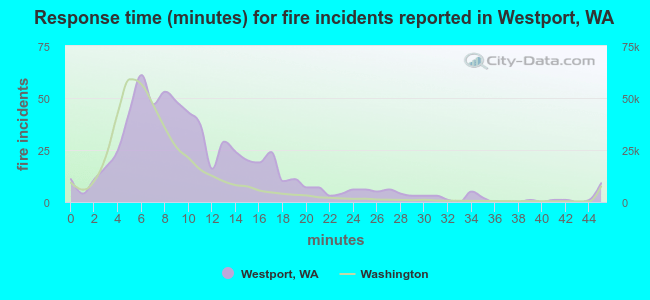 The median response time based on all reported fire incidents is 9 minutes. This is higher compared to the Washington median value.
The median response time in Westport, WA compared to nearest cities:
(Note: Based on data for all years, including only cities with at least 500 fire incidents)
| Westport: | 9 minutes |
| Ocean Shores: | 6 minutes |
| Hoquiam: | 5 minutes |
| Aberdeen: | 5 minutes |
| Raymond: | 4 minutes |
| Montesano: | 9 minutes |
| Ocean Park: | 6 minutes |
| Elma: | 10 minutes |
| Rochester: | 9 minutes |
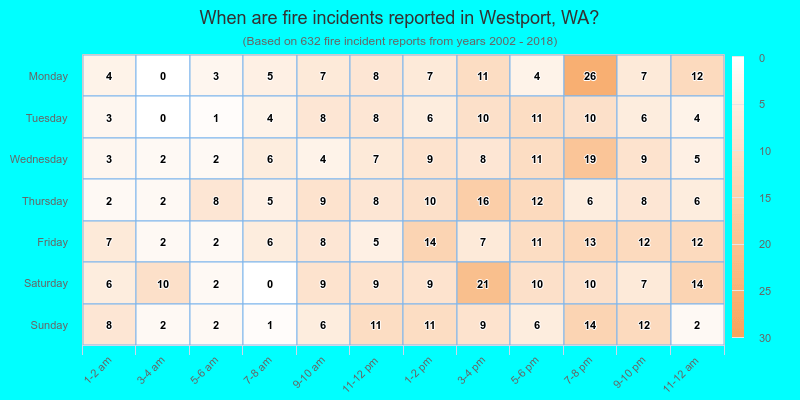
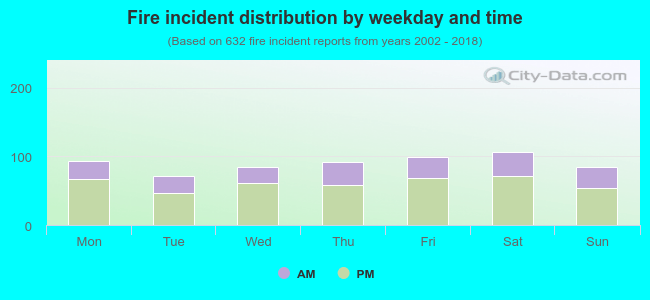 32.4% incidents where reported in the morning and 67.6% in the evening. The most fires (16.9%) took place on Saturday, and the least (11.2%) on Tuesday.
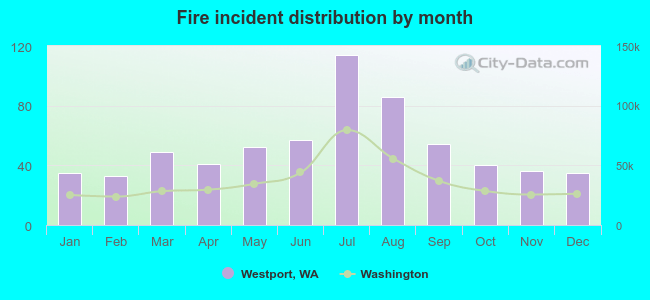 According to the 632 fire incidents from years 2002 - 2018 most fires (18.0%) took place during July, and the least (5.2%) in February.
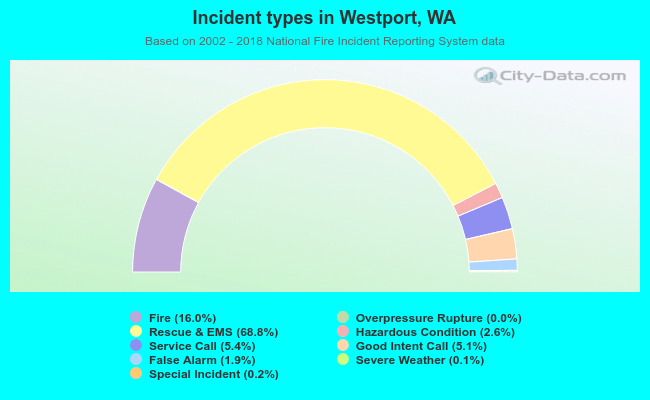 Out of all 3,951 cases reported during the years 2002 - 2018, the most belonged to the categories: Rescue & EMS (68.8%), Fire (16.0%), and Service Call (5.4%).
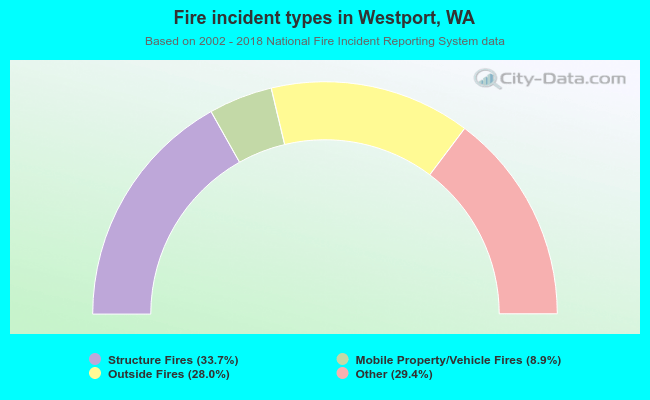 When looking into fire subcategories, the most incidents belonged to: Structure Fires (33.7%), and Other (29.4%).