Aurora: Fire Incidents, Colorado (CO)
Where are fire incidents reported in Aurora, CO
Something went wrong! Please refresh the page.
| Fire incidents reported | |
|---|---|
| Sreet name | Count |
| COLFAX AVE | 702 |
| CHAMBERS RD | 330 |
| PARKER RD | 302 |
| PEORIA ST | 270 |
| MISSISSIPPI AVE | 256 |
| JEWELL AVE | 216 |
| HAVANA ST | 198 |
| SABLE BLVD | 192 |
| ILIFF AVE | 180 |
| 6TH AVE | 178 |
| ALAMEDA AVE | 178 |
| DALLAS ST | 176 |
| 16TH AVE | 162 |
| MONTVIEW BLVD | 150 |
| 13TH AVE | 146 |
| DAYTON ST | 136 |
| OAKLAND ST | 136 |
| POTOMAC ST | 132 |
| HAMPDEN AVE | 120 |
| QUINCY AVE | 114 |
| I225 SB HWY | 112 |
| 13TH PL | 110 |
| MOLINE ST | 108 |
| IRONTON ST | 106 |
| BUCKLEY RD | 104 |
| 14TH AVE | 102 |
| SMITH RD | 102 |
| EXPOSITION AVE | 100 |
| NOME ST | 98 |
| CHESTER ST | 96 |
| Other | 4,236 |
2002 - 2018 National Fire Incident Reporting System (NFIRS) incidents
- Incident types reported to NFIRS in Aurora, CO
- 146,61063.7%Rescue & EMS
- 28,09612.2%Good Intent Call
- 17,0257.4%Hazardous Condition
- 15,4146.7%Service Call
- 13,2015.7%False Alarm
- 9,5484.1%Fire
- Fire incident types reported to NFIRS in Aurora, CO
- 3,76839.5%Structure Fires
- 3,76339.4%Outside Fires
- 1,30913.7%Mobile Property/Vehicle Fires
- 7087.4%Other
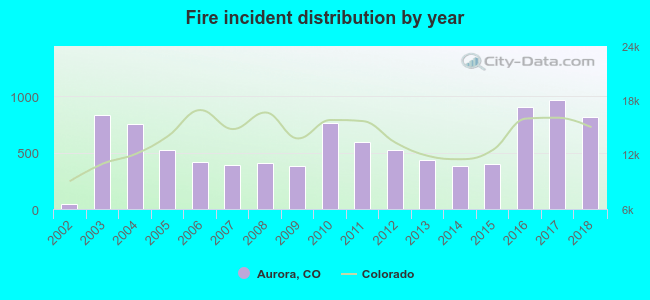 Based on the data from the years 2002 - 2018 the average number of fires per year is 562. The highest number of reported fires - 965 took place in 2017, and the least - 48 in 2002. The data has a rising trend.
The average number of yearly fire incidents per 10k residents in Aurora, CO compared to nearest cities:
(Note: Based on data for the last 3 years, including only cities with population 5,000 and above)
| Aurora: | 25.3 |
| Glendale: | 18.9 |
| Greenwood Village: | 12.1 |
| Cherry Hills Village: | 13.5 |
| Denver: | 25.0 |
| Centennial: | 6.9 |
| Englewood: | 46.5 |
| Lone Tree: | 25.3 |
| Commerce City: | 24.8 |
 The median response time based on all reported fire incidents is 6 minutes. This is close to the Colorado median value.
The median response time in Aurora, CO compared to nearest cities:
(Note: Based on data for all years, including only cities with at least 500 fire incidents)
| Aurora: | 6 minutes |
| Denver: | 4 minutes |
| Centennial: | 6 minutes |
| Englewood: | 6 minutes |
| Lone Tree: | 6 minutes |
| Commerce City: | 5 minutes |
| Sheridan: | 4 minutes |
| Parker: | 7 minutes |
| Littleton: | 7 minutes |
 According to the data from the years 2002 - 2018 the average number of fire-related yearly deaths is 0. The highest number of deaths - 3 took place in 2016, and the lowest - 0 in 2002. The data has a growing trend.
The average number of deaths per 1,000 fires is 1. This indicator was the highest - 3 in 2016, and the lowest 0 in 2002. The trend for deaths per 1,000 fires is growing. Compared to the state value the number of fatalities per 1,000 incidents is much lower.
According to the data from the years 2002 - 2018 the average number of fire-related yearly deaths is 0. The highest number of deaths - 3 took place in 2016, and the lowest - 0 in 2002. The data has a growing trend.
The average number of deaths per 1,000 fires is 1. This indicator was the highest - 3 in 2016, and the lowest 0 in 2002. The trend for deaths per 1,000 fires is growing. Compared to the state value the number of fatalities per 1,000 incidents is much lower.
 Based on the data from the years 2002 - 2018 the average number of fire-related yearly casualties is 6. The highest number of casualties - 19 took place in 2016, and the lowest - 0 in 2008. The data has a growing trend.
The average number of casualties per 1,000 fire incidents is 10. This indicator was the highest - 27 in 2012, and the lowest 0 in 2008. The trend for injuries per 1,000 fires is declining. Compared to the state value the number of casualties per 1,000 fires is about the same.
Based on the data from the years 2002 - 2018 the average number of fire-related yearly casualties is 6. The highest number of casualties - 19 took place in 2016, and the lowest - 0 in 2008. The data has a growing trend.
The average number of casualties per 1,000 fire incidents is 10. This indicator was the highest - 27 in 2012, and the lowest 0 in 2008. The trend for injuries per 1,000 fires is declining. Compared to the state value the number of casualties per 1,000 fires is about the same.Casualties per 1,000 incidents in Aurora, CO compared to nearest cities:
(Note: Based on data for all years, including only cities with at least 500 fire incidents)
| Aurora: | 10.6 |
| Denver: | 20.6 |
| Centennial: | 32.4 |
| Englewood: | 10.1 |
| Lone Tree: | 6.9 |
| Commerce City: | 12.1 |
| Sheridan: | 17.1 |
| Parker: | 8.6 |
| Littleton: | 19.8 |
 28.7% incidents where reported in the morning and 71.3% in the evening. The most fires (15.7%) took place on Sunday, and the least (12.7%) on Thursday.
 According to the 9,548 incident reports from years 2002 - 2018 most fires (11.5%) took place during July, and the least (6.0%) in December.
 Out of all 230,187 cases reported during the years 2002 - 2018, the most belonged to the categories: Rescue & EMS (63.7%), Good Intent Call (12.2%), and Hazardous Condition (7.4%).
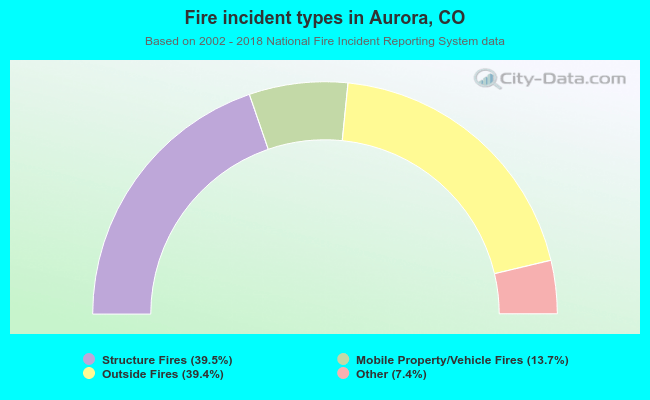 When looking into fire subcategories, the most incidents belonged to: Structure Fires (39.5%), and Outside Fires (39.4%).