Golden: Fire Incidents, Colorado (CO)
Where are fire incidents reported in Golden, CO
Something went wrong! Please refresh the page.
| Fire incidents reported | |
|---|---|
| Sreet name | Count |
| INTERSTATE 70 HWY | 198 |
| COLFAX AVE | 134 |
| I-70 | 108 |
| I70 | 96 |
| 32ND AVE | 86 |
| HWY 6 | 82 |
| WASHINGTON AVE | 74 |
| EB I70 | 70 |
| I70 HWY | 68 |
| HIGHWAY 72 | 66 |
| HIGHWAY 93 | 66 |
| I70 EASTBOUND HWY | 66 |
| MCINTYRE ST | 60 |
| 10TH AVE | 56 |
| C470 HWY | 56 |
| HWY 93 | 52 |
| FORD ST | 50 |
| I70 WESTBOUND HWY | 48 |
| 44TH AVE | 46 |
| INDIANA ST | 44 |
| YOUNGFIELD ST | 44 |
| 6TH AVE | 40 |
| GOLDEN RD | 40 |
| HOLMAN WAY | 40 |
| ARAPAHOE ST | 36 |
| QUAKER ST | 36 |
| 10TH ST | 34 |
| ROONEY RD | 34 |
| HIGHWAY 58 | 32 |
| SOUTH GOLDEN RD | 32 |
| Other | 1,254 |
2002 - 2018 National Fire Incident Reporting System (NFIRS) incidents
- Incident types reported to NFIRS in Golden, CO
- 14,42347.5%Rescue & EMS
- 3,68512.1%Hazardous Condition
- 3,49711.5%Good Intent Call
- 3,24210.7%False Alarm
- 3,14810.4%Fire
- 2,0536.8%Service Call
- 2130.7%Overpressure Rupture
- 550.2%Special Incident
- 420.1%Severe Weather
- Fire incident types reported to NFIRS in Golden, CO
- 1,23139.1%Outside Fires
- 91629.1%Structure Fires
- 86327.4%Mobile Property/Vehicle Fires
- 1384.4%Other
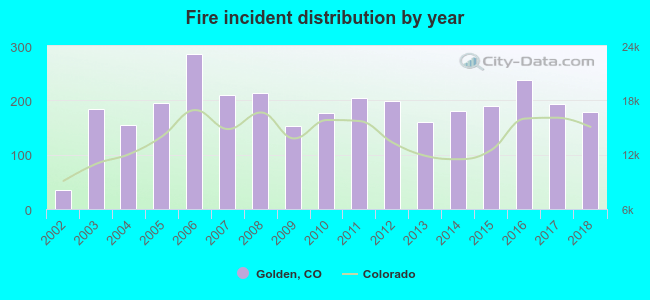 According to the data from the years 2002 - 2018 the average number of fires per year is 185. The highest number of fires - 285 took place in 2006, and the least - 35 in 2002. The data has a rising trend.
The average number of yearly fire incidents per 10k residents in Golden, CO compared to nearest cities:
(Note: Based on data for the last 3 years, including only cities with population 5,000 and above)
| Golden: | 100.7 |
| Wheat Ridge: | 29.3 |
| Lakewood: | 24.8 |
| Arvada: | 14.3 |
| Evergreen: | 52.7 |
| Westminster: | 19.6 |
| Sheridan: | 45.9 |
| Denver: | 25.0 |
| Superior: | 9.3 |
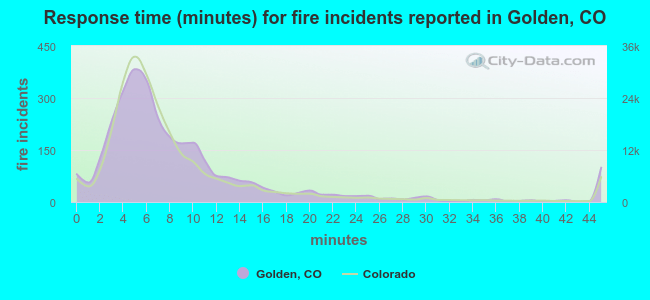 The median response time based on all reported fire incidents is 7 minutes. This is close to the Colorado median value.
The median response time in Golden, CO compared to nearest cities:
(Note: Based on data for all years, including only cities with at least 500 fire incidents)
| Golden: | 7 minutes |
| Wheat Ridge: | 5 minutes |
| Lakewood: | 5 minutes |
| Arvada: | 5 minutes |
| Evergreen: | 12 minutes |
| Westminster: | 5 minutes |
| Sheridan: | 4 minutes |
| Denver: | 4 minutes |
| Federal Heights: | 5 minutes |
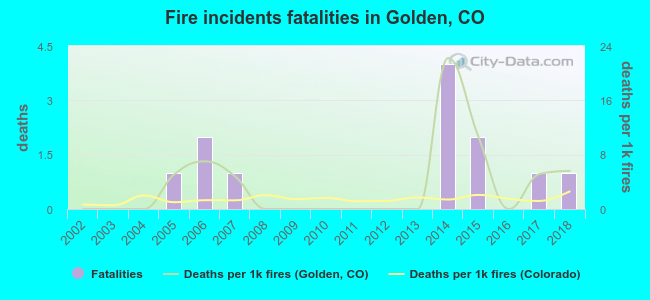 According to the data from the years 2002 - 2018 the average number of fire-related yearly deaths is 1. The highest number of reported deaths - 4 took place in 2014, and the lowest - 0 in 2002. The data has a rising trend.
The average number of deaths per 1,000 fire incidents is 4. This indicator was the highest - 22 in 2014, and the lowest 0 in 2002. The trend for fatalities per 1,000 fire incidents is increasing. Compared to the Colorado value the number of deaths per 1,000 fires is much higher.
According to the data from the years 2002 - 2018 the average number of fire-related yearly deaths is 1. The highest number of reported deaths - 4 took place in 2014, and the lowest - 0 in 2002. The data has a rising trend.
The average number of deaths per 1,000 fire incidents is 4. This indicator was the highest - 22 in 2014, and the lowest 0 in 2002. The trend for fatalities per 1,000 fire incidents is increasing. Compared to the Colorado value the number of deaths per 1,000 fires is much higher.
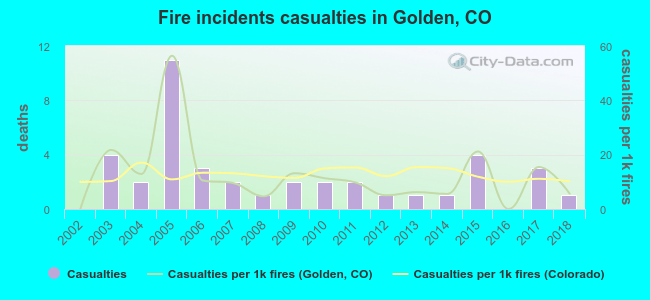 Based on the reports from the years 2002 - 2018 the average number of fire-related yearly casualties is 2. The highest number of injuries - 11 took place in 2005, and the lowest - 0 in 2002. The data has an increasing trend.
The average number of injuries per 1,000 fire incidents is 12. This indicator was the highest - 56 in 2005, and the lowest 0 in 2002. The trend for injuries per 1,000 incidents is increasing. Compared to the Colorado value the number of casualties per 1,000 fire incidents is about the same.
Based on the reports from the years 2002 - 2018 the average number of fire-related yearly casualties is 2. The highest number of injuries - 11 took place in 2005, and the lowest - 0 in 2002. The data has an increasing trend.
The average number of injuries per 1,000 fire incidents is 12. This indicator was the highest - 56 in 2005, and the lowest 0 in 2002. The trend for injuries per 1,000 incidents is increasing. Compared to the Colorado value the number of casualties per 1,000 fire incidents is about the same.Casualties per 1,000 incidents in Golden, CO compared to nearest cities:
(Note: Based on data for all years, including only cities with at least 500 fire incidents)
| Golden: | 12.7 |
| Wheat Ridge: | 9.2 |
| Lakewood: | 36.1 |
| Arvada: | 13.9 |
| Evergreen: | 0.0 |
| Westminster: | 34.0 |
| Sheridan: | 17.1 |
| Denver: | 20.6 |
| Federal Heights: | 21.2 |
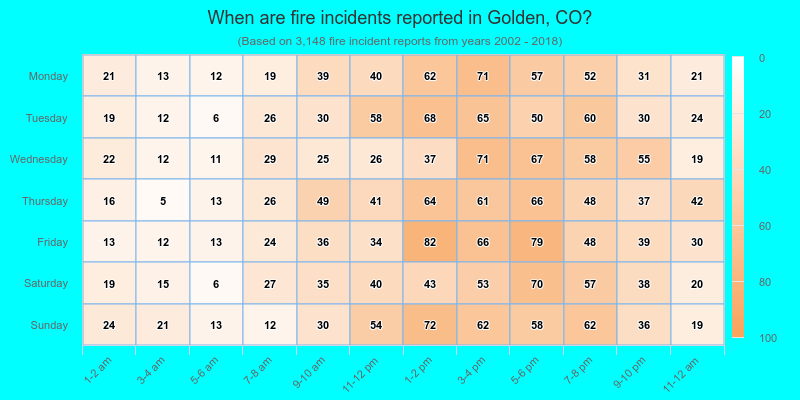
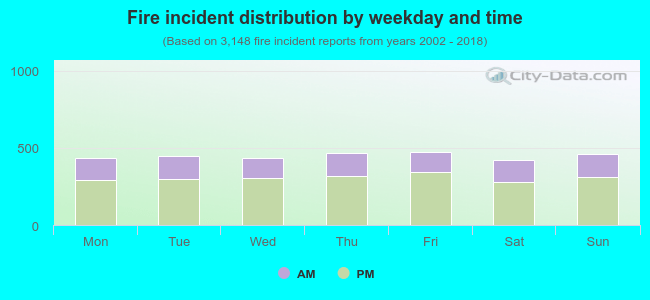 31.7% incidents where reported in the morning and 68.3% in the evening. The most fires (15.1%) took place on Friday, and the least (13.4%) on Saturday.
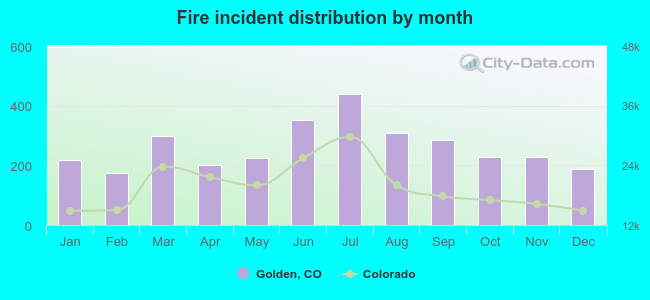 According to the 3,148 fire incident reports from years 2002 - 2018 most fires (13.9%) took place during July, and the least (5.5%) in February.
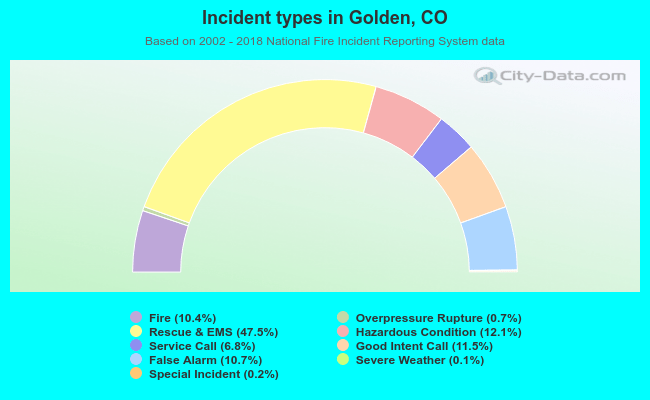 Out of all 30,358 cases reported during the years 2002 - 2018, the most belonged to the categories: Rescue & EMS (47.5%), Hazardous Condition (12.1%), and Good Intent Call (11.5%).
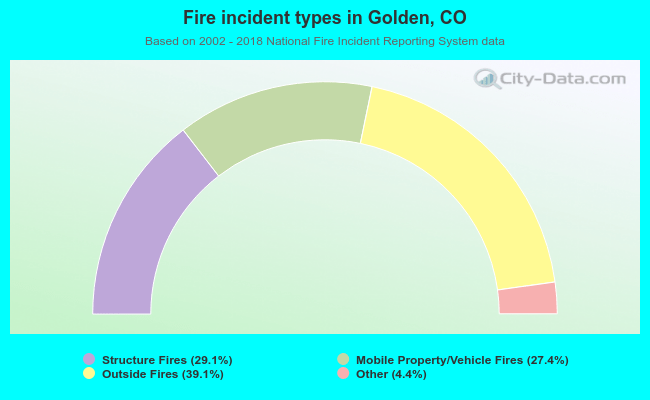 When looking into fire subcategories, the most reports belonged to: Outside Fires (39.1%), and Structure Fires (29.1%).