Bell: Fire Incidents, California (CA)
Where are fire incidents reported in Bell, CA
Something went wrong! Please refresh the page.
|
| |||||||||||||||||||||||||||||||||||||||||||||||||||||||||||||||||||||||||||||||||||||||||||||||||||||||||||||
2005 - 2018 National Fire Incident Reporting System (NFIRS) incidents
- Incident types reported to NFIRS in Bell, CA
- 7,50967.5%Rescue & EMS
- 1,62714.6%Good Intent Call
- 7426.7%False Alarm
- 7236.5%Fire
- 3272.9%Hazardous Condition
- 1711.5%Service Call
- 170.2%Special Incident
- Fire incident types reported to NFIRS in Bell, CA
- 33646.5%Outside Fires
- 17924.8%Structure Fires
- 15321.2%Mobile Property/Vehicle Fires
- 557.6%Other
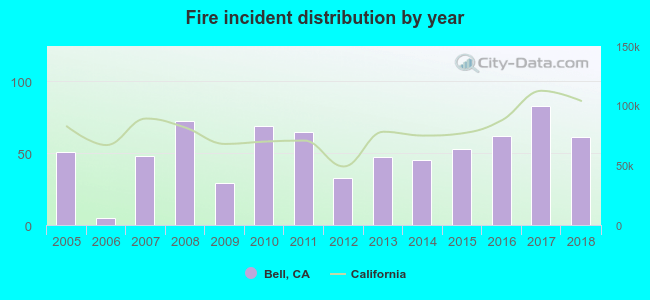 According to the data from the years 2005 - 2018 the average number of fire incidents per year is 52. The highest number of fire incidents - 83 took place in 2017, and the least - 5 in 2006. The data has a rising trend.
The average number of yearly fire incidents per 10k residents in Bell, CA compared to nearest cities:
(Note: Based on data for the last 3 years, including only cities with population 5,000 and above)
| Bell: | 19.0 |
| Maywood: | 12.2 |
| Cudahy: | 13.6 |
| Bell Gardens: | 18.3 |
| Huntington Park: | 19.9 |
| Commerce: | 70.9 |
| Walnut Park: | 11.5 |
| South Gate: | 15.8 |
| East Los Angeles: | 17.0 |
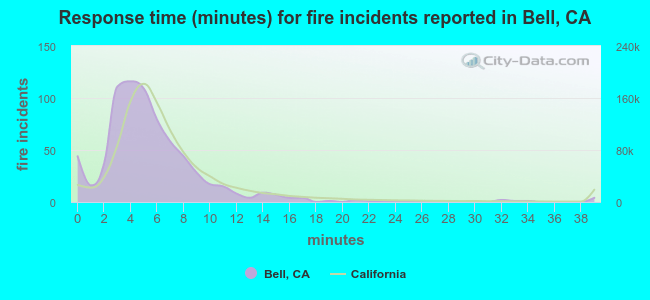 The median response time based on all reported fire incidents is 5 minutes. This is lower compared to the California median value.
The median response time in Bell, CA compared to nearest cities:
(Note: Based on data for all years, including only cities with at least 500 fire incidents)
| Bell: | 5 minutes |
| Bell Gardens: | 5 minutes |
| Huntington Park: | 4 minutes |
| Commerce: | 5 minutes |
| Vernon: | 5 minutes |
| South Gate: | 5 minutes |
| East Los Angeles: | 5 minutes |
| Lynwood: | 4 minutes |
| Downey: | 7 minutes |
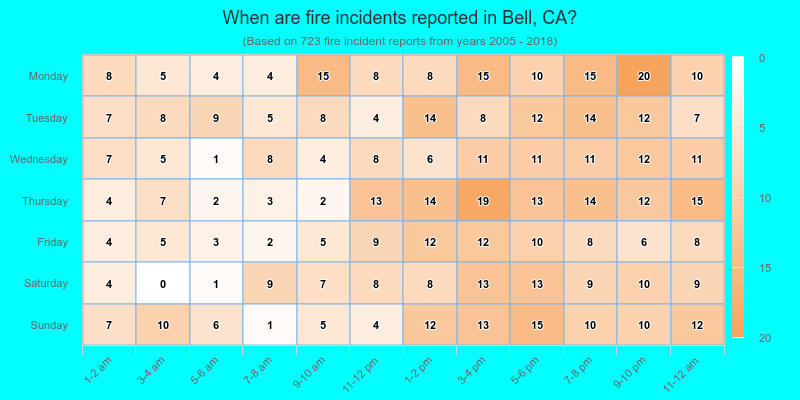
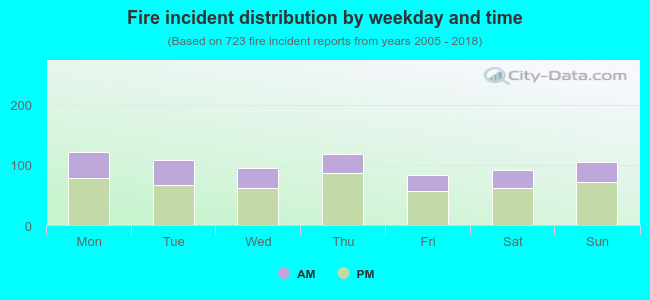 33.1% incidents where reported in the morning and 66.9% in the evening. The most fires (16.9%) took place on Monday, and the least (11.6%) on Friday.
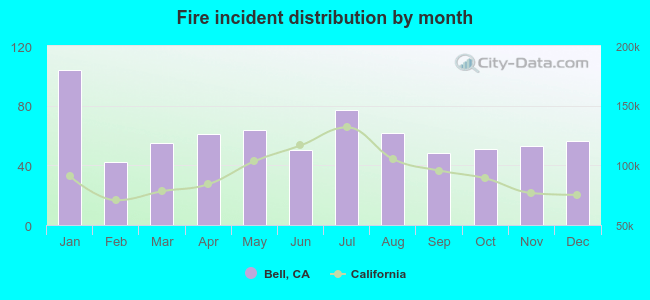 According to the 723 incident reports from years 2005 - 2018 most fires (14.4%) took place during January, and the least (5.8%) in February.
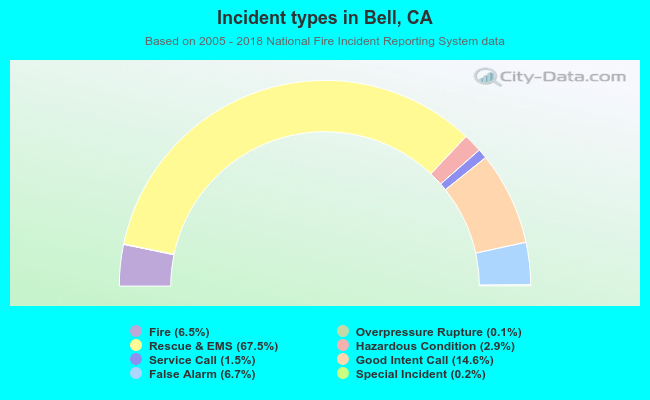 Out of all 11,124 cases reported during the years 2005 - 2018, the most belonged to the categories: Rescue & EMS (67.5%), Good Intent Call (14.6%), and False Alarm (6.7%).
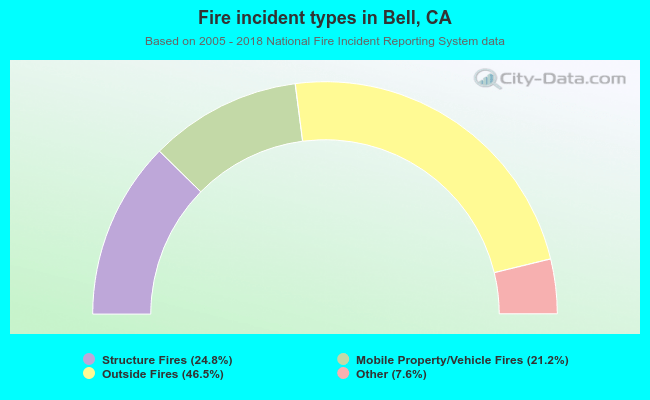 When looking into fire subcategories, the most incidents belonged to: Outside Fires (46.5%), and Structure Fires (24.8%).