Bell Gardens: Fire Incidents, California (CA)
Where are fire incidents reported in Bell Gardens, CA
Something went wrong! Please refresh the page.
|
| |||||||||||||||||||||||||||||||||||||||||||||||||||||||||||||||||||||||||||||||||||||||||||||||||||||||||||||
2005 - 2018 National Fire Incident Reporting System (NFIRS) incidents
- Incident types reported to NFIRS in Bell Gardens, CA
- 8,73369.1%Rescue & EMS
- 2,08816.5%Good Intent Call
- 8196.5%Fire
- 5084.0%False Alarm
- 2652.1%Hazardous Condition
- 1961.6%Service Call
- 140.1%Special Incident
- Fire incident types reported to NFIRS in Bell Gardens, CA
- 41650.8%Outside Fires
- 16820.5%Structure Fires
- 16420.0%Mobile Property/Vehicle Fires
- 718.7%Other
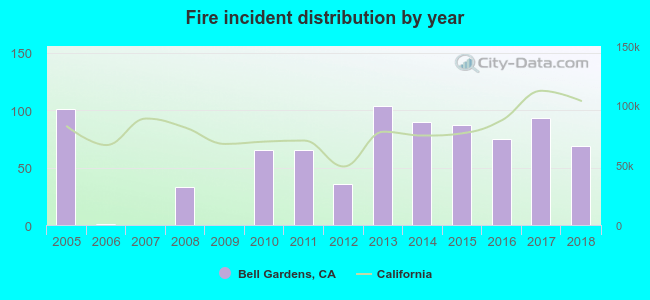 Based on the data from the years 2005 - 2018 the average number of fires per year is 59. The highest number of reported fire incidents - 104 took place in 2013, and the least - 0 in 2007. The data has a dropping trend.
The average number of yearly fire incidents per 10k residents in Bell Gardens, CA compared to nearest cities:
(Note: Based on data for the last 3 years, including only cities with population 5,000 and above)
| Bell Gardens: | 18.3 |
| Cudahy: | 13.6 |
| Bell: | 19.0 |
| Maywood: | 12.2 |
| Commerce: | 70.9 |
| Downey: | 13.6 |
| South Gate: | 15.8 |
| Huntington Park: | 19.9 |
| Walnut Park: | 11.5 |
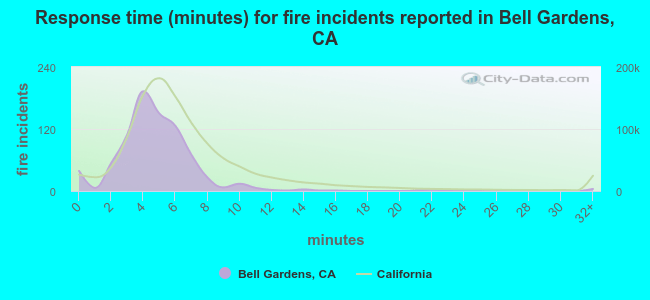 The median response time based on all reported fire incidents is 5 minutes. This is lower than the California median value.
The median response time in Bell Gardens, CA compared to nearest cities:
(Note: Based on data for all years, including only cities with at least 500 fire incidents)
| Bell Gardens: | 5 minutes |
| Bell: | 5 minutes |
| Commerce: | 5 minutes |
| Downey: | 7 minutes |
| South Gate: | 5 minutes |
| Huntington Park: | 4 minutes |
| Vernon: | 5 minutes |
| Montebello: | 7 minutes |
| Lynwood: | 4 minutes |
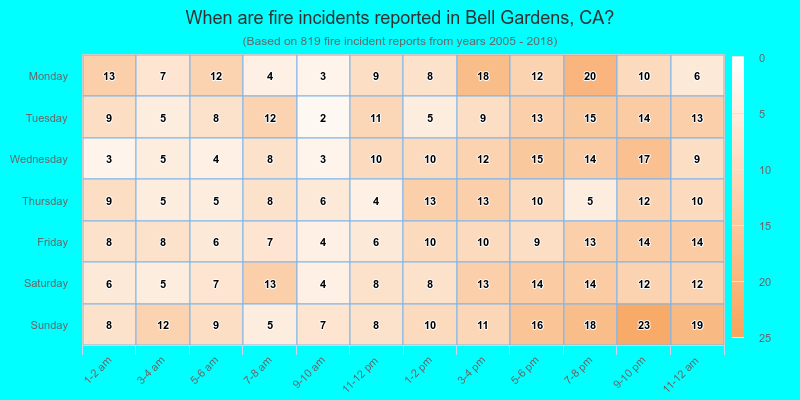
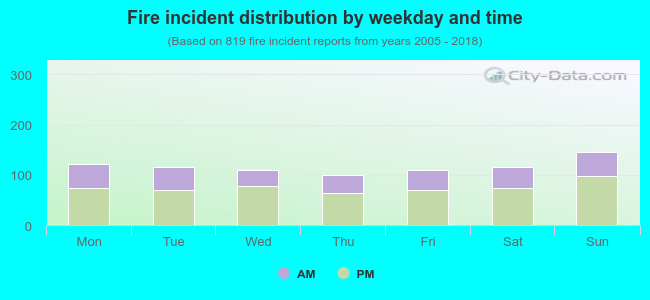 36.1% incidents where reported in the morning and 63.9% in the evening. The most fires (17.8%) took place on Sunday, and the least (12.2%) on Thursday.
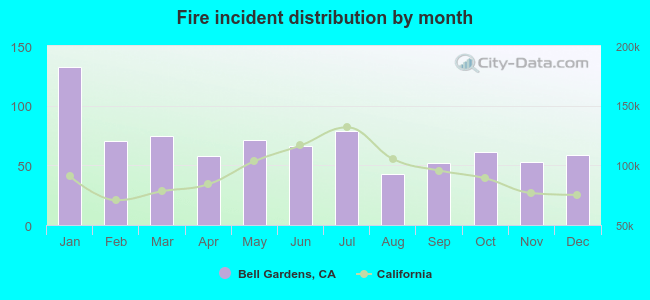 Based on the 819 reports from years 2005 - 2018 most fires (16.1%) took place during January, and the least (5.3%) in August.
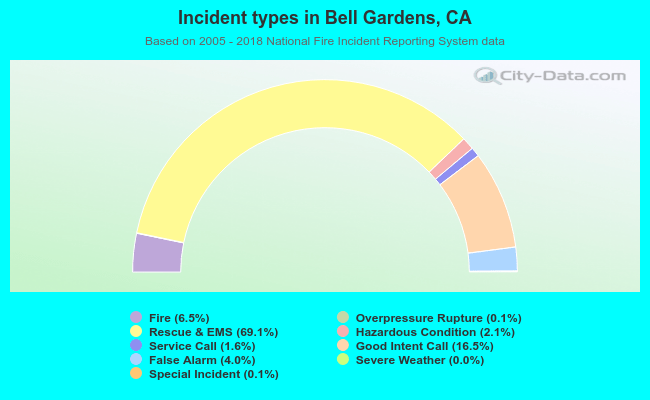 Out of all 12,632 cases reported during the years 2005 - 2018, the most belonged to the categories: Rescue & EMS (69.1%), Good Intent Call (16.5%), and Fire (6.5%).
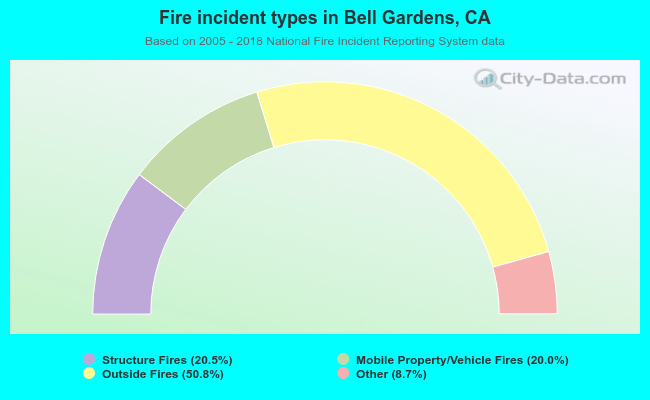 When looking into fire subcategories, the most incidents belonged to: Outside Fires (50.8%), and Structure Fires (20.5%).