Bellevue: Fire Incidents, Washington (WA)
Where are fire incidents reported in Bellevue, WA
Something went wrong! Please refresh the page.
| Fire incidents reported | |
|---|---|
| Sreet name | Count |
| 8TH ST | 702 |
| BELLEVUE WAY | 440 |
| 156TH AVE | 370 |
| 148TH AVE | 350 |
| 20TH ST | 276 |
| 116TH AVE | 268 |
| FACTORIA BLVD | 248 |
| 140TH AVE | 192 |
| 112TH AVE | 180 |
| 24TH ST | 162 |
| BELLEVUE REDMOND RD | 160 |
| MAIN ST | 158 |
| 108TH AVE | 154 |
| NORTHUP WAY | 152 |
| 16TH PL | 148 |
| 110TH AVE | 138 |
| 4TH ST | 130 |
| 120TH AVE | 122 |
| 6TH ST | 122 |
| 106TH AVE | 120 |
| 10TH ST | 118 |
| 102ND AVE | 116 |
| 1ST ST | 112 |
| 38TH ST | 102 |
| 124TH AVE | 100 |
| 12TH ST | 94 |
| 32ND ST | 94 |
| 16TH ST | 92 |
| 118TH AVE | 88 |
| 15TH ST | 88 |
| Other | 552 |
2002 - 2018 National Fire Incident Reporting System (NFIRS) incidents
- Incident types reported to NFIRS in Bellevue, WA
- 59,55067.4%Rescue & EMS
- 7,8458.9%False Alarm
- 6,1487.0%Fire
- 5,3536.1%Good Intent Call
- 5,2355.9%Service Call
- 3,9554.5%Hazardous Condition
- 1890.2%Severe Weather
- Fire incident types reported to NFIRS in Bellevue, WA
- 2,91047.3%Outside Fires
- 2,15235.0%Structure Fires
- 98015.9%Mobile Property/Vehicle Fires
- 1061.7%Other
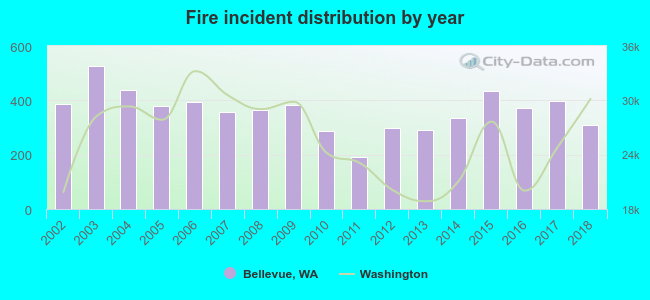 Based on the data from the years 2002 - 2018 the average number of fires per year is 362. The highest number of fires - 527 took place in 2003, and the least - 192 in 2011. The data has a dropping trend.
The average number of yearly fire incidents per 10k residents in Bellevue, WA compared to nearest cities:
(Note: Based on data for the last 3 years, including only cities with population 5,000 and above)
| Bellevue: | 26.4 |
| Mercer Island: | 12.1 |
| Newcastle: | 17.9 |
| Redmond: | 21.2 |
| Sammamish: | 11.3 |
| Kirkland: | 6.4 |
| Issaquah: | 26.1 |
| Renton: | 52.4 |
| Seattle: | 33.2 |
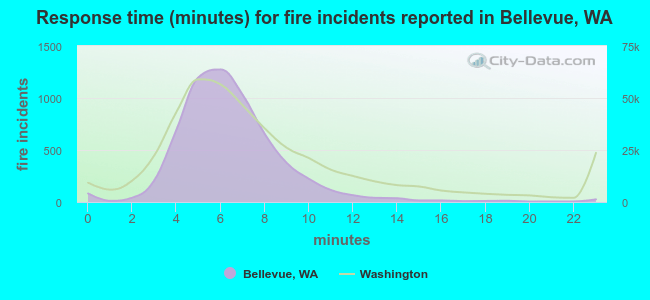 The median response time based on all reported fire incidents is 6 minutes. This is comparable to the Washington median value.
The median response time in Bellevue, WA compared to nearest cities:
(Note: Based on data for all years, including only cities with at least 500 fire incidents)
| Bellevue: | 6 minutes |
| Mercer Island: | 6 minutes |
| Redmond: | 6 minutes |
| Sammamish: | 7 minutes |
| Kirkland: | 6 minutes |
| Issaquah: | 7 minutes |
| Renton: | 6 minutes |
| Seattle: | 5 minutes |
| Tukwila: | 6 minutes |
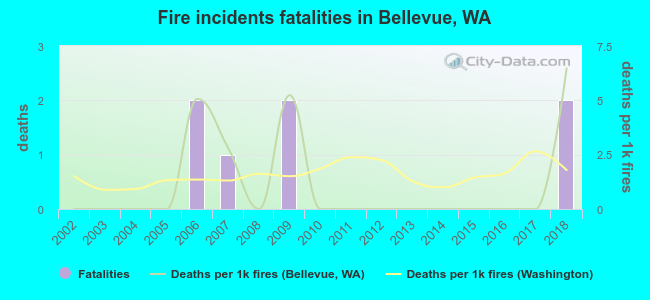 Based on the data from the years 2002 - 2018 the average number of fire-related fatalities per year is 0. The highest number of deaths - 2 took place in 2006, and the lowest - 0 in 2002. The data has a growing trend.
The average number of deaths per 1,000 fire incidents is 1. This indicator was the highest - 6 in 2018, and the lowest 0 in 2002. The trend for deaths per 1,000 fires is growing. Compared to the Washington value the number of fatalities per 1,000 incidents is lower.
Based on the data from the years 2002 - 2018 the average number of fire-related fatalities per year is 0. The highest number of deaths - 2 took place in 2006, and the lowest - 0 in 2002. The data has a growing trend.
The average number of deaths per 1,000 fire incidents is 1. This indicator was the highest - 6 in 2018, and the lowest 0 in 2002. The trend for deaths per 1,000 fires is growing. Compared to the Washington value the number of fatalities per 1,000 incidents is lower.
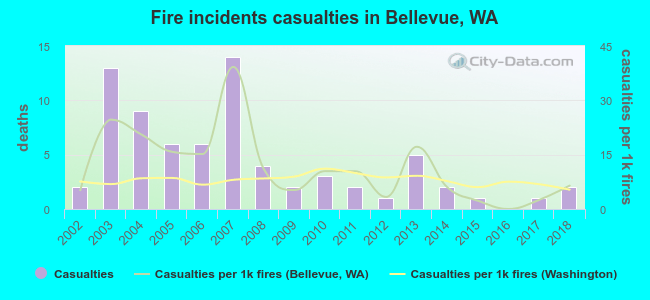 According to the reports from the years 2002 - 2018 the average number of fire-related casualties per year is 4. The highest number of injuries - 14 took place in 2007, and the lowest - 0 in 2016. The data has a constant trend.
The average number of casualties per 1,000 fires is 11. This indicator was the highest - 39 in 2007, and the lowest 0 in 2016. The trend for casualties per 1,000 incidents is growing. Compared to the Washington value the number of injuries per 1,000 incidents is higher.
According to the reports from the years 2002 - 2018 the average number of fire-related casualties per year is 4. The highest number of injuries - 14 took place in 2007, and the lowest - 0 in 2016. The data has a constant trend.
The average number of casualties per 1,000 fires is 11. This indicator was the highest - 39 in 2007, and the lowest 0 in 2016. The trend for casualties per 1,000 incidents is growing. Compared to the Washington value the number of injuries per 1,000 incidents is higher.
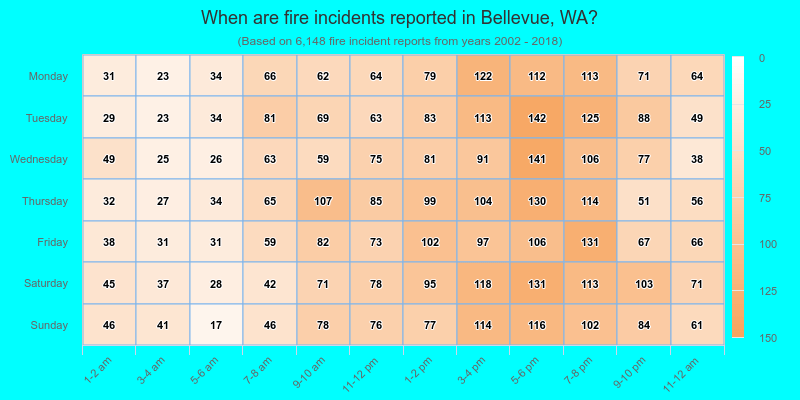
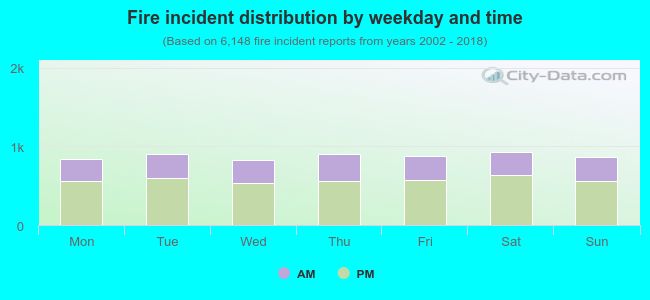 34.9% incidents where reported in the morning and 65.1% in the evening. The most fires (15.2%) took place on Saturday, and the least (13.5%) on Wednesday.
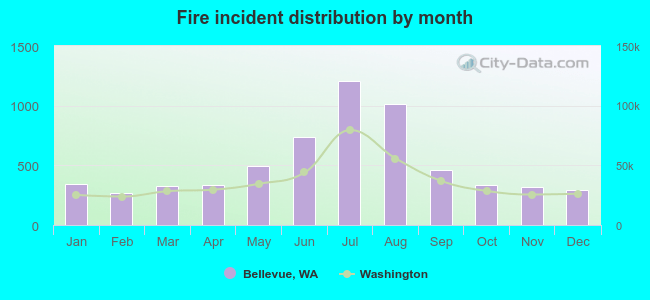 Based on the 6,148 fire incident reports from years 2002 - 2018 most fires (19.6%) took place during July, and the least (4.3%) in February.
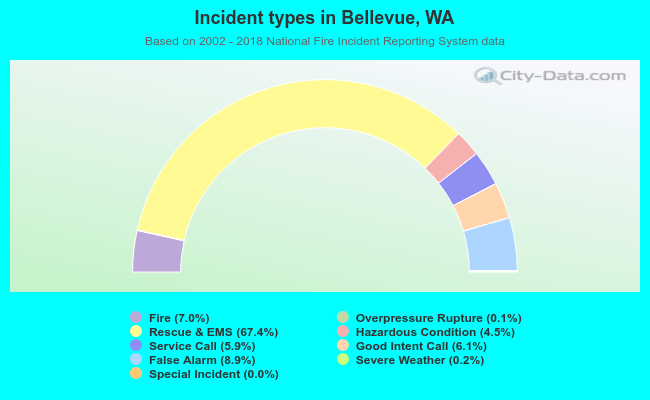 Out of all 88,357 cases reported during the years 2002 - 2018, the most belonged to the categories: Rescue & EMS (67.4%), False Alarm (8.9%), and Fire (7.0%).
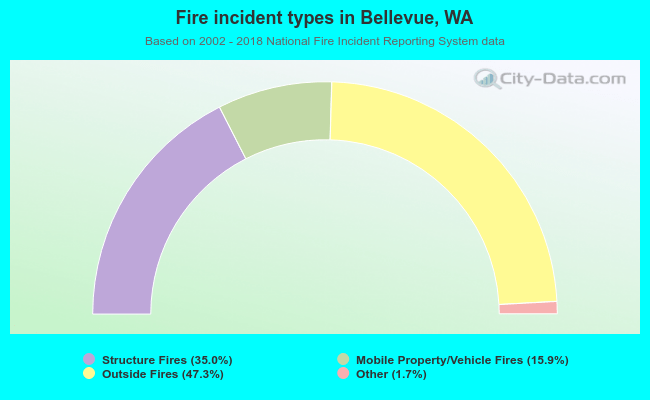 When looking into fire subcategories, the most reports belonged to: Outside Fires (47.3%), and Structure Fires (35.0%).