Renton: Fire Incidents, Washington (WA)
Where are fire incidents reported in Renton, WA
Something went wrong! Please refresh the page.
| Fire incidents reported | |
|---|---|
| Sreet name | Count |
| SUNSET BLVD | 460 |
| 4TH ST | 366 |
| PETROVITSKY RD | 324 |
| RAINIER AVE | 322 |
| GRADY WAY | 290 |
| BURNETT AVE | 150 |
| UNION AVE | 148 |
| 3RD ST | 136 |
| PUGET DR | 132 |
| MAPLE VALLEY HWY | 128 |
| ROYAL HILLS DR | 128 |
| 108TH AVE | 126 |
| LAKE WASHINGTON BLVD | 126 |
| TALBOT RD | 126 |
| PARK AVE | 110 |
| 116 AVE | 108 |
| 108 AVE | 106 |
| 7TH ST | 104 |
| MONROE AVE | 104 |
| 405 | 100 |
| CARR RD | 100 |
| GRANT AVE | 100 |
| EDMONDS AVE | 98 |
| 2ND ST | 90 |
| 12TH ST | 86 |
| EAST VALLEY RD | 86 |
| LIND AVE | 86 |
| LOGAN AVE | 86 |
| GARDEN AVE | 84 |
| MAPLE VALLEY | 84 |
| Other | 2,723 |
2002 - 2018 National Fire Incident Reporting System (NFIRS) incidents
- Incident types reported to NFIRS in Renton, WA
- 51,33167.8%Rescue & EMS
- 7,2179.5%Fire
- 5,0246.6%False Alarm
- 4,8216.4%Good Intent Call
- 3,7575.0%Hazardous Condition
- 3,0084.0%Service Call
- 4050.5%Overpressure Rupture
- 1010.1%Severe Weather
- Fire incident types reported to NFIRS in Renton, WA
- 3,06642.5%Outside Fires
- 2,87439.8%Structure Fires
- 1,14815.9%Mobile Property/Vehicle Fires
- 1291.8%Other
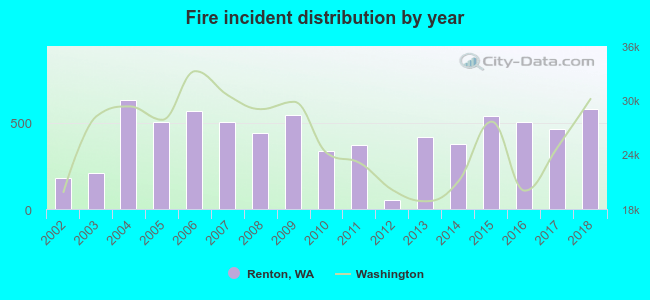 Based on the data from the years 2002 - 2018 the average number of fire incidents per year is 425. The highest number of fires - 630 took place in 2004, and the least - 52 in 2012. The data has a rising trend.
The average number of yearly fire incidents per 10k residents in Renton, WA compared to nearest cities:
(Note: Based on data for the last 3 years, including only cities with population 5,000 and above)
| Renton: | 52.4 |
| Newcastle: | 17.9 |
| Tukwila: | 102.1 |
| SeaTac: | 44.2 |
| Mercer Island: | 12.1 |
| Burien: | 39.4 |
| Kent: | 38.4 |
| Normandy Park: | 13.1 |
| Bellevue: | 26.4 |
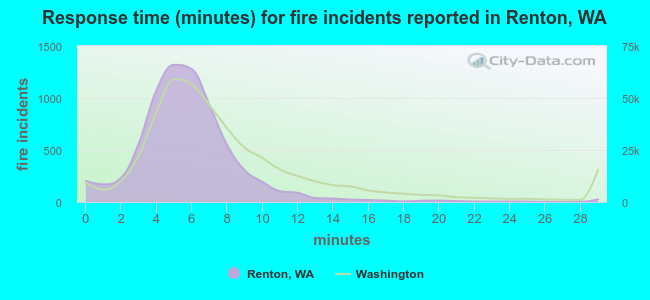 The median response time based on all reported fire incidents is 6 minutes. This is similar to the Washington median value.
The median response time in Renton, WA compared to nearest cities:
(Note: Based on data for all years, including only cities with at least 500 fire incidents)
| Renton: | 6 minutes |
| Tukwila: | 6 minutes |
| SeaTac: | 5 minutes |
| Mercer Island: | 6 minutes |
| Burien: | 5 minutes |
| Kent: | 6 minutes |
| Bellevue: | 6 minutes |
| Issaquah: | 7 minutes |
| Des Moines: | 5 minutes |
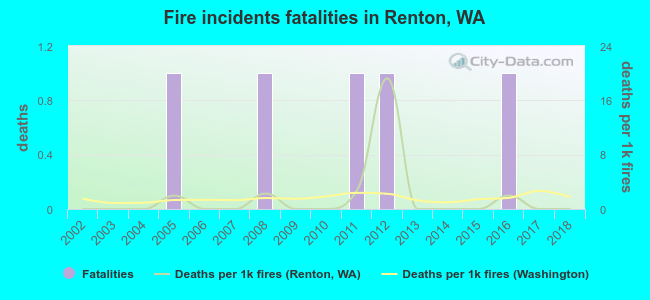 According to the reports from the years 2002 - 2018 the average number of fire-related yearly deaths is 0. The highest number of reported deaths - 1 took place in 2005, and the lowest - 0 in 2002. The data has a constant trend.
The average number of deaths per 1,000 fire incidents is 2. This indicator was the highest - 19 in 2012, and the lowest 0 in 2002. The trend for fatalities per 1,000 fires is constant. Compared to the state value the number of fatalities per 1,000 fires is much lower.
According to the reports from the years 2002 - 2018 the average number of fire-related yearly deaths is 0. The highest number of reported deaths - 1 took place in 2005, and the lowest - 0 in 2002. The data has a constant trend.
The average number of deaths per 1,000 fire incidents is 2. This indicator was the highest - 19 in 2012, and the lowest 0 in 2002. The trend for fatalities per 1,000 fires is constant. Compared to the state value the number of fatalities per 1,000 fires is much lower.
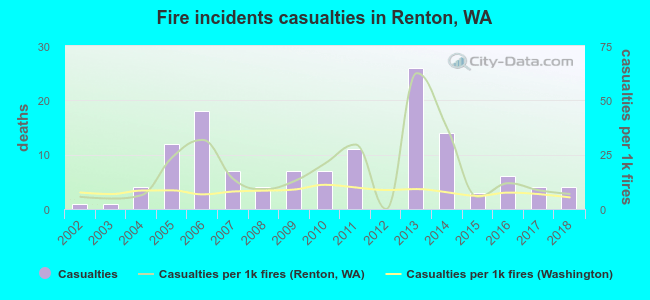 Based on the reports from the years 2002 - 2018 the average number of fire-related casualties per year is 8. The highest number of reported injuries - 26 took place in 2013, and the lowest - 0 in 2012. The data has an increasing trend.
The average number of casualties per 1,000 fires is 17. This indicator was the highest - 63 in 2013, and the lowest 0 in 2012. The trend for injuries per 1,000 fires is growing. Compared to the Washington value the number of casualties per 1,000 fire incidents is much higher.
Based on the reports from the years 2002 - 2018 the average number of fire-related casualties per year is 8. The highest number of reported injuries - 26 took place in 2013, and the lowest - 0 in 2012. The data has an increasing trend.
The average number of casualties per 1,000 fires is 17. This indicator was the highest - 63 in 2013, and the lowest 0 in 2012. The trend for injuries per 1,000 fires is growing. Compared to the Washington value the number of casualties per 1,000 fire incidents is much higher.Casualties per 1,000 incidents in Renton, WA compared to nearest cities:
(Note: Based on data for all years, including only cities with at least 500 fire incidents)
| Renton: | 17.9 |
| Tukwila: | 15.6 |
| SeaTac: | 19.7 |
| Mercer Island: | 5.4 |
| Burien: | 14.7 |
| Kent: | 11.6 |
| Bellevue: | 11.9 |
| Issaquah: | 3.7 |
| Des Moines: | 16.0 |
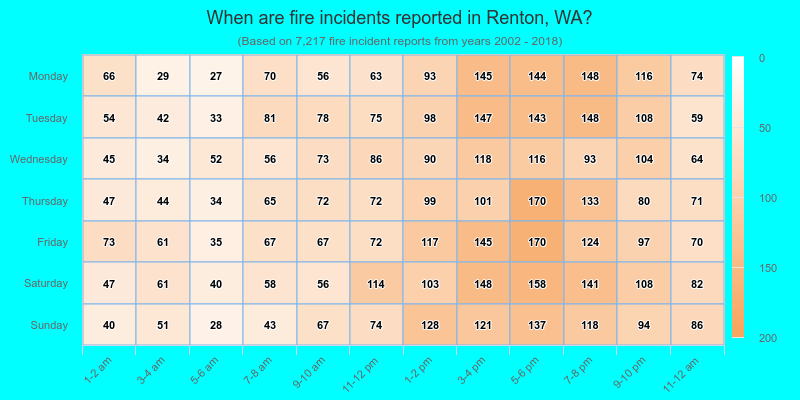
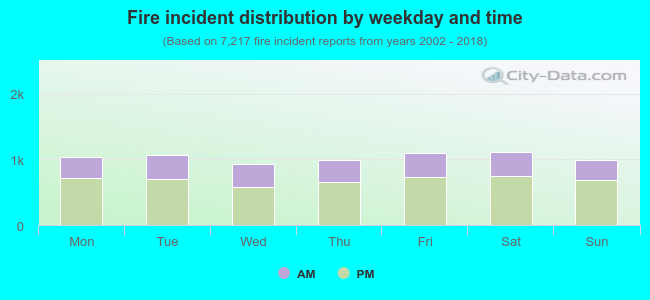 33.4% incidents where reported in the morning and 66.6% in the evening. The most fires (15.5%) took place on Saturday, and the least (12.9%) on Wednesday.
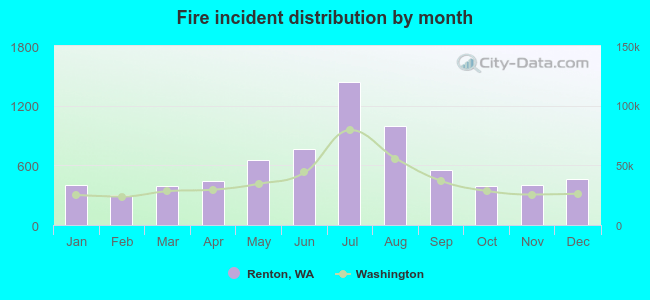 According to the 7,217 incident reports from years 2002 - 2018 most fires (19.9%) took place during July, and the least (4.2%) in February.
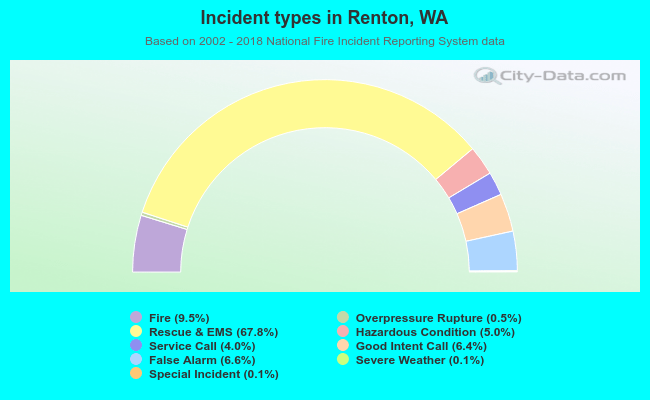 Out of all 75,707 cases reported during the years 2002 - 2018, the most belonged to the categories: Rescue & EMS (67.8%), Fire (9.5%), and False Alarm (6.6%).
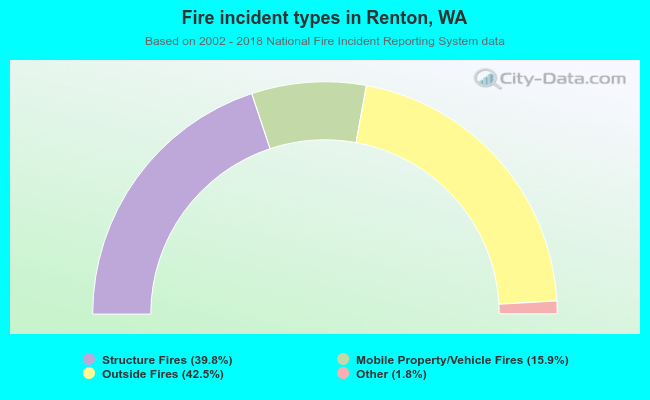 When looking into fire subcategories, the most incidents belonged to: Outside Fires (42.5%), and Structure Fires (39.8%).