Canton: Fire Incidents, Georgia (GA)
Where are fire incidents reported in Canton, GA
Something went wrong! Please refresh the page.
| Fire incidents reported | |
|---|---|
| Sreet name | Count |
| CUMMING HWY | 238 |
| KNOX BRIDGE HWY | 192 |
| HICKORY FLAT HWY | 174 |
| MARIETTA HWY | 172 |
| BELLS FERRY RD | 126 |
| EAST CHEROKEE DR | 108 |
| RIVERSTONE PKY | 108 |
| RIDGE RD | 86 |
| I575 HWY | 78 |
| UNION HILL RD | 72 |
| INTERSTATE 575 EXPY | 66 |
| LAKESIDE DR | 66 |
| UNIVETER RD | 66 |
| HICKORY RD | 62 |
| SIXES RD | 62 |
| FINCHER RD | 60 |
| ARBOR HILL RD | 52 |
| SAM NELSON RD | 52 |
| REINHARDT COLLEGE PKWY | 50 |
| SUGAR PIKE RD | 46 |
| BUTTERWORTH RD | 44 |
| FIELDS LANDING DR | 44 |
| AVERY RD | 42 |
| CANTON ST | 40 |
| WALDEN CROSSING DR | 40 |
| MARIETTA RD | 38 |
| HERITAGE DR | 36 |
| 575 | 34 |
| BALL GROUND HWY | 34 |
| LAND RD | 34 |
| Other | 2,051 |
2002 - 2018 National Fire Incident Reporting System (NFIRS) incidents
- Incident types reported to NFIRS in Canton, GA
- 29,92258.4%Rescue & EMS
- 5,20610.2%Hazardous Condition
- 4,7159.2%Good Intent Call
- 4,3738.5%Fire
- 4,1338.1%Service Call
- 2,3534.6%False Alarm
- 4140.8%Special Incident
- 820.2%Overpressure Rupture
- 640.1%Severe Weather
- Fire incident types reported to NFIRS in Canton, GA
- 1,99845.7%Outside Fires
- 1,60736.7%Structure Fires
- 61914.2%Mobile Property/Vehicle Fires
- 1493.4%Other
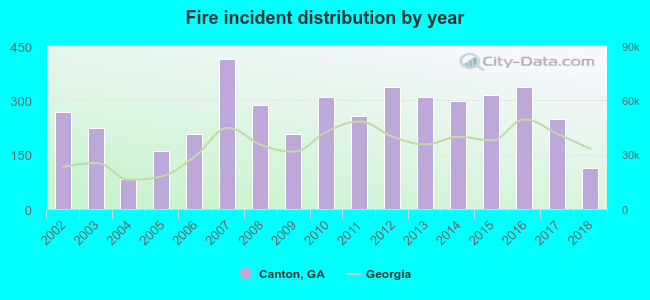 Based on the data from the years 2002 - 2018 the average number of fire incidents per year is 257. The highest number of fires - 414 took place in 2007, and the least - 82 in 2004. The data has a dropping trend.
The average number of yearly fire incidents per 10k residents in Canton, GA compared to nearest cities:
(Note: Based on data for the last 3 years, including only cities with population 5,000 and above)
| Canton: | 94.2 |
| Holly Springs: | 34.8 |
| Woodstock: | 75.2 |
| Milton: | 24.2 |
| Acworth: | 85.7 |
| Kennesaw: | 49.7 |
| Roswell: | 18.7 |
| Alpharetta: | 29.3 |
| Cartersville: | 188.9 |
 The median response time based on all reported fire incidents is 8 minutes. This is higher compared to the Georgia median value.
The median response time in Canton, GA compared to nearest cities:
(Note: Based on data for all years, including only cities with at least 500 fire incidents)
| Canton: | 8 minutes |
| Woodstock: | 7 minutes |
| Ball Ground: | 9 minutes |
| Milton: | 6 minutes |
| Acworth: | 7 minutes |
| Kennesaw: | 6 minutes |
| Roswell: | 6 minutes |
| Alpharetta: | 5 minutes |
| Jasper: | 9 minutes |
 Based on the data from the years 2002 - 2018 the average number of fire-related fatalities per year is 0. The highest number of deaths - 1 took place in 2012, and the lowest - 0 in 2002. The data has a constant trend.
The average number of deaths per 1,000 fires is 1. This indicator was the highest - 3 in 2015, and the lowest 0 in 2002. The trend for fatalities per 1,000 fires is constant. Compared to the state value the number of fatalities per 1,000 incidents is much lower.
Based on the data from the years 2002 - 2018 the average number of fire-related fatalities per year is 0. The highest number of deaths - 1 took place in 2012, and the lowest - 0 in 2002. The data has a constant trend.
The average number of deaths per 1,000 fires is 1. This indicator was the highest - 3 in 2015, and the lowest 0 in 2002. The trend for fatalities per 1,000 fires is constant. Compared to the state value the number of fatalities per 1,000 incidents is much lower.Deaths per 1,000 incidents in Canton, GA compared to nearest cities:
(Note: Based on data for all years, including only cities with at least 2,500 fire incidents)
| Canton: | 0.7 |
| Woodstock: | 1.8 |
| Acworth: | 0.7 |
| Kennesaw: | 4.7 |
| Roswell: | 1.2 |
| Alpharetta: | 0.7 |
| Cartersville: | 3.1 |
| Marietta: | 2.9 |
| Cumming: | 2.2 |
 Based on the reports from the years 2002 - 2018 the average number of fire-related casualties per year is 0. The highest number of casualties - 2 took place in 2015, and the lowest - 0 in 2002. The data has a constant trend.
The average number of injuries per 1,000 fire incidents is 1. This indicator was the highest - 6 in 2015, and the lowest 0 in 2002. The trend for injuries per 1,000 incidents is constant. Compared to the state value the number of casualties per 1,000 incidents is much lower.
Based on the reports from the years 2002 - 2018 the average number of fire-related casualties per year is 0. The highest number of casualties - 2 took place in 2015, and the lowest - 0 in 2002. The data has a constant trend.
The average number of injuries per 1,000 fire incidents is 1. This indicator was the highest - 6 in 2015, and the lowest 0 in 2002. The trend for injuries per 1,000 incidents is constant. Compared to the state value the number of casualties per 1,000 incidents is much lower.Casualties per 1,000 incidents in Canton, GA compared to nearest cities:
(Note: Based on data for all years, including only cities with at least 500 fire incidents)
| Canton: | 1.1 |
| Woodstock: | 3.1 |
| Ball Ground: | 4.6 |
| Milton: | 11.8 |
| Acworth: | 13.6 |
| Kennesaw: | 11.0 |
| Roswell: | 19.4 |
| Alpharetta: | 10.5 |
| Jasper: | 8.8 |
 24.0% incidents where reported in the morning and 76.0% in the evening. The most fires (16.4%) took place on Saturday, and the least (12.7%) on Wednesday.
 Based on the 4,373 fire incident reports from years 2002 - 2018 most fires (12.6%) took place during March, and the least (5.9%) in June.
 Out of all 51,262 cases reported during the years 2002 - 2018, the most belonged to the categories: Rescue & EMS (58.4%), Hazardous Condition (10.2%), and Good Intent Call (9.2%).
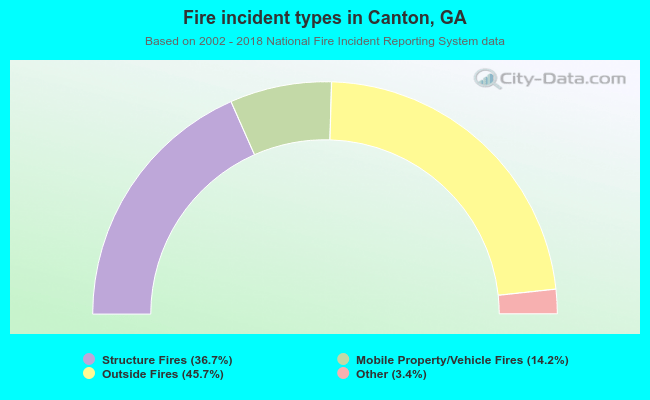 When looking into fire subcategories, the most incidents belonged to: Outside Fires (45.7%), and Structure Fires (36.7%).