Cimarron Hills: Fire Incidents, Colorado (CO)
Where are fire incidents reported in Cimarron Hills, CO
Something went wrong! Please refresh the page.
|
| |||||||||||||||||||||||||||||||||||||||||||||||||||||||||||||||||||||||||||||||||||||||||||||||||||||||||||||
2005 - 2018 National Fire Incident Reporting System (NFIRS) incidents
- Incident types reported to NFIRS in Cimarron Hills, CO
- 1,77455.8%Rescue & EMS
- 35811.3%Service Call
- 33910.7%Hazardous Condition
- 2999.4%Good Intent Call
- 2507.9%Fire
- 1524.8%False Alarm
- 40.1%Overpressure Rupture
- Fire incident types reported to NFIRS in Cimarron Hills, CO
- 11244.8%Structure Fires
- 9538.0%Outside Fires
- 3212.8%Other
- 114.4%Mobile Property/Vehicle Fires
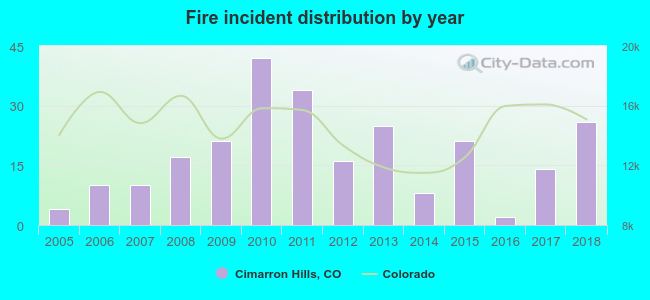 Based on the data from the years 2005 - 2018 the average number of fire incidents per year is 18. The highest number of fires - 42 took place in 2010, and the least - 2 in 2016. The data has a rising trend.
The average number of yearly fire incidents per 10k residents in Cimarron Hills, CO compared to nearest cities:
(Note: Based on data for the last 3 years, including only cities with population 5,000 and above)
| Cimarron Hills: | 8.7 |
| Elsmere: | 0.3 |
| Colorado Springs: | 17.3 |
| Stratmoor: | 1.4 |
| Fort Carson: | 9.7 |
| Manitou Springs: | 23.8 |
| Fountain: | 60.1 |
| Air Force Academy: | 1.5 |
| Black Forest: | 10.7 |

 30.4% incidents where reported in the morning and 69.6% in the evening. The most fires (17.6%) took place on Monday, and the least (10.4%) on Tuesday.
 Based on the 250 fires from years 2005 - 2018 most fires (12.4%) took place during April, and the least (4.4%) in October.
 Out of all 3,180 cases reported during the years 2005 - 2018, the most belonged to the categories: Rescue & EMS (55.8%), Service Call (11.3%), and Hazardous Condition (10.7%).
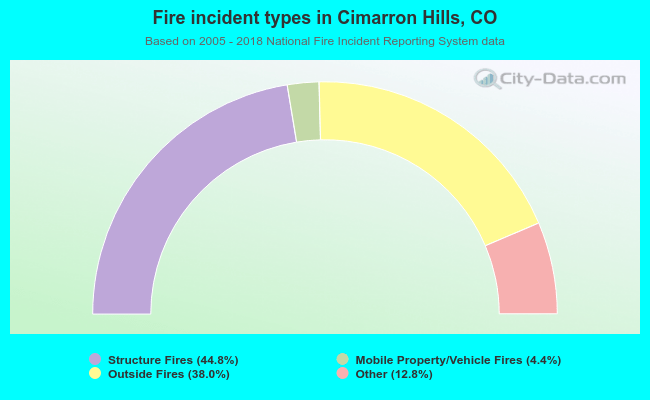 When looking into fire subcategories, the most incidents belonged to: Structure Fires (44.8%), and Outside Fires (38.0%).