Colorado Springs: Fire Incidents, Colorado (CO)
Where are fire incidents reported in Colorado Springs, CO
Something went wrong! Please refresh the page.
| Fire incidents reported | |
|---|---|
| Sreet name | Count |
| WESTERN DR | 126 |
| PETERSON RD | 90 |
| I-25 | 76 |
| POWERS BLVD | 72 |
| PALMER PARK BLVD | 66 |
| HATHAWAY DR | 62 |
| ACADEMY BLVD | 58 |
| RAMPART RANGE RD | 48 |
| I25S NEVADA AV | 46 |
| MARKSHEFFEL RD | 46 |
| OLD STAGE RD | 46 |
| BLACK FOREST RD | 44 |
| CIRCLE DR | 44 |
| B ST | 42 |
| I25W CIMARRON ST | 38 |
| PLATTE AVE | 38 |
| CONSTITUTION AVE | 36 |
| GOLD CAMP RD | 36 |
| HY24 BYPI25 | 36 |
| PIROS DR | 36 |
| BURGESS RD | 34 |
| LAS VEGAS ST | 34 |
| 115 HWY | 32 |
| HWY 94 | 32 |
| MAXWELL ST | 32 |
| CREE DR | 30 |
| HAMPTON | 30 |
| HOLMES RD | 30 |
| GALLEY RD | 28 |
| KACHINA DR | 28 |
| Other | 6,751 |
2003 - 2018 National Fire Incident Reporting System (NFIRS) incidents
- Incident types reported to NFIRS in Colorado Springs, CO
- 162,48362.6%Rescue & EMS
- 46,42617.9%Good Intent Call
- 26,22610.1%Service Call
- 10,4944.0%False Alarm
- 8,1473.1%Fire
- 5,0301.9%Hazardous Condition
- 3150.1%Special Incident
- Fire incident types reported to NFIRS in Colorado Springs, CO
- 4,27552.5%Outside Fires
- 2,16926.6%Structure Fires
- 1,40817.3%Mobile Property/Vehicle Fires
- 2953.6%Other
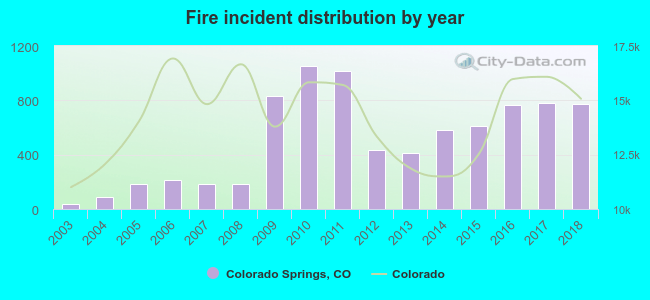 Based on the data from the years 2003 - 2018 the average number of fires per year is 509. The highest number of fire incidents - 1,056 took place in 2010, and the least - 39 in 2003. The data has an increasing trend.
The average number of yearly fire incidents per 10k residents in Colorado Springs, CO compared to nearest cities:
(Note: Based on data for the last 3 years, including only cities with population 5,000 and above)
| Colorado Springs: | 17.3 |
| Cimarron Hills: | 8.7 |
| Stratmoor: | 1.4 |
| Elsmere: | 0.3 |
| Manitou Springs: | 23.8 |
| Fort Carson: | 9.7 |
| Air Force Academy: | 1.5 |
| Fountain: | 60.1 |
| Gleneagle: | 4.0 |
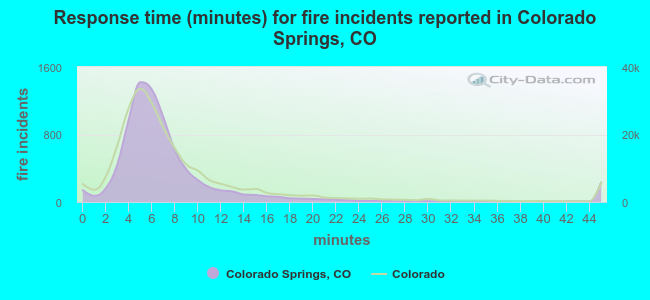 The median response time based on all reported fire incidents is 6 minutes. This is similar to the state median value.
The median response time in Colorado Springs, CO compared to nearest cities:
(Note: Based on data for all years, including only cities with at least 500 fire incidents)
| Colorado Springs: | 6 minutes |
| Fountain: | 5 minutes |
| Monument: | 8 minutes |
| Woodland Park: | 9 minutes |
| Peyton: | 12 minutes |
| Calhan: | 17 minutes |
| Elizabeth: | 8 minutes |
| Castle Rock: | 7 minutes |
| Pueblo West: | 7 minutes |
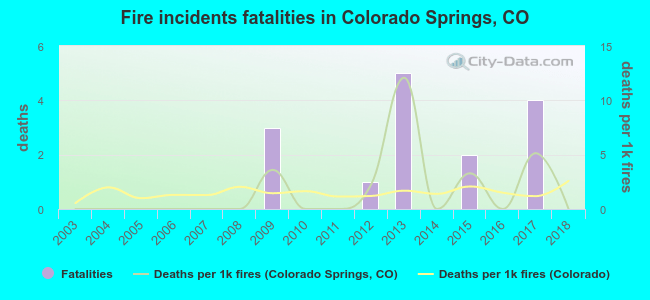 According to the reports from the years 2003 - 2018 the average number of fire-related fatalities per year is 1. The highest number of reported deaths - 5 took place in 2013, and the lowest - 0 in 2003. The data has a constant trend.
The average number of fatalities per 1,000 fires is 2. This indicator was the highest - 12 in 2013, and the lowest 0 in 2003. The trend for fatalities per 1,000 fire incidents is constant. Compared to the state value the number of fatalities per 1,000 fires is higher.
According to the reports from the years 2003 - 2018 the average number of fire-related fatalities per year is 1. The highest number of reported deaths - 5 took place in 2013, and the lowest - 0 in 2003. The data has a constant trend.
The average number of fatalities per 1,000 fires is 2. This indicator was the highest - 12 in 2013, and the lowest 0 in 2003. The trend for fatalities per 1,000 fire incidents is constant. Compared to the state value the number of fatalities per 1,000 fires is higher.Deaths per 1,000 incidents in Colorado Springs, CO compared to nearest cities:
(Note: Based on data for all years, including only cities with at least 2,500 fire incidents)
| Colorado Springs: | 1.8 |
| Pueblo: | 2.2 |
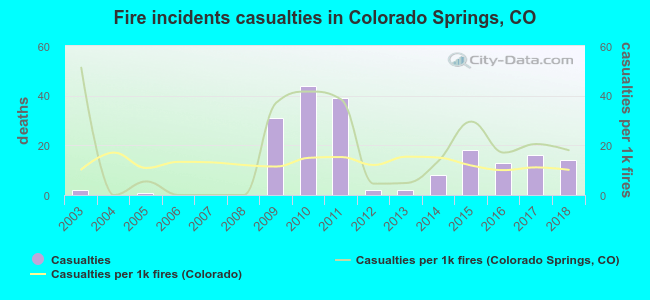 According to the reports from the years 2003 - 2018 the average number of fire-related casualties per year is 12. The highest number of reported injuries - 44 took place in 2010, and the lowest - 0 in 2004. The data has a rising trend.
The average number of injuries per 1,000 fires is 18. This indicator was the highest - 51 in 2003, and the lowest 0 in 2004. The trend for injuries per 1,000 fires is decreasing. Compared to the Colorado value the number of casualties per 1,000 fires is higher.
According to the reports from the years 2003 - 2018 the average number of fire-related casualties per year is 12. The highest number of reported injuries - 44 took place in 2010, and the lowest - 0 in 2004. The data has a rising trend.
The average number of injuries per 1,000 fires is 18. This indicator was the highest - 51 in 2003, and the lowest 0 in 2004. The trend for injuries per 1,000 fires is decreasing. Compared to the Colorado value the number of casualties per 1,000 fires is higher.Casualties per 1,000 incidents in Colorado Springs, CO compared to nearest cities:
(Note: Based on data for all years, including only cities with at least 500 fire incidents)
| Colorado Springs: | 23.3 |
| Fountain: | 21.8 |
| Monument: | 7.7 |
| Woodland Park: | 3.9 |
| Peyton: | 6.4 |
| Calhan: | 7.2 |
| Elizabeth: | 1.8 |
| Castle Rock: | 20.5 |
| Pueblo West: | 9.7 |
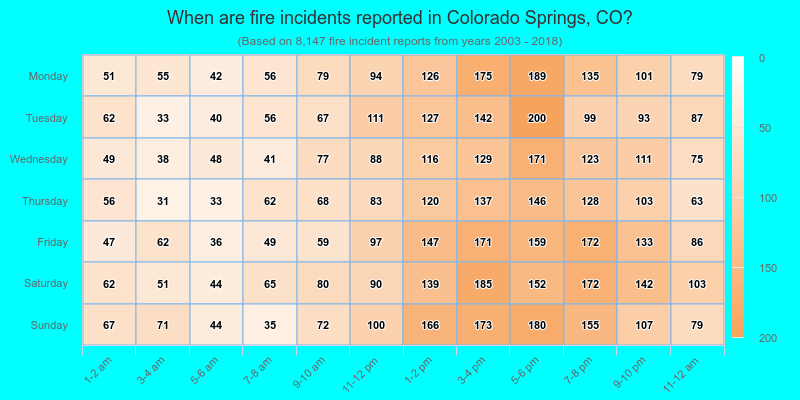
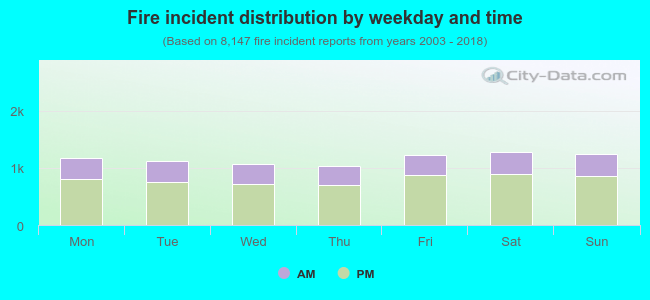 31.3% incidents where reported in the morning and 68.7% in the evening. The most fires (15.8%) took place on Saturday, and the least (12.6%) on Thursday.
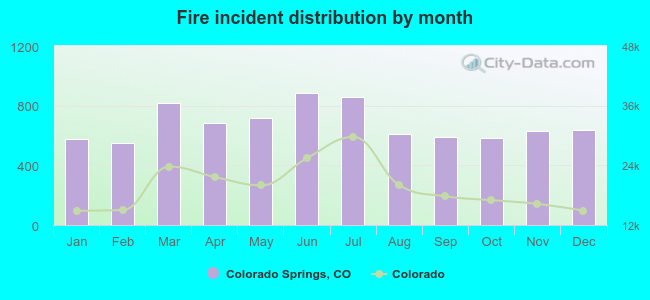 Based on the 8,147 fire incident reports from years 2003 - 2018 most fires (10.8%) took place during June, and the least (6.8%) in February.
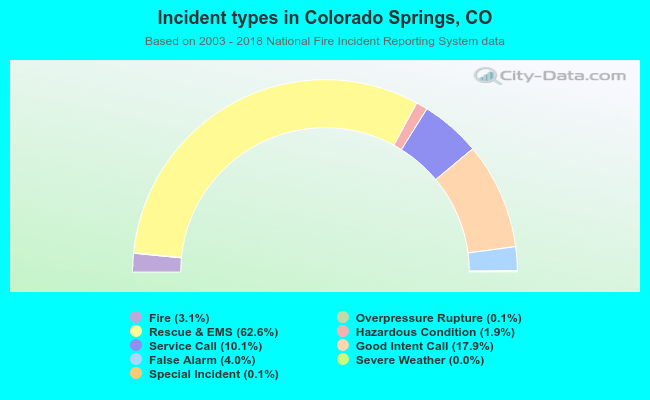 Out of all 259,359 cases reported during the years 2003 - 2018, the most belonged to the categories: Rescue & EMS (62.6%), Good Intent Call (17.9%), and Service Call (10.1%).
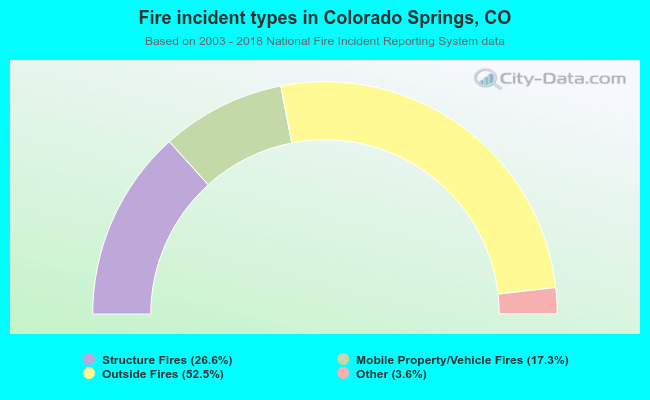 When looking into fire subcategories, the most incidents belonged to: Outside Fires (52.5%), and Structure Fires (26.6%).