Clarinda: Fire Incidents, Iowa (IA)
Where are fire incidents reported in Clarinda, IA
Something went wrong! Please refresh the page.
|
| |||||||||||||||||||||||||||||||||||||||||||||||||||||||||||||||||||||||||||||||||||||||||||||||||||||||||||||
2002 - 2017 National Fire Incident Reporting System (NFIRS) incidents
- Incident types reported to NFIRS in Clarinda, IA
- 37161.3%Fire
- 7812.9%Rescue & EMS
- 6911.4%Hazardous Condition
- 325.3%Good Intent Call
- 294.8%False Alarm
- 172.8%Service Call
- 40.7%Overpressure Rupture
- 40.7%Severe Weather
- 10.2%Special Incident
- Fire incident types reported to NFIRS in Clarinda, IA
- 16343.9%Outside Fires
- 10829.1%Structure Fires
- 6517.5%Mobile Property/Vehicle Fires
- 359.4%Other
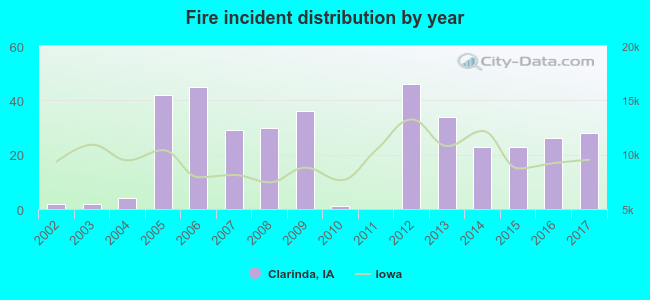 Based on the data from the years 2002 - 2017 the average number of fire incidents per year is 23. The highest number of fire incidents - 46 took place in 2012, and the least - 0 in 2011. The data has a rising trend.
The average number of yearly fire incidents per 10k residents in Clarinda, IA compared to nearest cities:
(Note: Based on data for the last 3 years, including only cities with population 5,000 and above)
| Clarinda: | 50.4 |
| Shenandoah: | 74.2 |
| Red Oak: | 15.6 |

 According to the reports from the years 2002 - 2017 the average number of fire-related casualties per year is 0. The highest number of reported injuries - 3 took place in 2008, and the lowest - 0 in 2002. The data has a rising trend.
 27.2% incidents where reported in the morning and 72.8% in the evening. The most fires (17.3%) took place on Saturday, and the least (11.9%) on Wednesday.
 According to the 371 fires from years 2002 - 2017 most fires (13.7%) took place during March, and the least (4.3%) in September.
 Out of all 605 cases reported during the years 2002 - 2017, the most belonged to the categories: Fire (61.3%), Rescue & EMS (12.9%), and Hazardous Condition (11.4%).
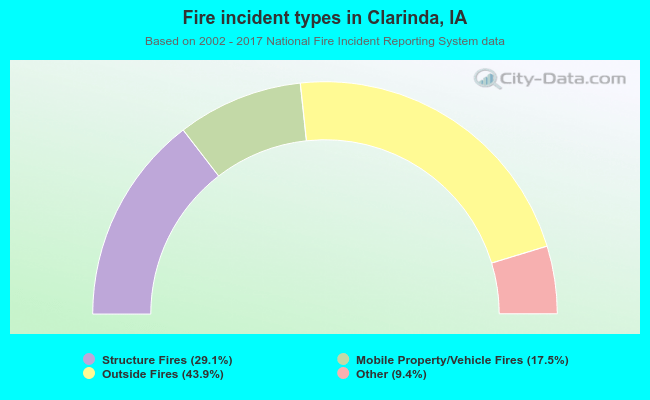 When looking into fire subcategories, the most incidents belonged to: Outside Fires (43.9%), and Structure Fires (29.1%).