Shenandoah: Fire Incidents, Iowa (IA)
Where are fire incidents reported in Shenandoah, IA
Something went wrong! Please refresh the page.
|
| |||||||||||||||||||||||||||||||||||||||||||||||||||||||||||||||||||||||||||||||||||||||||||||||||||||||||||||
2002 - 2018 National Fire Incident Reporting System (NFIRS) incidents
- Incident types reported to NFIRS in Shenandoah, IA
- 75552.2%Fire
- 31521.8%Hazardous Condition
- 1329.1%Good Intent Call
- 1147.9%False Alarm
- 674.6%Rescue & EMS
- 402.8%Service Call
- 110.8%Special Incident
- 100.7%Overpressure Rupture
- Fire incident types reported to NFIRS in Shenandoah, IA
- 34345.4%Structure Fires
- 28738.0%Outside Fires
- 10113.4%Mobile Property/Vehicle Fires
- 243.2%Other
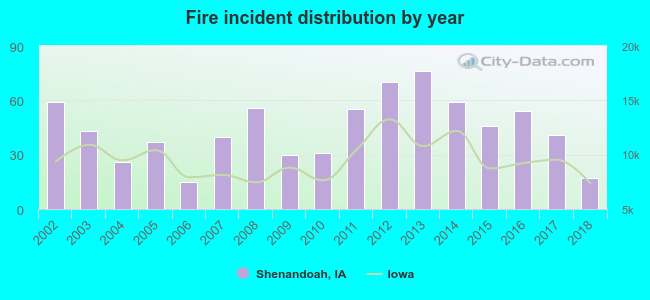 Based on the data from the years 2002 - 2018 the average number of fire incidents per year is 44. The highest number of fire incidents - 76 took place in 2013, and the least - 15 in 2006. The data has a dropping trend.
 The median response time based on all reported fire incidents is 4 minutes. This is lower compared to the state median value.
The median response time in Shenandoah, IA compared to nearest cities:
(Note: Based on data for all years, including only cities with at least 500 fire incidents)
| Shenandoah: | 4 minutes |
| Red Oak: | 6 minutes |
 30.6% incidents where reported in the morning and 69.4% in the evening. The most fires (16.2%) took place on Sunday, and the least (12.2%) on Tuesday.
 According to the 755 reports from years 2002 - 2018 most fires (15.8%) took place during March, and the least (4.9%) in August.
 Out of all 1,445 cases reported during the years 2002 - 2018, the most belonged to the categories: Fire (52.2%), Hazardous Condition (21.8%), and Good Intent Call (9.1%).
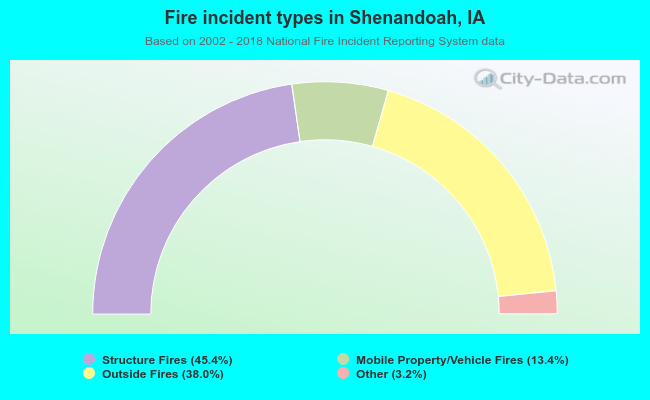 When looking into fire subcategories, the most incidents belonged to: Structure Fires (45.4%), and Outside Fires (38.0%).