Conway: Fire Incidents, Arkansas (AR)
Where are fire incidents reported in Conway, AR
Something went wrong! Please refresh the page.
| Fire incidents reported | |
|---|---|
| Sreet name | Count |
| INTERSTATE 40 | 424 |
| DAVE WARD DRIVE | 182 |
| HARKRIDER STREET | 168 |
| DONAGHEY AVENUE | 132 |
| SKYLINE DRIVE | 126 |
| OLD MORRILTON HIGHWAY | 116 |
| OAK STREET | 98 |
| ROBINS STREET | 96 |
| PRINCE STREET | 90 |
| SKUNK HOLLOW RD | 80 |
| ROBINS ST | 76 |
| HIGHWAY 286 | 68 |
| HIGHWAY 64 | 68 |
| HOGAN LANE | 64 |
| I40EB | 64 |
| COLLEGE AVENUE | 62 |
| DAVE WARD DR | 62 |
| OAK STREET, | 60 |
| STURGIS RD | 56 |
| EAST GERMAN LANE | 52 |
| EXCHANGE AVENUE | 52 |
| CLIFTON STREET | 50 |
| SALEM ROAD | 50 |
| AMITY ROAD | 48 |
| BRUCE STREET | 46 |
| MCNUTT ROAD | 46 |
| SCENIC HILL RD | 46 |
| SOUTH GERMAN LANE | 46 |
| HIGHWAY 25 | 44 |
| CANEY CREEK RD | 42 |
| Other | 2,550 |
2002 - 2018 National Fire Incident Reporting System (NFIRS) incidents
- Incident types reported to NFIRS in Conway, AR
- 21,62855.8%Rescue & EMS
- 5,16413.3%Fire
- 3,8099.8%False Alarm
- 3,5639.2%Service Call
- 2,6486.8%Hazardous Condition
- 1,5964.1%Good Intent Call
- 1230.3%Overpressure Rupture
- 1150.3%Severe Weather
- 1110.3%Special Incident
- Fire incident types reported to NFIRS in Conway, AR
- 2,63351.0%Outside Fires
- 1,50529.1%Structure Fires
- 72314.0%Mobile Property/Vehicle Fires
- 3035.9%Other
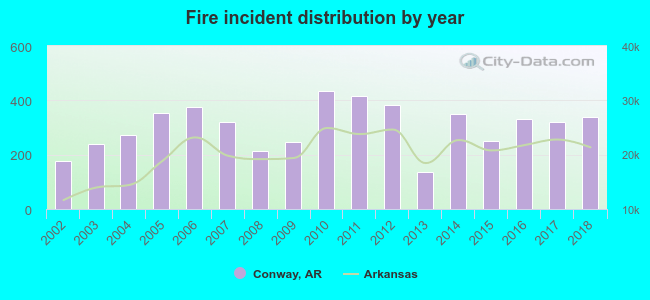 Based on the data from the years 2002 - 2018 the average number of fires per year is 304. The highest number of fire incidents - 434 took place in 2010, and the least - 135 in 2013. The data has a rising trend.
The average number of yearly fire incidents per 10k residents in Conway, AR compared to nearest cities:
(Note: Based on data for the last 3 years, including only cities with population 5,000 and above)
| Conway: | 51.4 |
| Greenbrier: | 210.4 |
| Maumelle: | 23.6 |
| Morrilton: | 87.4 |
| Sherwood: | 68.3 |
| North Little Rock: | 87.9 |
| Jacksonville: | 71.7 |
| Little Rock: | 80.1 |
| Cabot: | 64.8 |
 The median response time based on all reported fire incidents is 5 minutes. This is lower compared to the Arkansas median value.
The median response time in Conway, AR compared to nearest cities:
(Note: Based on data for all years, including only cities with at least 500 fire incidents)
| Conway: | 5 minutes |
| Mayflower: | 11 minutes |
| Greenbrier: | 7 minutes |
| Vilonia: | 6 minutes |
| Maumelle: | 3 minutes |
| Morrilton: | 7 minutes |
| Perryville: | 8 minutes |
| Sherwood: | 4 minutes |
| North Little Rock: | 5 minutes |
 According to the data from the years 2002 - 2018 the average number of fire-related fatalities per year is 1. The highest number of reported deaths - 5 took place in 2009, and the lowest - 0 in 2002. The data has a constant trend.
The average number of deaths per 1,000 fires is 3. This indicator was the highest - 20 in 2009, and the lowest 0 in 2002. The trend for deaths per 1,000 incidents is constant. Compared to the state value the number of deaths per 1,000 fires is higher.
According to the data from the years 2002 - 2018 the average number of fire-related fatalities per year is 1. The highest number of reported deaths - 5 took place in 2009, and the lowest - 0 in 2002. The data has a constant trend.
The average number of deaths per 1,000 fires is 3. This indicator was the highest - 20 in 2009, and the lowest 0 in 2002. The trend for deaths per 1,000 incidents is constant. Compared to the state value the number of deaths per 1,000 fires is higher.Deaths per 1,000 incidents in Conway, AR compared to nearest cities:
(Note: Based on data for all years, including only cities with at least 2,500 fire incidents)
| Conway: | 2.7 |
| Sherwood: | 0.7 |
| North Little Rock: | 2.3 |
| Jacksonville: | 1.6 |
| Little Rock: | 1.4 |
| Cabot: | 1.1 |
| Benton: | 1.2 |
| Russellville: | 1.7 |
| Searcy: | 1.0 |
 According to the data from the years 2002 - 2018 the average number of fire-related casualties per year is 0. The highest number of reported injuries - 1 took place in 2003, and the lowest - 0 in 2002. The data has a constant trend.
The average number of casualties per 1,000 fires is 1. This indicator was the highest - 4 in 2003, and the lowest 0 in 2002. The trend for injuries per 1,000 fire incidents is constant. Compared to the state value the number of injuries per 1,000 fire incidents is much lower.
According to the data from the years 2002 - 2018 the average number of fire-related casualties per year is 0. The highest number of reported injuries - 1 took place in 2003, and the lowest - 0 in 2002. The data has a constant trend.
The average number of casualties per 1,000 fires is 1. This indicator was the highest - 4 in 2003, and the lowest 0 in 2002. The trend for injuries per 1,000 fire incidents is constant. Compared to the state value the number of injuries per 1,000 fire incidents is much lower.Casualties per 1,000 incidents in Conway, AR compared to nearest cities:
(Note: Based on data for all years, including only cities with at least 500 fire incidents)
| Conway: | 0.6 |
| Mayflower: | 0.0 |
| Greenbrier: | 2.2 |
| Vilonia: | 2.3 |
| Maumelle: | 10.5 |
| Morrilton: | 2.8 |
| Perryville: | 0.0 |
| Sherwood: | 1.5 |
| North Little Rock: | 4.5 |
 27.8% incidents where reported in the morning and 72.2% in the evening. The most fires (15.8%) took place on Saturday, and the least (13.6%) on Friday.
 Based on the 5,164 reports from years 2002 - 2018 most fires (11.3%) took place during January, and the least (6.4%) in May.
 Out of all 38,757 cases reported during the years 2002 - 2018, the most belonged to the categories: Rescue & EMS (55.8%), Fire (13.3%), and False Alarm (9.8%).
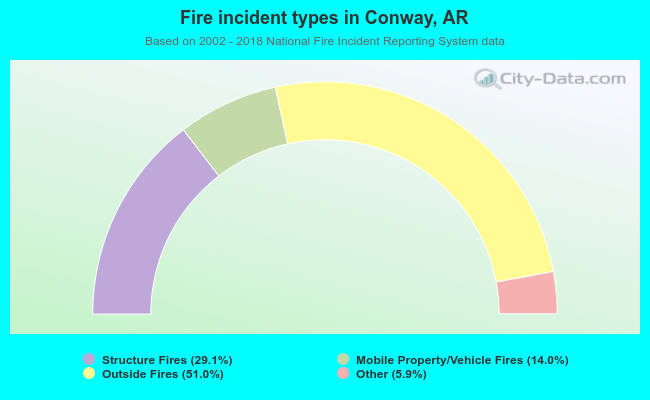 When looking into fire subcategories, the most reports belonged to: Outside Fires (51.0%), and Structure Fires (29.1%).