North Little Rock: Fire Incidents, Arkansas (AR)
Where are fire incidents reported in North Little Rock, AR
Something went wrong! Please refresh the page.
| Fire incidents reported | |
|---|---|
| Sreet name | Count |
| WILLOW | 458 |
| INTERSTATE 40 | 178 |
| DIVISION | 174 |
| MCCAIN BLVD | 126 |
| HIGHWAY 161 | 124 |
| HWY 161 | 124 |
| BROADWAY ST | 120 |
| PIKE | 102 |
| CRYSTAL HILL RD | 100 |
| I40 | 100 |
| CAMP ROBINSON RD | 94 |
| I-40 | 94 |
| PARKER | 92 |
| HWY 70 | 90 |
| BROADWAY | 88 |
| JOHN F KENNEDY BLVD | 82 |
| MACARTHUR DR | 78 |
| 16TH ST | 76 |
| BISHOP LINDSEY AVE | 74 |
| VALENTINE RD | 74 |
| 46TH ST | 70 |
| 18TH ST | 68 |
| LAKEVIEW | 68 |
| FAULKNER LAKE RD | 64 |
| MACARTHUR | 64 |
| MAUMELLE BLVD | 64 |
| 19TH ST | 58 |
| DONOVAN BRILEY BLVD | 58 |
| 2ND ST | 56 |
| VELVET RIDGE | 56 |
| Other | 2,230 |
2002 - 2018 National Fire Incident Reporting System (NFIRS) incidents
- Incident types reported to NFIRS in North Little Rock, AR
- 26,36052.1%Rescue & EMS
- 8,44116.7%Good Intent Call
- 5,30410.5%Fire
- 4,1488.2%Service Call
- 3,1326.2%Hazardous Condition
- 3,0206.0%False Alarm
- 650.1%Overpressure Rupture
- 540.1%Severe Weather
- Fire incident types reported to NFIRS in North Little Rock, AR
- 2,15640.6%Outside Fires
- 2,04438.5%Structure Fires
- 94817.9%Mobile Property/Vehicle Fires
- 1562.9%Other
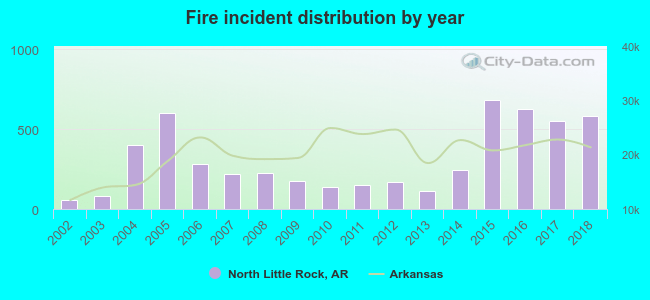 According to the data from the years 2002 - 2018 the average number of fire incidents per year is 312. The highest number of fires - 680 took place in 2015, and the least - 58 in 2002. The data has an increasing trend.
The average number of yearly fire incidents per 10k residents in North Little Rock, AR compared to nearest cities:
(Note: Based on data for the last 3 years, including only cities with population 5,000 and above)
| North Little Rock: | 87.9 |
| Sherwood: | 68.3 |
| Little Rock: | 80.1 |
| Maumelle: | 23.6 |
| Jacksonville: | 71.7 |
| East End: | 1.4 |
| Bryant: | 54.2 |
| Cabot: | 64.8 |
| Benton: | 96.6 |
 The median response time based on all reported fire incidents is 5 minutes. This is lower than the state median value.
The median response time in North Little Rock, AR compared to nearest cities:
(Note: Based on data for all years, including only cities with at least 500 fire incidents)
| North Little Rock: | 5 minutes |
| Sherwood: | 4 minutes |
| Little Rock: | 5 minutes |
| Maumelle: | 3 minutes |
| Jacksonville: | 5 minutes |
| Scott: | 9 minutes |
| Alexander: | 9 minutes |
| Mayflower: | 11 minutes |
| Bryant: | 5 minutes |
 Based on the data from the years 2002 - 2018 the average number of fire-related yearly deaths is 1. The highest number of reported deaths - 2 took place in 2005, and the lowest - 0 in 2002. The data has an increasing trend.
The average number of fatalities per 1,000 fire incidents is 3. This indicator was the highest - 12 in 2003, and the lowest 0 in 2002. The trend for deaths per 1,000 fires is increasing. Compared to the state value the number of fatalities per 1,000 fire incidents is about the same.
Based on the data from the years 2002 - 2018 the average number of fire-related yearly deaths is 1. The highest number of reported deaths - 2 took place in 2005, and the lowest - 0 in 2002. The data has an increasing trend.
The average number of fatalities per 1,000 fire incidents is 3. This indicator was the highest - 12 in 2003, and the lowest 0 in 2002. The trend for deaths per 1,000 fires is increasing. Compared to the state value the number of fatalities per 1,000 fire incidents is about the same.Deaths per 1,000 incidents in North Little Rock, AR compared to nearest cities:
(Note: Based on data for all years, including only cities with at least 2,500 fire incidents)
| North Little Rock: | 2.3 |
| Sherwood: | 0.7 |
| Little Rock: | 1.4 |
| Jacksonville: | 1.6 |
| Cabot: | 1.1 |
| Benton: | 1.2 |
| Conway: | 2.7 |
| Pine Bluff: | 1.5 |
 According to the data from the years 2002 - 2018 the average number of fire-related casualties per year is 1. The highest number of casualties - 3 took place in 2003, and the lowest - 0 in 2007. The data has a constant trend.
The average number of injuries per 1,000 fires is 7. This indicator was the highest - 36 in 2003, and the lowest 0 in 2007. The trend for casualties per 1,000 fires is dropping. Compared to the state value the number of injuries per 1,000 fire incidents is about the same.
According to the data from the years 2002 - 2018 the average number of fire-related casualties per year is 1. The highest number of casualties - 3 took place in 2003, and the lowest - 0 in 2007. The data has a constant trend.
The average number of injuries per 1,000 fires is 7. This indicator was the highest - 36 in 2003, and the lowest 0 in 2007. The trend for casualties per 1,000 fires is dropping. Compared to the state value the number of injuries per 1,000 fire incidents is about the same.Casualties per 1,000 incidents in North Little Rock, AR compared to nearest cities:
(Note: Based on data for all years, including only cities with at least 500 fire incidents)
| North Little Rock: | 4.5 |
| Sherwood: | 1.5 |
| Little Rock: | 9.9 |
| Maumelle: | 10.5 |
| Jacksonville: | 8.1 |
| Scott: | 0.0 |
| Alexander: | 3.5 |
| Mayflower: | 0.0 |
| Bryant: | 3.5 |
 32.1% incidents where reported in the morning and 67.9% in the evening. The most fires (15.7%) took place on Saturday, and the least (13.4%) on Monday.
 Based on the 5,304 incident reports from years 2002 - 2018 most fires (9.9%) took place during July, and the least (7.4%) in September.
 Out of all 50,562 cases reported during the years 2002 - 2018, the most belonged to the categories: Rescue & EMS (52.1%), Good Intent Call (16.7%), and Fire (10.5%).
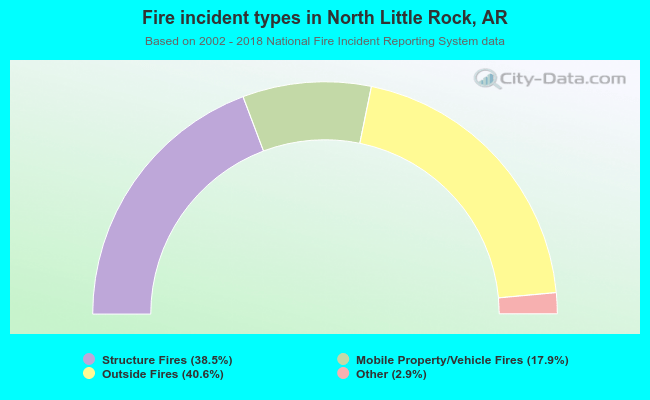 When looking into fire subcategories, the most incidents belonged to: Outside Fires (40.6%), and Structure Fires (38.5%).