Danville: Fire Incidents, Kentucky (KY)
Where are fire incidents reported in Danville, KY
Something went wrong! Please refresh the page.
| Fire incidents reported | |
|---|---|
| Sreet name | Count |
| MAIN ST | 108 |
| HUSTONVILLE RD | 102 |
| PERRYVILLE RD | 78 |
| THIRD ST | 78 |
| LEBANON RD | 64 |
| LEXINGTON AVE | 56 |
| FOURTH ST | 48 |
| DANVILLE BYP | 42 |
| SKYWATCH DR | 38 |
| LEXINGTON RD | 34 |
| WALNUT ST | 34 |
| WALTON AVE | 28 |
| MAPLE AVE | 26 |
| JANE TRL | 20 |
| SHAKERTOWN RD | 20 |
| STANFORD RD | 20 |
| 3RD ST | 18 |
| BAUGHMAN AVE | 18 |
| BROADWAY ST | 18 |
| MAY BLVD | 18 |
| HIGHLAND CT | 16 |
| LANCASTER RD | 16 |
| BOONE TRL | 14 |
| DANIEL DR | 14 |
| EARL ST | 14 |
| HILL-N-DALE DR | 14 |
| LISA AVE | 14 |
| LOCUST ST | 14 |
| STANFORD AVE | 14 |
| CHESTNUT ST | 12 |
| Other | 242 |
2003 - 2018 National Fire Incident Reporting System (NFIRS) incidents
- Incident types reported to NFIRS in Danville, KY
- 3,57942.7%Rescue & EMS
- 1,25415.0%Hazardous Condition
- 1,25214.9%Fire
- 96111.5%Good Intent Call
- 8259.8%False Alarm
- 4155.0%Service Call
- 600.7%Overpressure Rupture
- 210.3%Special Incident
- 140.2%Severe Weather
- Fire incident types reported to NFIRS in Danville, KY
- 52642.0%Structure Fires
- 40832.6%Outside Fires
- 24119.2%Mobile Property/Vehicle Fires
- 776.2%Other
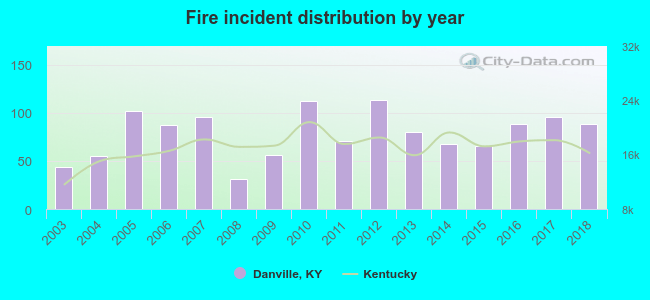 According to the data from the years 2003 - 2018 the average number of fire incidents per year is 78. The highest number of fire incidents - 113 took place in 2012, and the least - 31 in 2008. The data has a rising trend.
The average number of yearly fire incidents per 10k residents in Danville, KY compared to nearest cities:
(Note: Based on data for the last 3 years, including only cities with population 5,000 and above)
| Danville: | 54.6 |
| Harrodsburg: | 106.4 |
| Wilmore: | 12.5 |
| Nicholasville: | 62.1 |
| Waynesburg: | 64.9 |
| Berea: | 36.2 |
| Lebanon: | 10.1 |
| Richmond: | 89.8 |
| Lawrenceburg: | 40.6 |
 The median response time based on all reported fire incidents is 5 minutes. This is lower compared to the state median value.
The median response time in Danville, KY compared to nearest cities:
(Note: Based on data for all years, including only cities with at least 500 fire incidents)
| Danville: | 5 minutes |
| Harrodsburg: | 6 minutes |
| Stanford: | 11 minutes |
| Lancaster: | 10 minutes |
| Hustonville: | 12 minutes |
| Nicholasville: | 6 minutes |
| Liberty: | 9 minutes |
| Springfield: | 12 minutes |
| Brodhead: | 9 minutes |
 Based on the reports from the years 2003 - 2018 the average number of fire-related fatalities per year is 1. The highest number of deaths - 4 took place in 2016, and the lowest - 0 in 2003. The data has a constant trend.
 Based on the data from the years 2003 - 2018 the average number of fire-related casualties per year is 1. The highest number of reported injuries - 2 took place in 2015, and the lowest - 0 in 2003. The data has an increasing trend.
The average number of injuries per 1,000 fire incidents is 7. This indicator was the highest - 31 in 2015, and the lowest 0 in 2003. The trend for casualties per 1,000 incidents is increasing. Compared to the state value the number of casualties per 1,000 incidents is about the same.
Based on the data from the years 2003 - 2018 the average number of fire-related casualties per year is 1. The highest number of reported injuries - 2 took place in 2015, and the lowest - 0 in 2003. The data has an increasing trend.
The average number of injuries per 1,000 fire incidents is 7. This indicator was the highest - 31 in 2015, and the lowest 0 in 2003. The trend for casualties per 1,000 incidents is increasing. Compared to the state value the number of casualties per 1,000 incidents is about the same.Casualties per 1,000 incidents in Danville, KY compared to nearest cities:
(Note: Based on data for all years, including only cities with at least 500 fire incidents)
| Danville: | 7.2 |
| Harrodsburg: | 4.1 |
| Stanford: | 2.6 |
| Lancaster: | 1.2 |
| Hustonville: | 0.0 |
| Nicholasville: | 15.5 |
| Liberty: | 0.9 |
| Springfield: | 0.0 |
| Brodhead: | 0.0 |
 33.9% incidents where reported in the morning and 66.1% in the evening. The most fires (15.1%) took place on Monday, and the least (13.7%) on Sunday.
 According to the 1,252 fire incidents from years 2003 - 2018 most fires (10.1%) took place during June, and the least (5.3%) in January.
 Out of all 8,381 cases reported during the years 2003 - 2018, the most belonged to the categories: Rescue & EMS (42.7%), Hazardous Condition (15.0%), and Fire (14.9%).
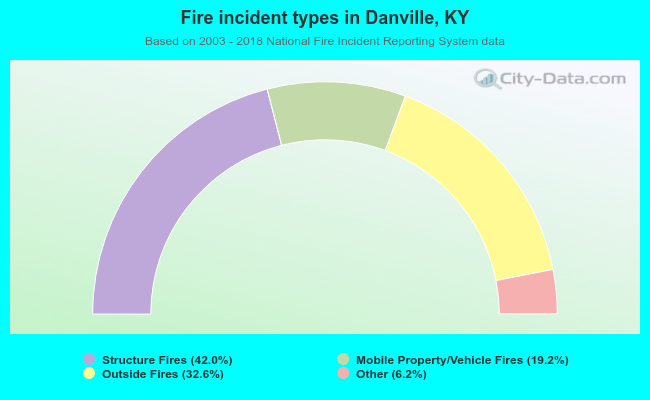 When looking into fire subcategories, the most incidents belonged to: Structure Fires (42.0%), and Outside Fires (32.6%).